
Capital Markets Playbook | Q1 2023

2022 Q4 Summary
- Market expectations for inflation moved lower in Q4, providing some much-needed support in both fixed income and equity markets.
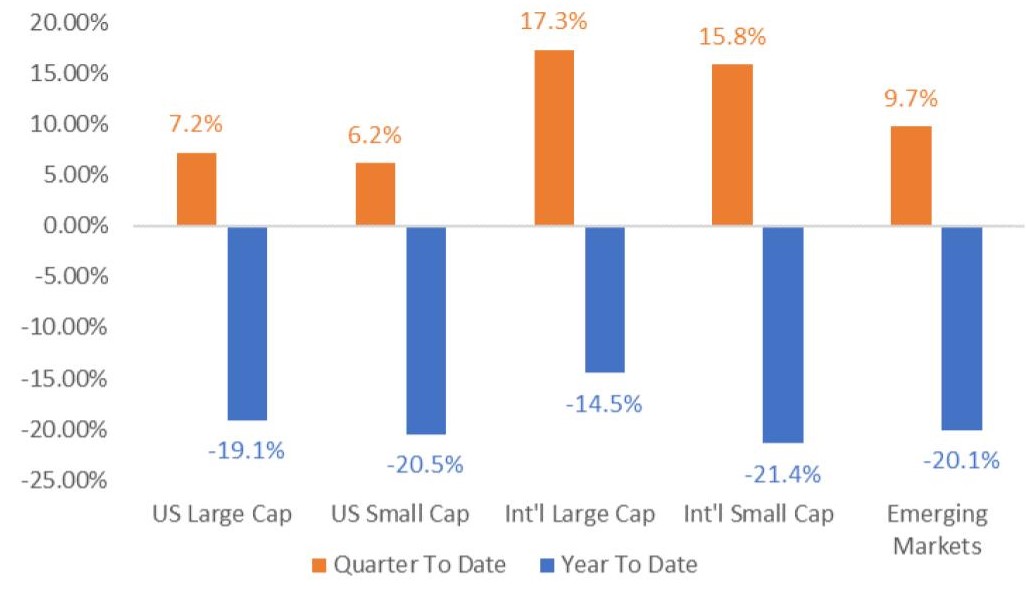
- Equity markets were mostly higher in Q4, snapping a three-quarter losing streak.
- Despite a strong Q4, most major equity asset classes were down close to 20% in 2022.
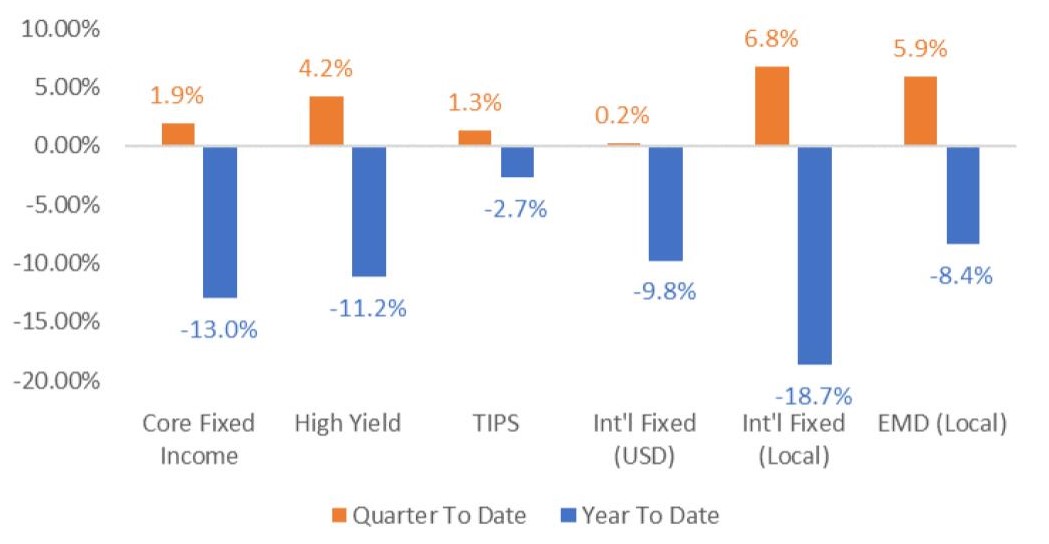
- Fixed income finished the year on a positive note, but 2022 ended up being the worst year for bonds on record.
- Most major fixed income asset classes were down at least 10% in 2022.
Equity Market Performance
Fixed Income Market Performance
Macroeconomic Outlook for the Next 6-12 Months
- Economic growth
- A global recession is not certain in 2023, but the probability of a decrease in economic activity is relatively high.
- U.S. economic growth is expected to decline in 2023 as higher interest rates begin to impact spending and investment activity.
- Although a slowdown may seem likely, any recession in the U.S. would likely be “moderate” compared to recessions of the past.
- Consumer spending and investment is likely to decline until tighter monetary policy interventions subside.
- Unemployment is expected to increase slightly as businesses attempt to manage expenses prudently.
- Wage growth pressure will ease across the aggregate economy as a result of lower demand for labor.
- Certain sectors of the economy (ex: housing) that were red hot during the pandemic may see meaningful slowdowns in activity.
- U.S. economic growth is expected to decline in 2023 as higher interest rates begin to impact spending and investment activity.
- A global recession is not certain in 2023, but the probability of a decrease in economic activity is relatively high.
- Inflation
- Expect inflation to moderate meaningfully over the next 12 months but remain above the Federal Reserve’s 2% target until 2024.
- Supply chain constraints are improving, prices for goods are moderating, and labor shortages are improving in some sectors of the U.S. economy.
- Moderate increases in unemployment will likely continue to push wage growth lower.
- Higher interest rates will begin to slow consumption and investment activity across the aggregate economy.
- Expect inflation to moderate meaningfully over the next 12 months but remain above the Federal Reserve’s 2% target until 2024.
- Interest rates
- The Federal Reserve has indicated its short-term policy rate will be above 5% at some point in 2023.
- A pause in rate hikes is likely in 2023 as economic conditions weaken in the U.S.
- Markets have priced in rate cuts in 2023, which represents a disconnect with the Federal Reserve.
- The Federal Reserve will continue to shrink the size of its balance sheet through its quantitative tightening program. These activities may create moderate upside pressure on longer-term yields.
- That said, the upward movement on yields could be offset by “flight to safety” behaviors if the threat of an economic contraction increases.
- The Federal Reserve has indicated its short-term policy rate will be above 5% at some point in 2023.
Market Outlook for the Next 6-12 Months
- Equities
- Equity markets should stabilize once the Federal Reserve signals a “pause” to its interest rate hike cycle, but overall volatility may remain above historical norms.
- Equity valuations are in line with long-term historical averages, but further downside in U.S. equities cannot be ruled out as the market discounts the potential for more aggressive or sustained tightening actions from the Federal Reserve.
- Expect equity market volatility to decline materially if/when the Federal Reserve communicates plans for pausing (or ending) interest rate hikes.
- Growth stocks in the U.S. may outperform value stocks during periods of slowing inflation and slowing economic growth.
- Growth stock valuations declined materially in 2022 but remain well above those of value stocks. That said, declining economic expectations could lead to short-term outperformance from growth stocks.
- International and emerging market stocks remain “cheap” compared to U.S. stocks.
- Relative to U.S. equities, long-term valuations for international and emerging market equities remain attractive. The potential for a weaker U.S. dollar may boost non-U.S. economies.
- Fixed income
- Fixed income volatility is likely to remain elevated for corporate credit as economic growth slows and default risk increases.
- Volatility in higher-quality fixed income assets (ex: treasuries) may soften as economic growth concerns increase the demand of safer assets.
2023 Theme: Tighter Monetary Policy
- The Federal Reserve uses its monetary policies to achieve its dual mandate of:
- Full employment
- Price stability
- The Fed raised its overnight policy rate to 4.25% by the end of 2022, but inflation remains stubbornly high.
- Markets expect inflation to continue to soften in 2023 as tighter monetary policy reduces spending and investment across the aggregate economy.
- Inflation is expected to remain above the Fed’s long-term target through 2023.
- Inflation is expected to remain above the Fed’s long-term target through 2023.
- Unemployment remains near historical lows despite tighter monetary policy.
- Markets are expecting unemployment to tick higher in 2023 as monetary policy tightening continues to filter through the economy.
- Takeaways:
- If inflation continues trending lower and unemployment trends higher, the Fed will likely pause its interest rates hikes.
- The Fed may adopt an even tighter monetary policy than expected if unemployment continues to remain near historical lows.
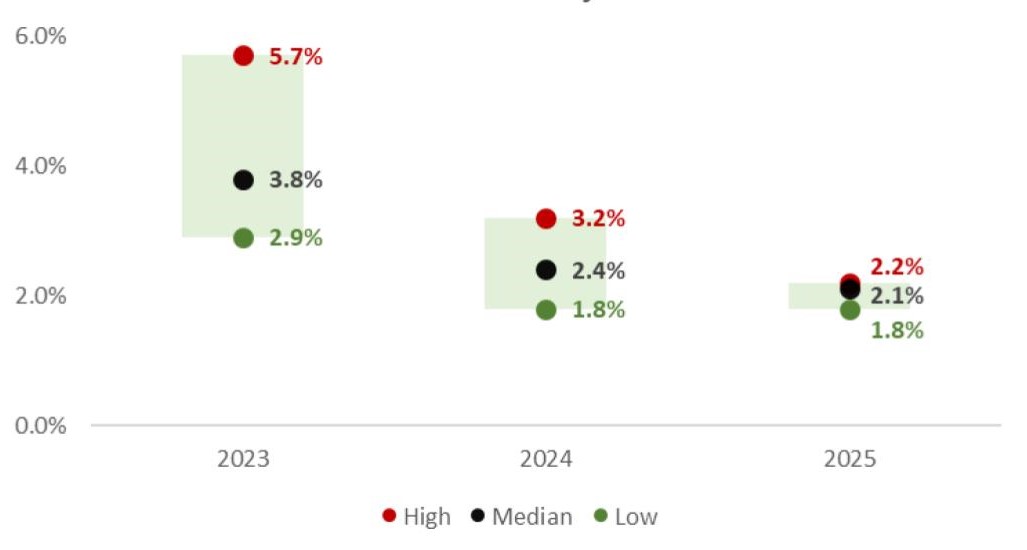
US Core CPI Projections
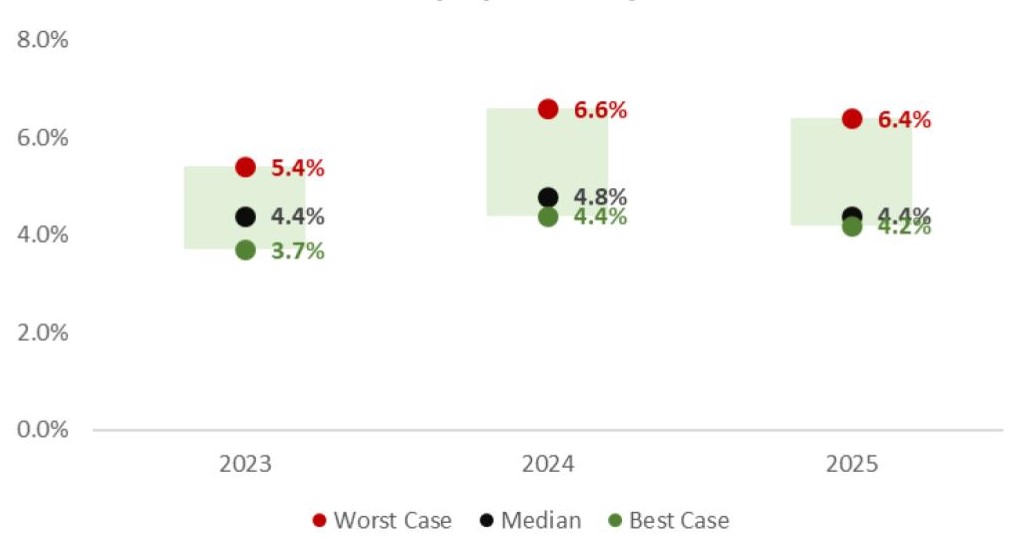
US Unemployment Projections
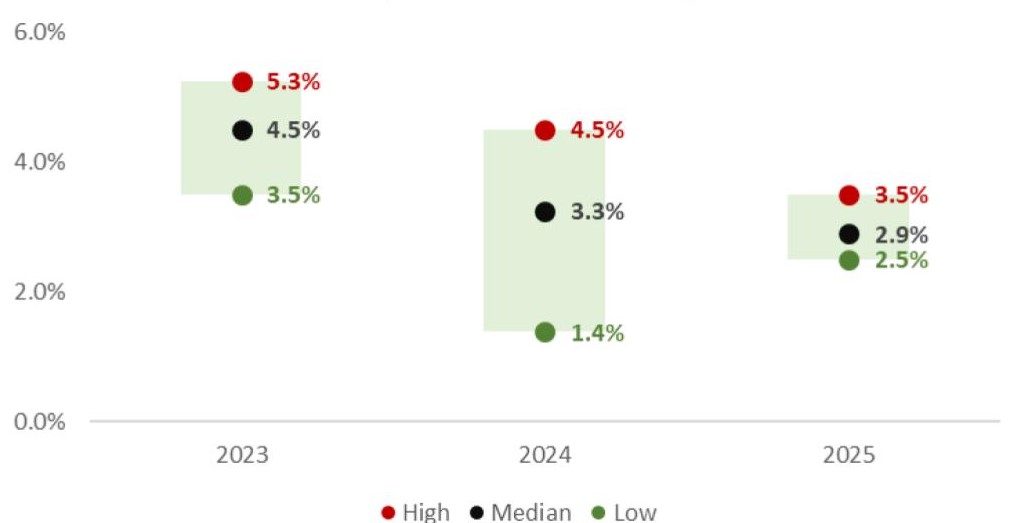
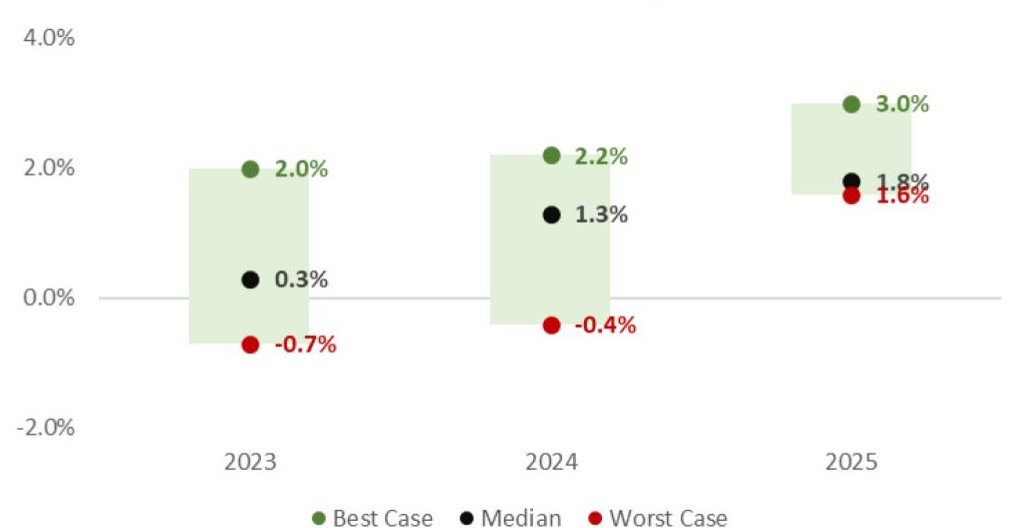
- The Federal Reserve continues to maintain its hawkish stance on monetary policy and has signaled its overnight policy rate could eclipse 5% in 2023. Its dot plot projections are as follows:
- Fed policy rate at the end of 2023: 5.00% - 5.25%
- Fed policy rate at the end of 2024: 4.00% - 4.25%
- Fed policy rate at the end of 2025: 3.00% - 3.25%
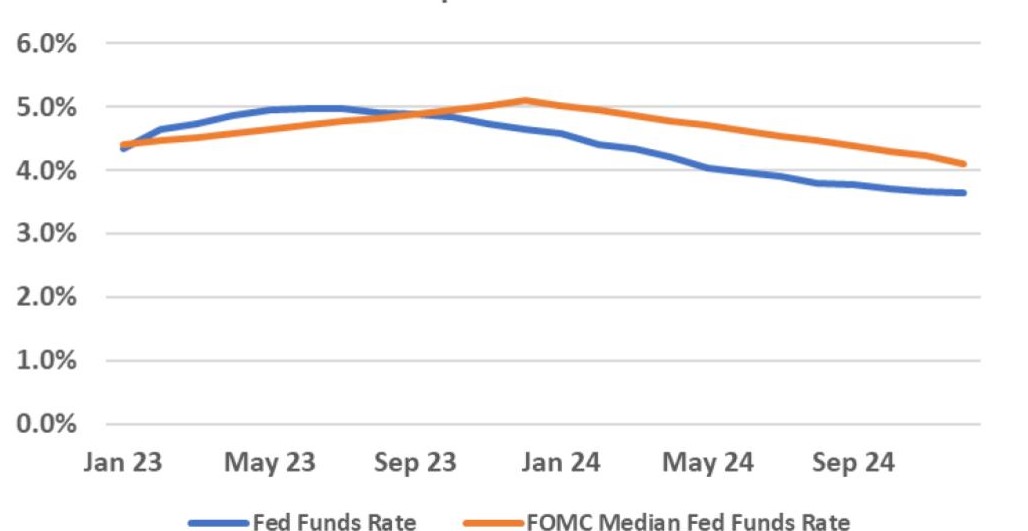
- Despite the Fed’s hawkish forward guidance, however, markets are currently pricing in rate cuts in mid-2023.
- Markets believe that the Fed may need to change its monetary policy course as economic growth slows in 2023.
- While a disconnect between markets and the Fed is not uncommon, it can lead to periods of increased market volatility over the short term.
- Takeaways:
- Fed communication will continue to move markets in the quarters ahead and market volatility will likely remain elevated until market participants are more certain about the path of Fed rate hikes.
- Stubbornly low unemployment may result in higher-than-expected Fed policy rates and heighten market volatility over the short term.
Market Implied Fed Funds Policy Rate
Market Implied Fed Funds Rate
2023 Theme: Slowing Inflation
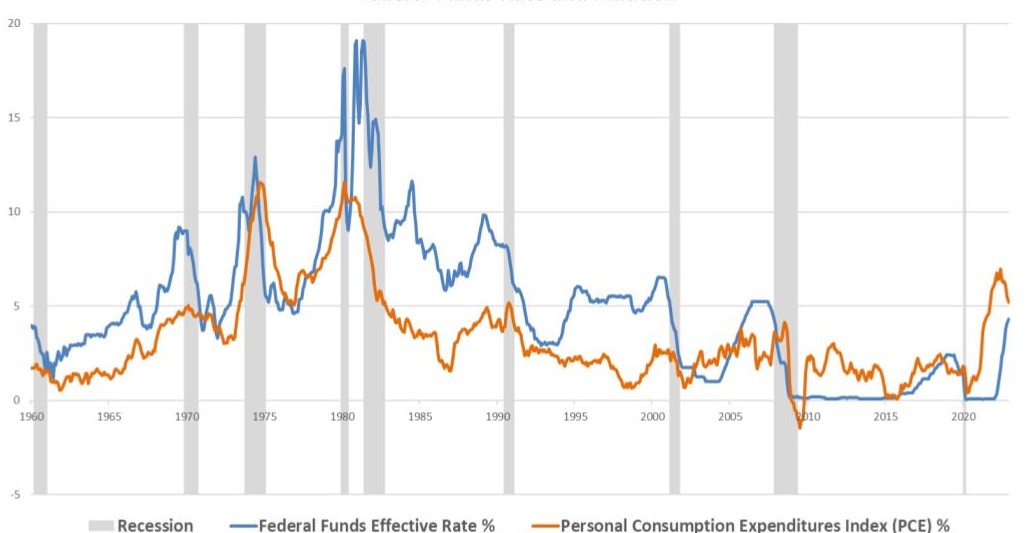
- To control inflation, the Federal Reserve will attempt to keep the Fed Funds Rate above the PCE’s annual % change. The labor market has been resilient against the rate hikes.
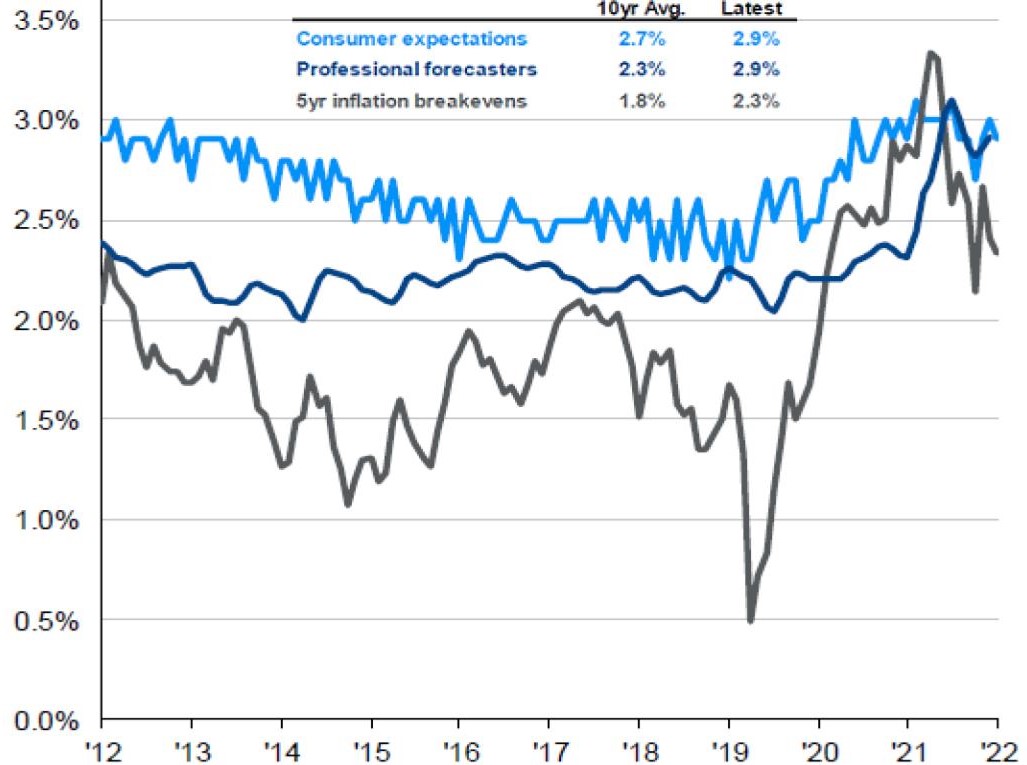
- Inflation expectations carry a tremendous amount of weight when it comes to the Fed’s policy decision making.
- Long-term inflation expectations reached a high of 3.4% during the pandemic but have come down meaningfully since the Fed began raising interest rates in 2022.
- Forward-looking inflation expectations (5 year) remain somewhat “anchored” to the Fed’s inflation target of 2%.
- Takeaways:
- Even though inflation dominated the market’s attention in 2022, market participants are not concerned about runaway inflation over the intermediate and long term.
- A strong labor market, a normalization in supply chains and a well-anchored long-term inflation expectation may soften the impact of raising rates and contribute to a softer landing.
Federal Funds Rate And Inflation
Inflation Expectations (5 Yr)
2023 Theme: Decelerating Economic Growth
- Tighter monetary policy from the Federal Reserve has resulted in declining growth expectations in the U.S.
- Consensus expectation is that the U.S. will grow below the long-term trend rate of 2% through 2024.
- Some forecasters anticipate an economic recession in the U.S. over the near term as higher interest rates begin to slow spending and investment activity.
- Despite growing calls that a recession is imminent, however, few expect the U.S. to enter a “deep recession” in 2023.
- Takeaways:
- Recession risk is more elevated than normal as a result of monetary policy intervention from the Fed.
- If inflation remains stubbornly high, it could result in a more aggressive Fed, which increases the probability of recession even further.
- If a U.S. recession does occur soon, it is likely to be relatively minor compared to U.S. recessions of the past.
US Real GDP Growth Projections
The Business Cycle
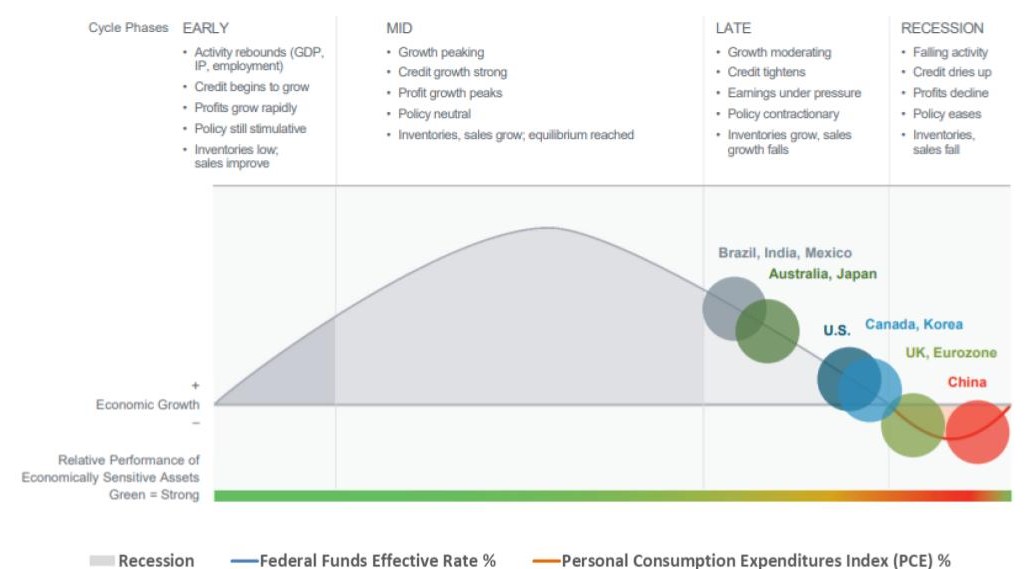
- The U.S. economy is decelerating at an accelerating pace and is in the late phase of the economic cycle.
- A recession, which can be defined as two consecutive quarters of negative economic growth, may be on the horizon.
- Other parts of the global economy may be decelerating at a greater clip than the U.S. (ex: eurozone, UK) due to the strength of the U.S. dollar and its impact on foreign finances and trade.
- Eurozone economies and the UK have been badly hit by higher energy prices and energy shortages due to the Ukraine war.
- China’s economy is attempting to recover from COVID-19 related shutdowns and may be poised to return to economic expansion before any other major economy. With the easing of the zero-covid policy, growth in China should pick up in 2023.
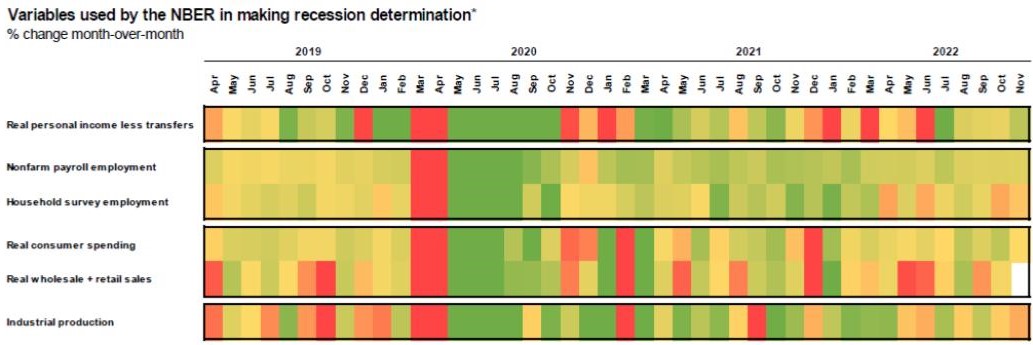
- The table highlights six different economic variables that are most important to economists.
- Green shaded areas represent “strong” economic data, while red shaded areas represent “weak” economic data.
- Personal income, consumer spending and industrial production data have been weakening since 2021 and are expected to continue to weaken over the short term.
- Despite a slowdown in some of the factors listed in the table, historically low unemployment has provided a cushion to slowing growth in recent months.
2023 Theme: Equity Market Volatility
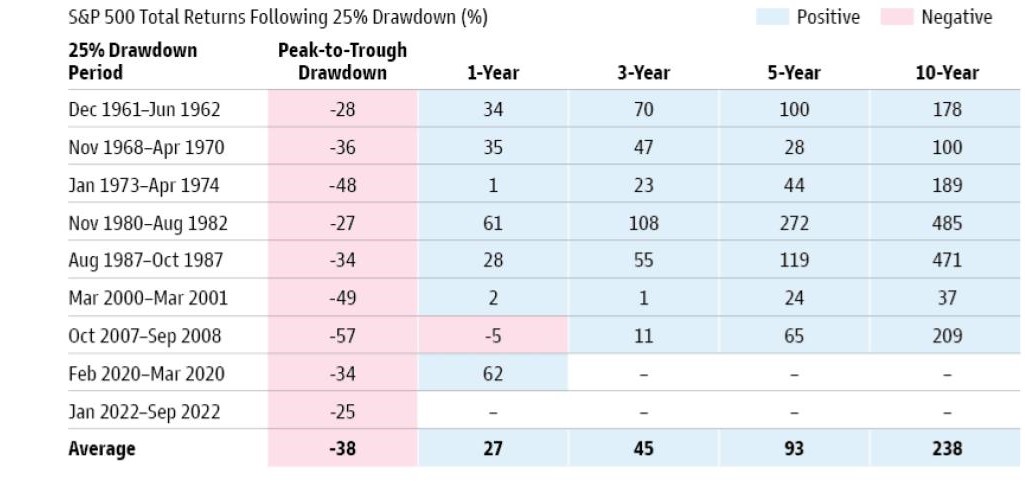
- The S&P 500, a broad-based benchmark for U.S. Large Cap equity, declined 18% in 2022 (through 12/31/2022).
- The S&P 500, a broad-based benchmark for U.S. Large Cap equity, declined 18% in 2022 (through 12/31/2022).
- Example:
- The S&P 500 declined 27% over a 23-month period ending in August 1982.
- The S&P 500 returned more than 100% over a 36-month period following the drawdown.
- The S&P 500 returned close to 500% over a 10-year period following the drawdown.
- Example:
- Takeaways:
- Despite the poor equity performance in 2022, long-term investors are wise to stay invested.
- Volatility is likely to remain a theme in 2023 as economic uncertainty lingers and each data point becomes an opportunity for a clearer picture.
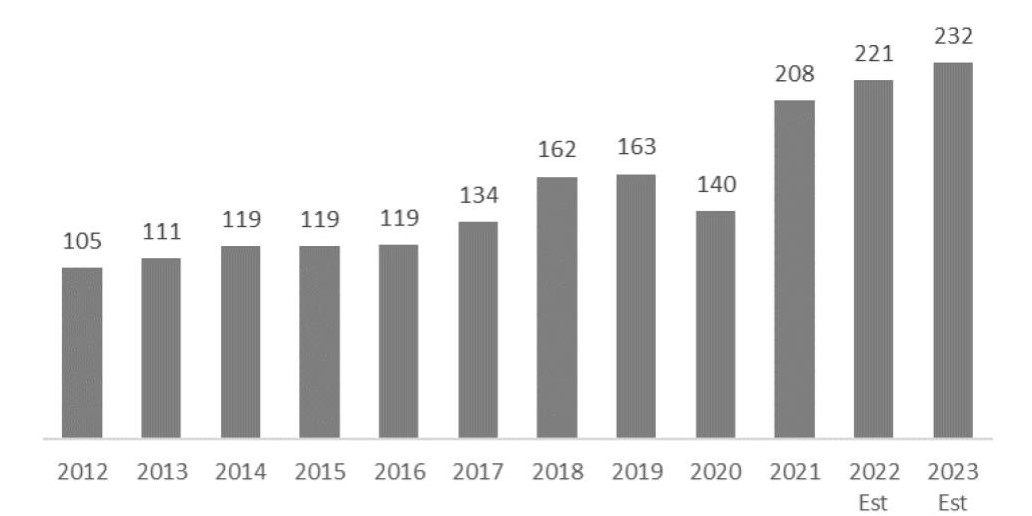
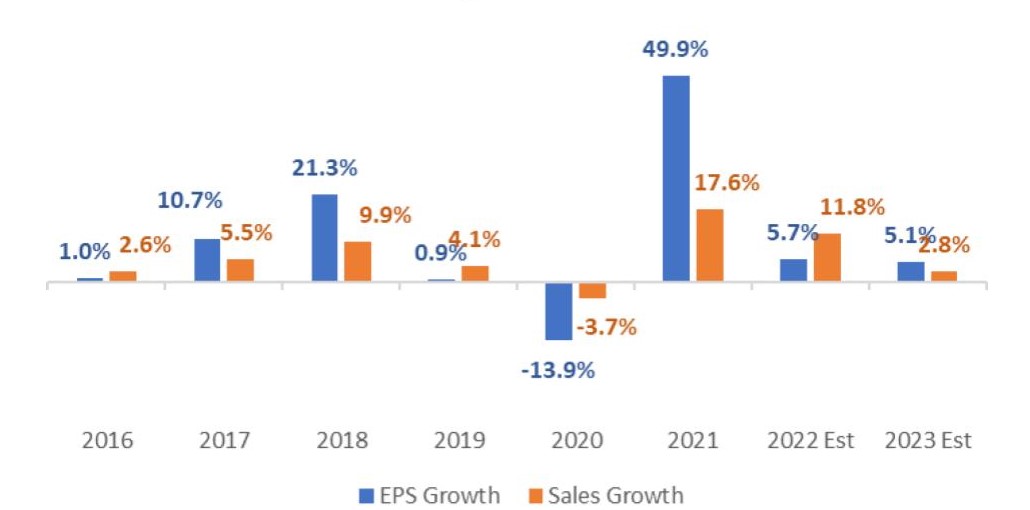
2023 Theme: Decelerating Growth in Earnings
- U.S. corporate earnings growth estimates – while still high – continue to decline.
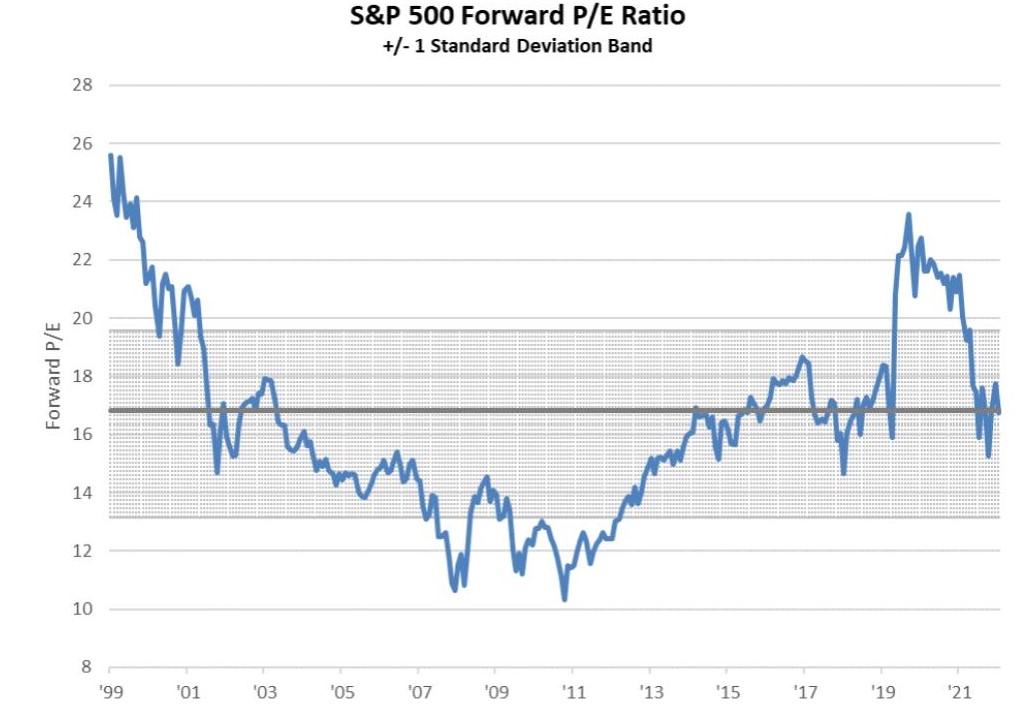
- Forward P/E of the S&P 500 rebounded in the quarter due to the price increase of the index combined with reduced forward EPS estimates. Current forward P/E is back to 17.3x – in line with its 10-year average but well above the 15.2x recorded at the end of 3Q.
- Corporate earnings are expected to grow by approximately 5% in 2023.
- The 10-year annual earnings growth rate is 8.5%.
- U.S. recessions, on average, have resulted in EPS declines of 20%. It is possible equity markets have not fully priced in a recessionary period.
- Takeaways:
- Slowing growth, tightening financial conditions, lingering supply chain pressures and FX headwinds could pressure companies’ bottom line in 2023.
- A reduction in earnings estimates could result in heightened volatility in U.S. equity markets.
S&P 500 Bottom-Up EPS Actuals & Earnings
S&P 500 Earnings & Revenue Growth
2023 Playbook: U.S. Equity
- Valuation measures of U.S. stocks have declined to more reasonable levels.
- U.S. Large Cap equities have risen toward their 25-year average of approximately 16.8x. While downside risk remains for equity markets, current levels are more attractive from a historical perspective.
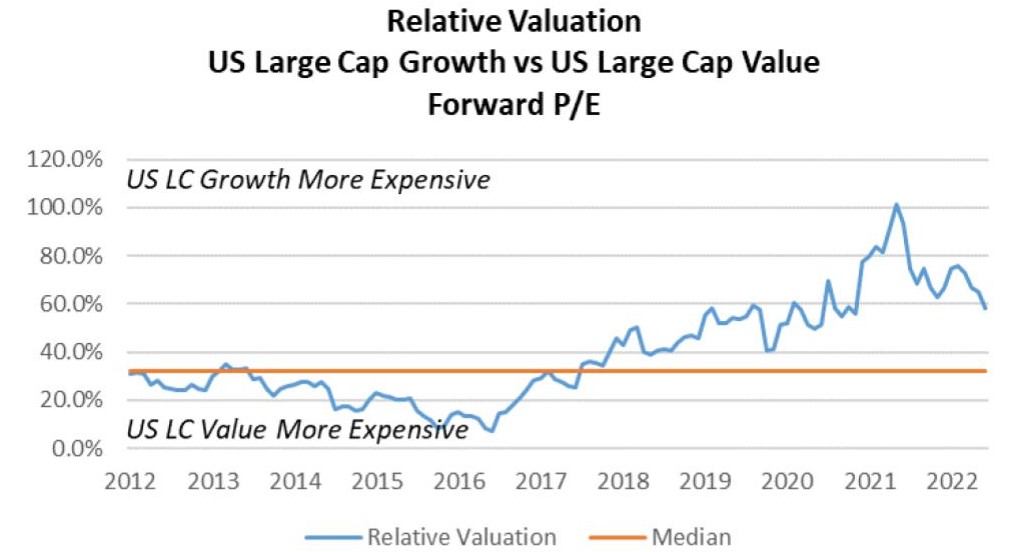
- “Growth” stocks in the U.S. are significantly more expensive than “value” stocks, despite their significant underperformance year to date.
- Equity valuations outside the U.S. remain far below their long-run averages as well.
- Higher interest rates will likely continue to compress valuations. U.S. value stocks and international equities may be better positioned to outperform.
- Takeaways:
- Depressed equity valuation levels in U.S. Large Cap should set investors up for better returns in the long run.
- Investors may be best suited to apply a balanced allocation between “growth” and “value” as we navigate the current environment.
2023 Playbook: Foreign Equity
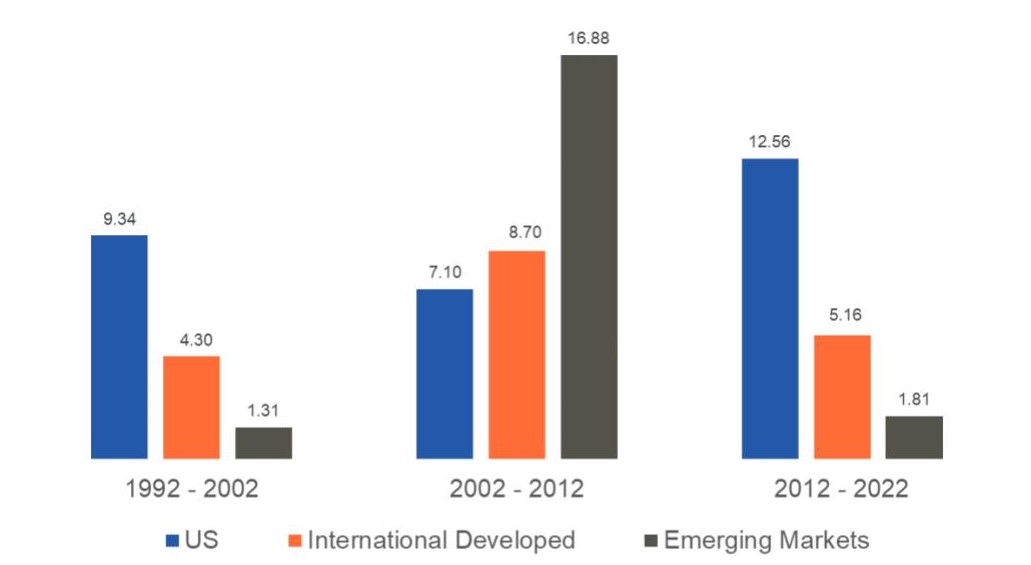
- U.S. investors have benefited from home-country overexposure in the past 10 years.
- Consistent outperformance of U.S. equity markets is not a natural state and will reverse at some point.
- Historical returns over longer time periods show that return differences between U.S. and international markets are cyclical in nature (the current cycle of U.S. outperformance is the longest ever recorded).
- Even though U.S. equities entered a bear market in 2022, international and emerging market equities appear more attractive, and have a higher potential for upside as a result.
- Takeaways:
- Investors who shy away from international and emerging market equities are likely reducing the upside potential of their investment portfolios.
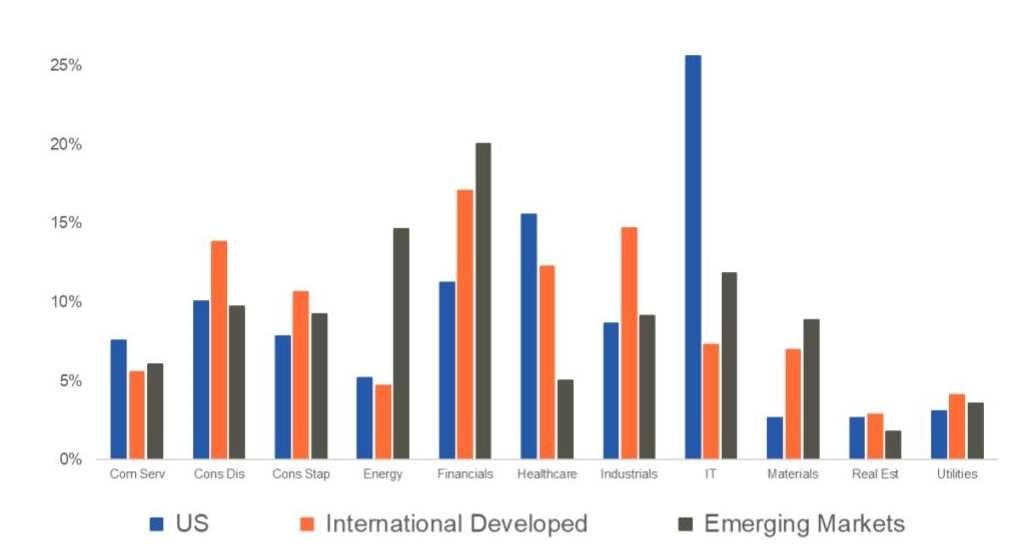
- Benefits of a globally diversified portfolio are not solely geographic. Sector exposure varies across global markets.
World Equity Annualized Market Performance
World Equity Sector Allocation
2023 Playbook: International Equity
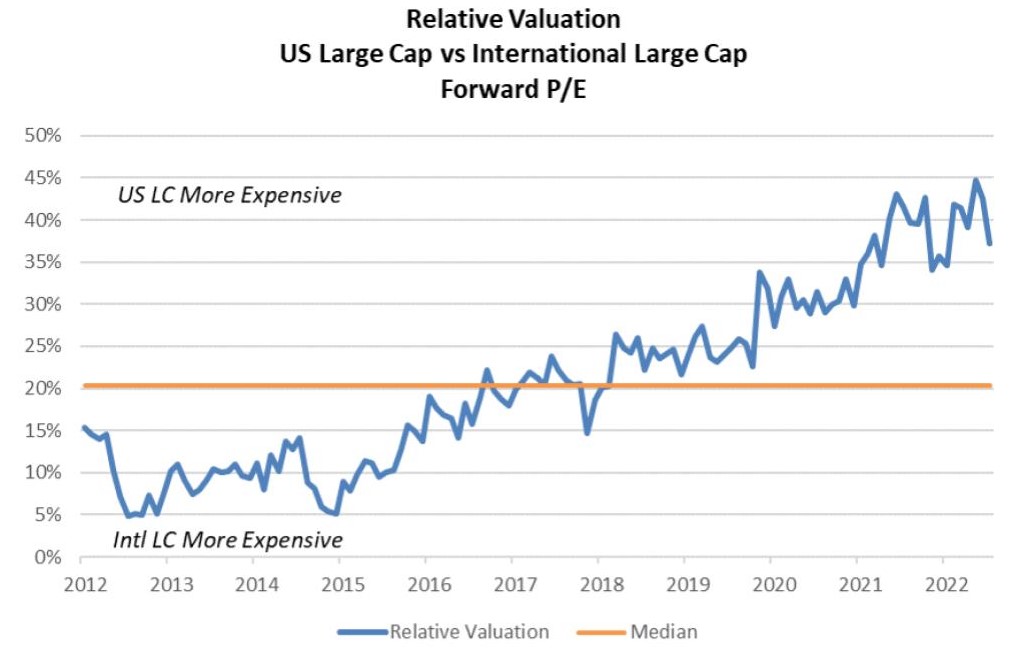
- The U.S. equity market remains more expensive relative to international equity markets.
- Based on historical fundamentals, U.S. equity markets are nearly twice as expensive as international stocks.
- Relative strength in U.S. equity markets has accelerated since the beginning of the pandemic.
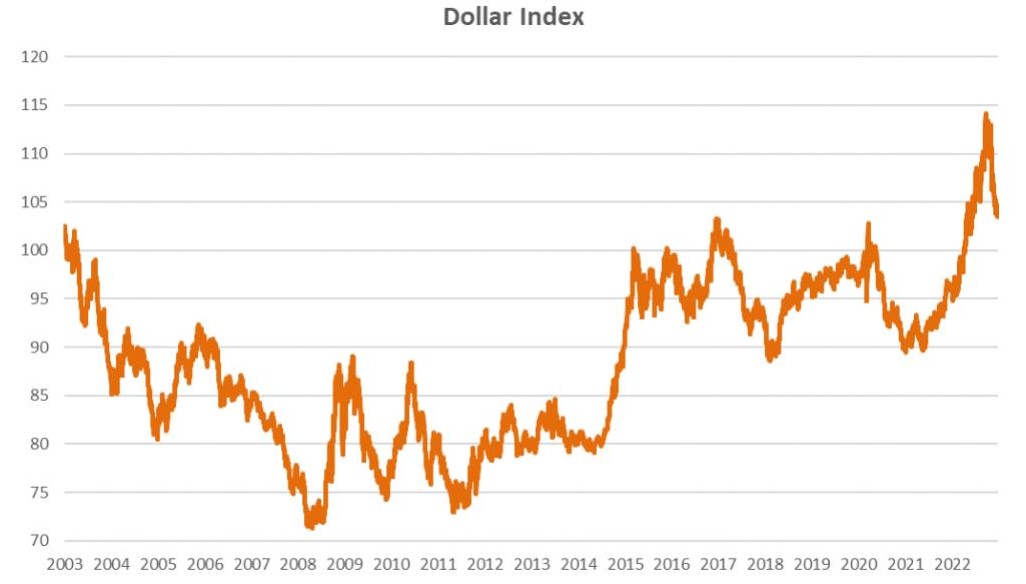
- In September of 2022, the U.S. dollar reached a peak against a basket of foreign developed-market currencies.
- Continued weakening of the dollar is expected as interest rate differentials between the U.S. and international markets tighten in 2023.
- A weaker U.S. dollar provides a tailwind for international equities.
- Takeaway:
- U.S. dollar devaluation presents a tactical opportunity for investors in international equity.
2023 Playbook: Fixed Income
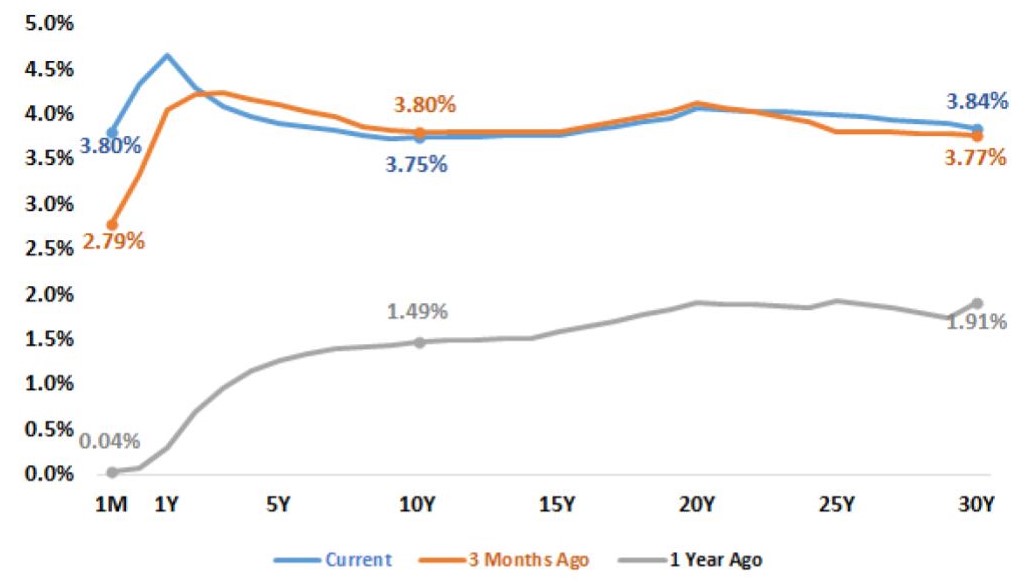
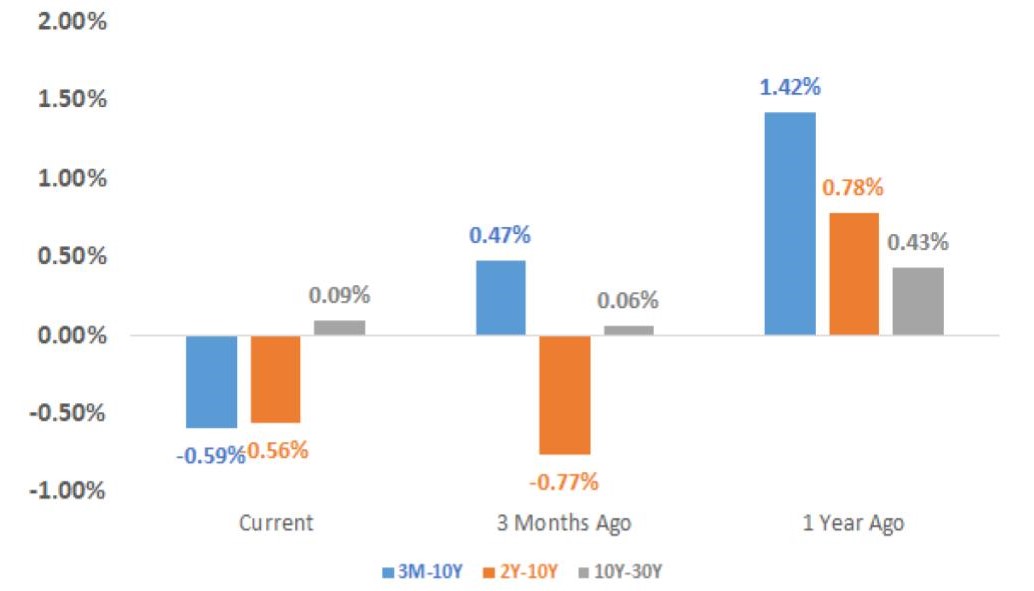
- The U.S. Treasury yield curve inversion increased throughout 2022 as Federal Reserve monetary policy pushed short-term rates higher.
- Yield curve inversion occurs when short-term rates are higher than long-term rates.
- Yield curve inversion has historically led to disruptions in borrowing and lending activity that may result in meaningful declines in economic activity.
- The Treasury yield curve inversion could continue to widen in 2023 as short-term rates are expected to remain elevated for some time.
- Long-term yields, which are highly impacted by growth expectations (and less by Fed policy), typically decline during periods of economic weakness.
- Takeaway:
- Tactically extending duration in high-quality fixed income may be prudent as the U.S. economy slows in 2023.
US Treasury Yields
US Treasury Yields Spreads
2023 Playbook: Fixed Income
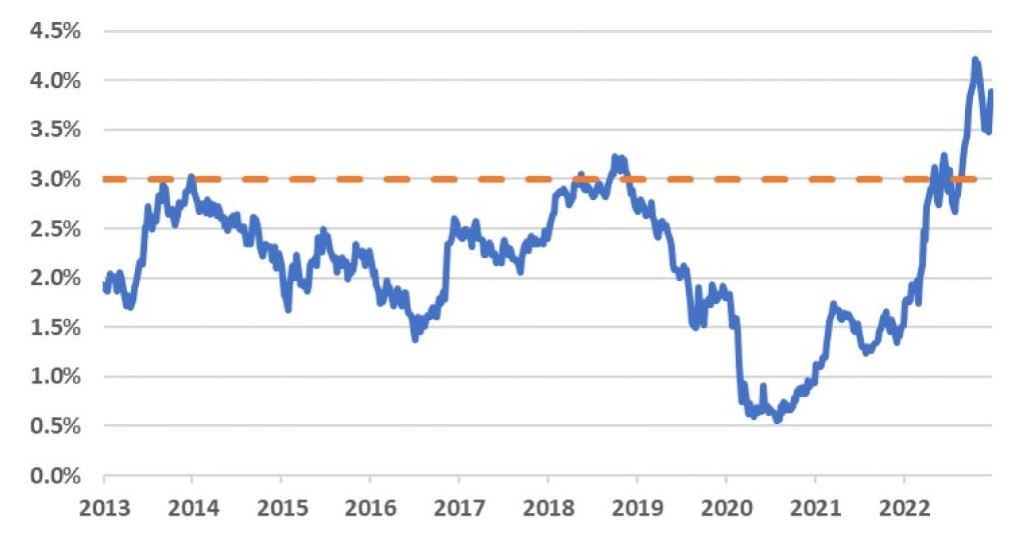
- Long-term treasury yields have increased dramatically in 2022 and are currently well above the longer-term median.
- Since the global financial crisis, 10-year treasury yields have struggled to remain above 3% for any extended period of time.
- Long-term interest rates are determined by market supply and demand (i.e., long-term rates are not dramatically impacted by Federal Reserve interest rate policy).
- Supply and demand for long-term interest rates are primarily driven by the market’s expectations for economic growth and inflation.
- Expectations for slower growth and lower inflation may put a “cap” on long-term rates over the short term.
- Takeaways:
- While rates have surprised to the upside in 2022, it is likely that long-term rates will decline if economic growth and inflation expectations continue to decline.
- Extending portfolio duration may be the most appropriate way for fixed income investors to navigate the uncertain environment.
10-Year Treasury Yield
2023 Playbook: Fixed Income
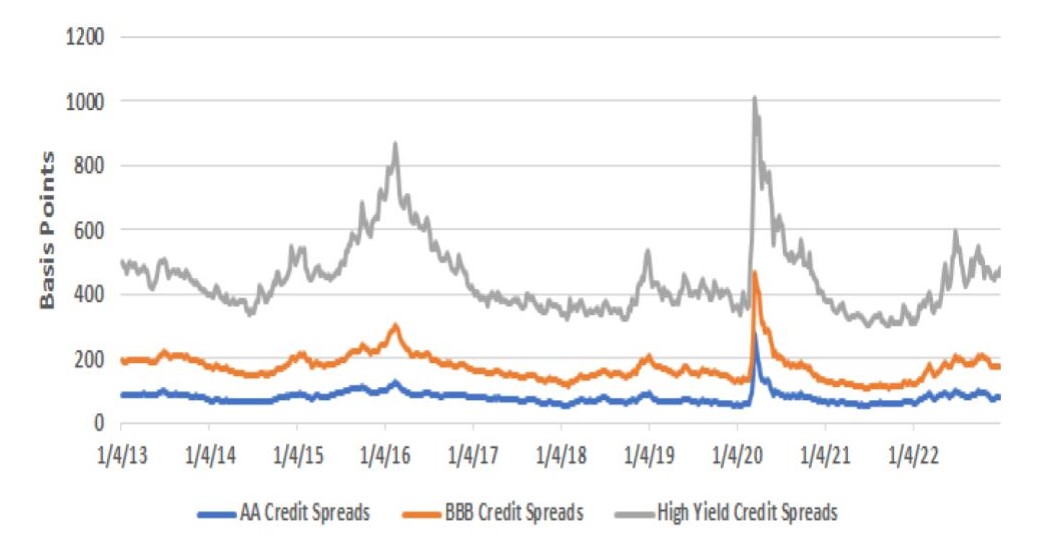
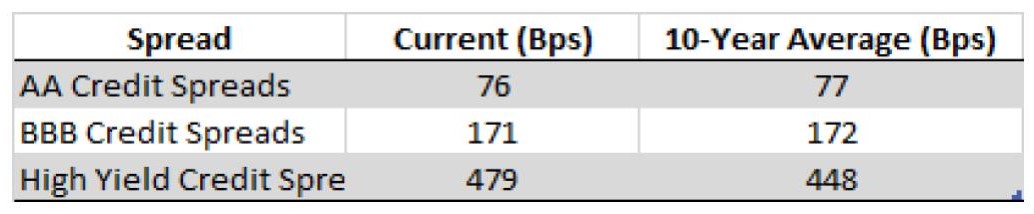
- The difference between corporate bond yields and Treasury yields (credit spreads) has increased throughout 2022 after reaching historical lows in 2021.
- Spreads for lower-quality fixed income (ex: high yield) steadily widened through the year and have remained above the 10-year average.
- This so called “spread widening” is a direct result of increasing investor concerns over default risk.
- Despite the recent widening of credit spreads, further deterioration in economic strength could result in more upward pressure on corporate bond yields (and lower prices).
- Takeaway:
- Repositioning the fixed income portfolio to include higher-quality credit is prudent given the current risks to the economic outlook.
US Credit Spreads
2023 Playbook Summary
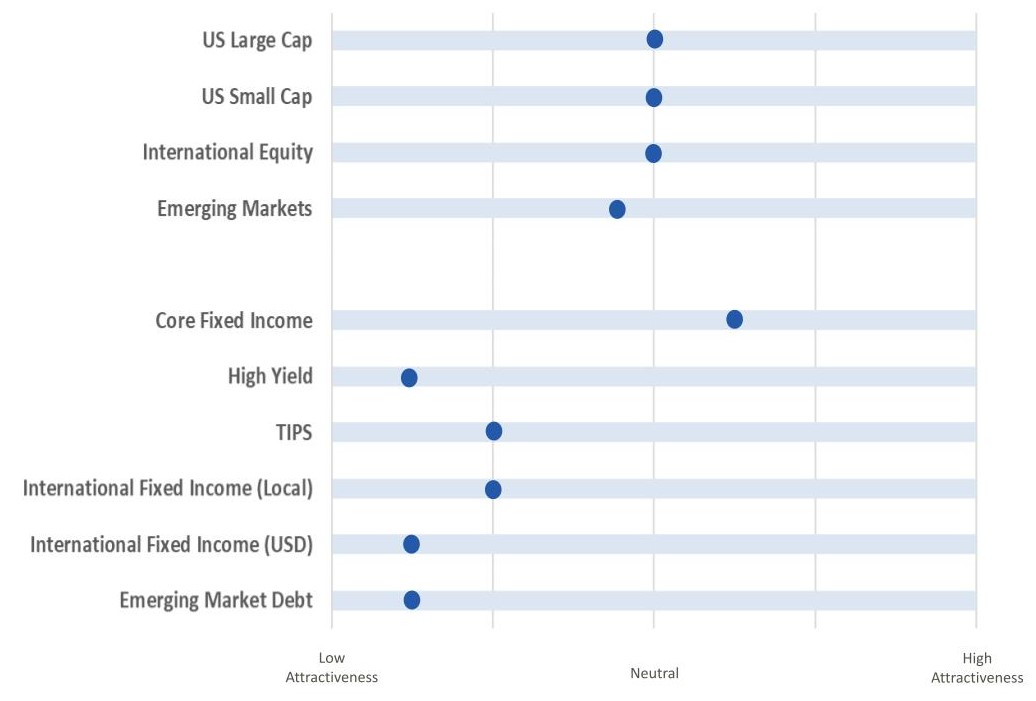
- The above table indicates where each major investment asset class falls on the distribution of attractiveness (from low to high). This table is meant to provide a standardized and comparable view of the level of opportunity in each asset class category.
- In subsequent quarters, we will discuss any movement along the scale for each asset class and the driving forces behind the change in outlook.
Disclaimer

