
Capital Markets Playbook | Q1 2024

Q4 2023 Summary
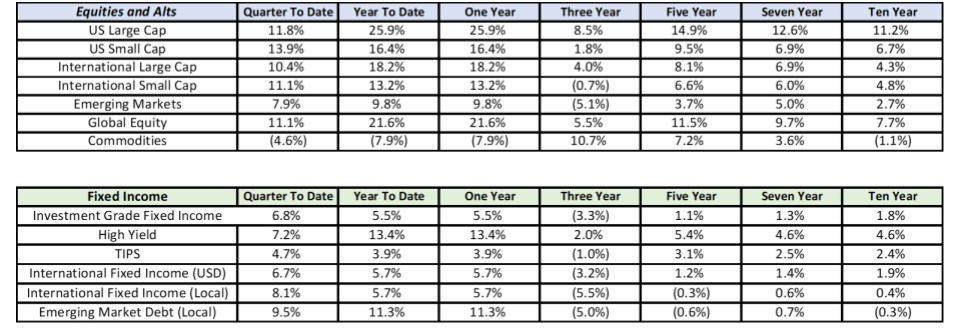
- Equity markets experienced very strong returns in Q4 as strong economic growth continued and investors prepared for the Federal Reserve to cut rates in 2024.
- Most major equity asset classes were up at least 10% in the fourth quarter. U.S. Small Cap led most major equity asset classes (+13.9%).
- For the calendar year, every major equity asset class was up at least 9.8%. U.S. Large Cap led most major equity asset classes (+25.9%).
- Fixed income markets posted strong gains in the fourth quarter, too.
- All major fixed income asset classes were up at least 4.7% in Q4. Investment-grade fixed income was up close to 7% in the final quarter of 2023.
- High Yield has outperformed all other major fixed income asset classes in 2023 (+13.4%) as investor concerns over defaults have yet to materialize.
2023: In Review
- 2023 U.S. macroeconomic review
- The Federal Reserve raised its short-term policy rate to 5.25-5.50% and signaled that rate cuts could come in 2024.
- Higher interest rates did not have a meaningful impact on consumer spending, unemployment or economic growth.
- Consumer spending grew about 2% more than expected.
- Unemployment, currently at 3.7%, remained near multi-decade lows.
- When final numbers are released, it is likely that U.S. GDP grew above 3% over the past year (or about 1% higher than the long-term trend rate).
- Inflation* declined about 2% in 2023 and is currently about 2% higher than the Fed’s long-term inflation target of 2%.
- 2023 equity market review
- Equity market volatility declined to “pre-pandemic” levels.
- Broad-based equity markets finished the year up more than 20%.
- The Dow Jones and S&P 500 indices finished 2023 at (or near) all-time highs.
- The majority of equity market gains in the U.S. came largely from technology stocks.
- U.S. Large Cap stocks led all major equity asset classes
- U.S. Large Cap outperformed U.S. Small Cap, international equities and emerging market equities.
- “Growth” stocks outperformed “value” stocks.
- 2023 fixed income market review
- Fixed income markets experienced the highest levels of volatility seen in decades.
- U.S. Intermediate and U.S. Long Treasuries suffered through periods of substantial change. For example, the 10-year Treasury began the year at around 3.9%, reached 5.0% in August, and fell to below 4.0% by the end of the year.
- High-yield fixed income was the best performing fixed income asset class as credit spreads remained near historical lows.
- Fixed income markets experienced the highest levels of volatility seen in decades.
2024: Expectations for the Year Ahead
- 2024 U.S. macroeconomic preview
- Expected case
- Consumer spending grows at a slower pace. An outright decline in consumption growth is not expected.
- Business investment slows, but an outright decline in business investment is not expected.
- Unemployment increases at the margin and remains below 5%.
- Economic growth will be below its long-term growth rate of 2%.
- Inflation will continue to moderate, but will not reach the Federal Reserve's 2% inflation target in 2024.
- The Fed cuts rates by at least 0.75%.
- Expected case
- 2024 equity market preview
- Expected case
- Equity markets are more volatile in 2024 than they were in 2023.
- Companies with strong balance sheets, reliable cash flows and consistent earnings may outperform in 2024.
- International and emerging market equities may outperform U.S. equities as the Fed cuts rates and the dollar weakens.
- Expected case
- 2024 fixed income market preview
- Expected case
- Volatility in fixed income markets will “normalize.”
- The U.S. Treasury Yield curve will flatten, but yield curve inversion may persist throughout most of the year.
- Shorter duration bond yields will fall as the Fed cuts its short-term policy rate.
- Intermediate and long-term yields may remain “rangebound.”
- Credit spreads on high-risk fixed income (i.e. High Yield) will widen as consumer spending, business investment and economic growth slows.
- Expected case
Risks to the "Expected Case" in 2024
- Monetary policy tightening ends up leading to significant declines in consumer spending and business investment
- Since monetary policy tightening tends to take time to filter through the broader economy, it is possible that the full impact of rate hikes will hit in 2024.
- Rates stay higher than expected for even longer than anyone expects
- If the recent moderation in inflation reverses course (or if unemployment remains very low), the Fed could elect to cut rates at a slower pace. Additionally, the possibility of rate hikes in 2024 cannot be entirely ruled out.
- Financial system issues
- Quantitative tightening by the Fed could create an oversupply of U.S. Treasuries, which could push Treasury yields higher (and slow borrowing and lending activity).
- Fiscal deficit concerns become more acute
- Further increases in the fiscal deficit would likely lead to even more debt issuance from the U.S. Treasury, which could push interest rates higher.
- Geopolitical fracturing
- Conflicts in Ukraine and Middle East could escalate into broader conflicts that are inflationary in nature (i.e. supply chain disruptions).
- Competition between the U.S. and China could escalate further and create headwinds for the global economy at large.
- Real estate
- Certain segments of the commercial real estate market (ex: office) may experience a wave of credit deterioration that could negatively impact lending and borrowing activity across the U.S.
- Unknown unknowns
- The most threatening risks to the “expected case” are always those that catch markets by surprise. The most recent example of an “unknown unknown” risk is the emergence of COVID-19 in late 2019/early 2020.
2024 Theme: Slowing Economic Growth
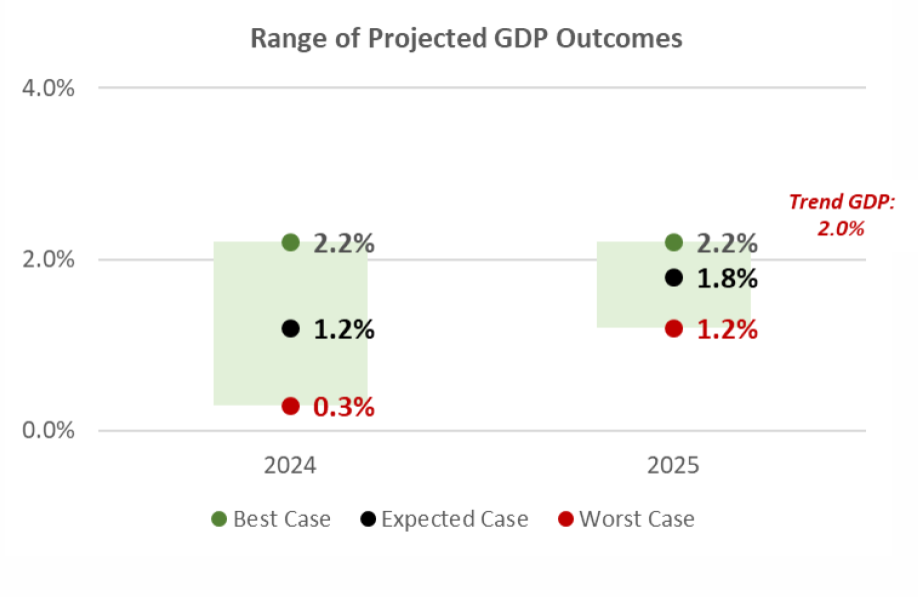
- The U.S. is coming off a year of surprisingly strong economic growth in 2023. It will be challenging for the U.S. economy to grow as strongly over the next year or two.
- It is likely that economic activity in the U.S. will be “below trend” in 2024 and 2025.
- The U.S. may avoid a recession in 2024, but the probability of an economic contraction in 2024 cannot be ruled out.
- Scenarios
- Best case
- Economic activity in the U.S. is in line with its long-term trend rate over the next two years.
- Expected case
- Economic activity in the U.S. is below its long-term trend rate over the next two years.
- Worst case
- Economic activity is well below the long-term trend rate over the next two years.
- The U.S. enters into a recession that is likely “mild” by historical comparisons.
- Best case
2024 Theme: Higher Unemployment, Slower Wage Growth
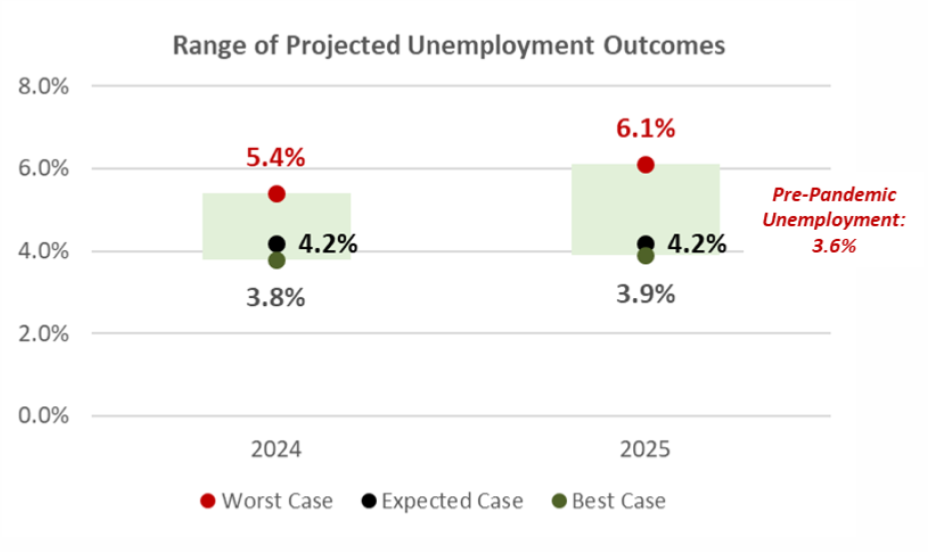
- The labor market has begun to cool in recent months, but unemployment remains near historic lows (3.7%).
- Surveys indicate, however, that businesses plan to slow hiring activity in 2024.
- Scenarios
- Best case
- Unemployment is largely unchanged from its current level and remains near historic lows over the next two years.
- Expected case
- As economic growth slows in the U.S., unemployment ticks higher, but remains below 5% over the next two years.
- Worst case
- Unemployment exceeds 6% by the end of 2024 as a result of meaningfully slower economic growth.
- Best case
2024 Theme: Slowing Inflation
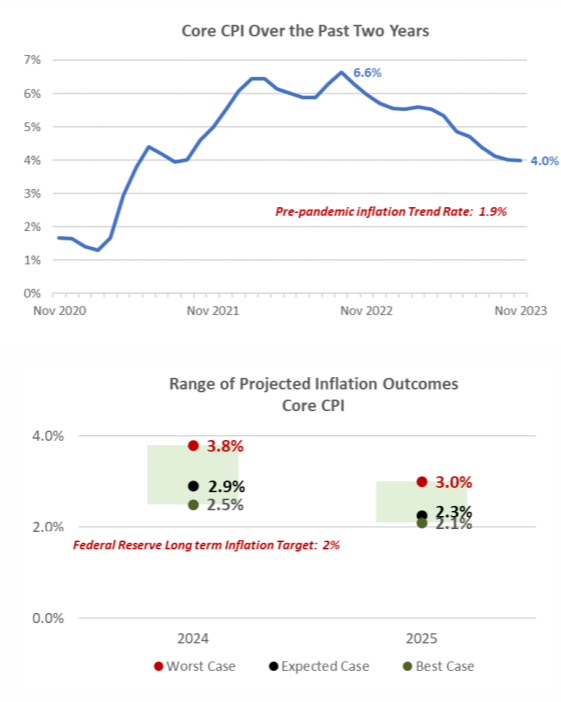
- Inflation has moved lower in recent months and appears to be heading lower in the months ahead.
- Core CPI has declined more than 2.5% since peaking in September of 2022.
- Inflation has been moderating at a faster pace over the past several months but remains well above the Fed’s 2% inflation target.
- Scenarios
- Best case
- Inflation falls abruptly as a result of slower economic growth and is close to the Fed’s long-term inflation target before the end of 2024.
- Expected case
- Inflation continues to moderate slowly and is close to the Fed’s 2% target by the end of 2025.
- Worst case
- Inflation continues to be sticky throughout the aggregate economy and remains well above the Fed’s long-term inflation target through the end of 2025.
- Best case
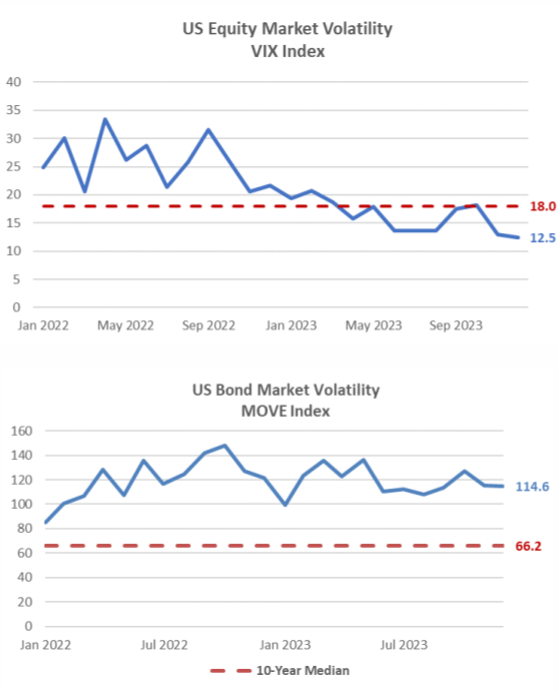
2024 Theme: Market Volatility
- Equity market volatility was well below its long-term average in 2023, while volatility in fixed income markets was much higher than normal.
- Equity market volatility is likely to increase in 2024, while fixed income volatility is expected to decline as the Fed begins to cut its short-term policy rate.
- Takeaways
- Market volatility is, by definition, a function of uncertainty.
- Volatility will decline as market participants have more clarity into the future of inflation, monetary policy, economic growth, etc.
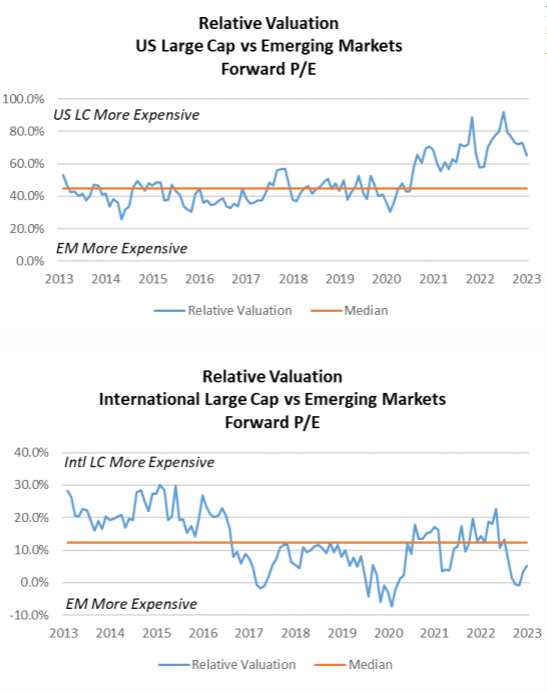
2024 Playbook: International Equity
- Fundamental valuation metrics suggest that U.S. equities are “expensive” on a relative basis.
- International equity and emerging market equities are more attractive than U.S. Large Cap on a relative valuation basis.
- Economic considerations
- If economic growth surprises to the upside in 2024, international and emerging market equities will likely outperform U.S. equities.
- If there is a global economic recession in 2024, U.S. equities will likely outperform international and emerging market equities.
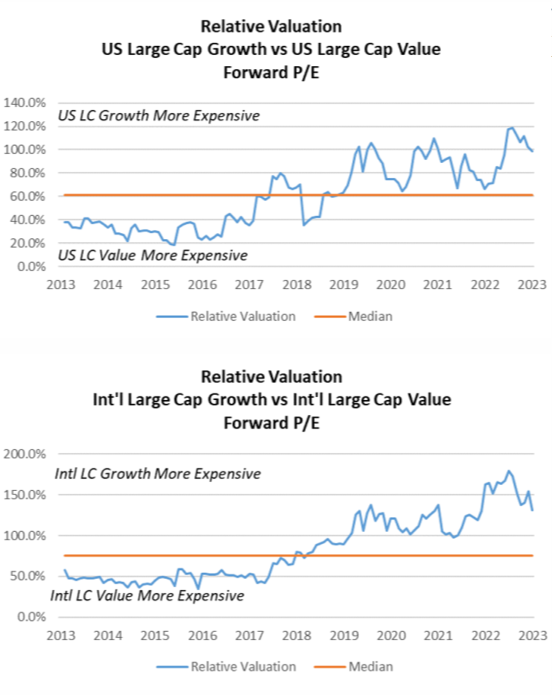
2024 Playbook: U.S. Equity
- Fundamental valuation metrics suggest that “growth” equities are still substantially more expensive than “value” equities.
- Economic considerations
- If economic growth surprises to the upside in 2024, “growth” stocks will likely outperform “value” stocks.
- If there is a global economic recession in 2024, “value” stocks will likely outperform “growth” stocks.
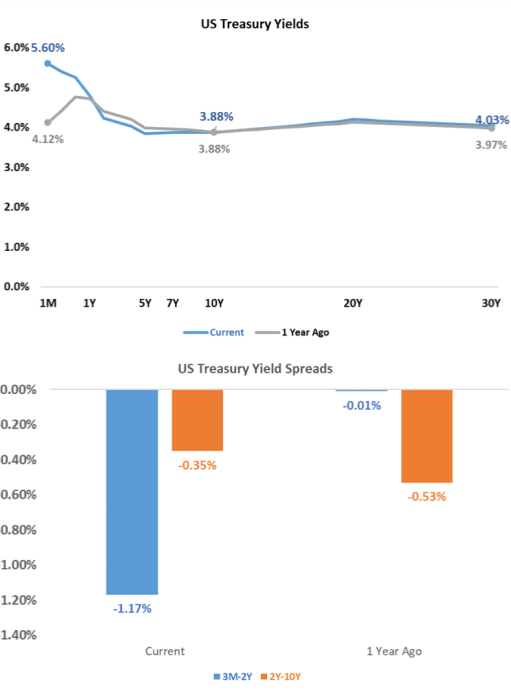
2024 Playbook: Fixed Income
- Key sections of the U.S. Treasury yield curve have been inverted since the mid-summer of 2022.
- Yield curve inversion occurs when short-term rates are higher than long-term rates.
- Yield curve inversion has historically led to disruptions in borrowing and lending activity that may result in meaningful declines in economic activity.
- The longer a yield curve inversion persists (and the larger the size of the inversion), the more likely lending and borrowing activity will decline meaningfully.
- Economic considerations
- It is likely that the yield curve will flatten but remain inverted for much of 2024.
- The more rate cuts that occur in 2024, the more likely it is that the yield curve “dis-inverts.”
- In other words, if the yield curve “dis-inverts,” it will likely be a result of slower economic growth and lower inflation expectations.
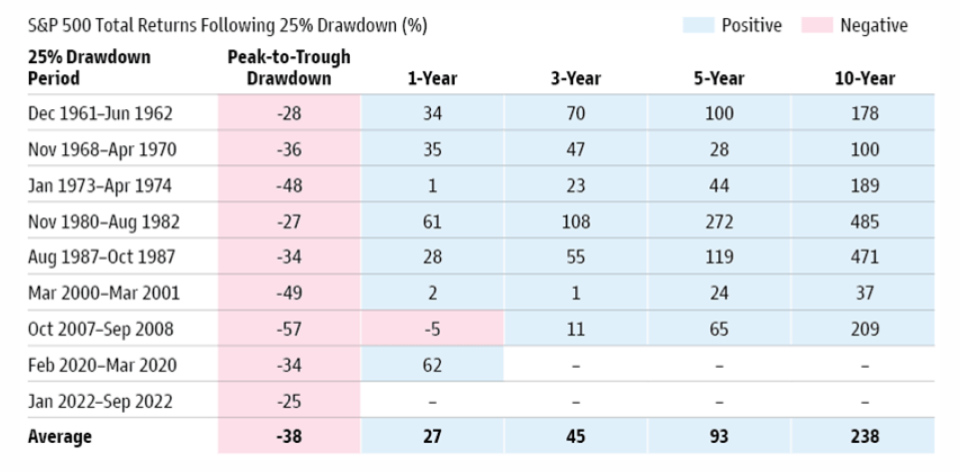
A Note About Equity Market Selloffs
- Long-term investors should remember that equity market selloffs are often followed by periods of above-normal returns.
- Investors that try to “time” market selloffs (i.e., sell stocks ahead of a market decline) usually fail to reinvest prior to the subsequent stock market recovery.
- Takeaways
- Long-term investors should never attempt to time the market.
- Riding out market volatility is the best way to build wealth over the long term.
2023 Playbook Summary
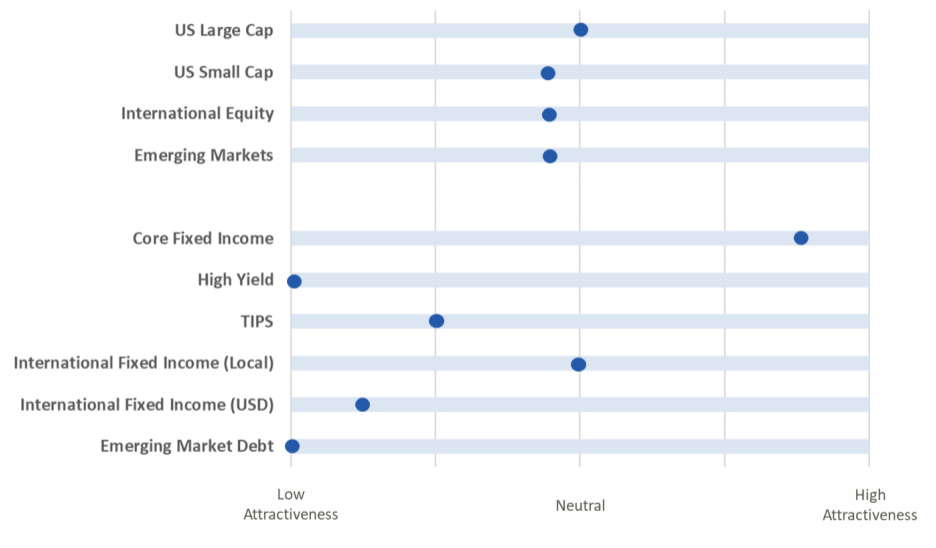
- The above table indicates where each major investment asset class falls on the distribution of attractiveness (from low to high). This table is meant to provide a standardized and comparable view of the level of opportunity in each asset class category.
- In subsequent quarters, we will discuss any movement along the scale for each asset class and the driving forces behind the change in outlook.

