
Capital Markets Playbook | Q3 2022

2022 Q2 Summary
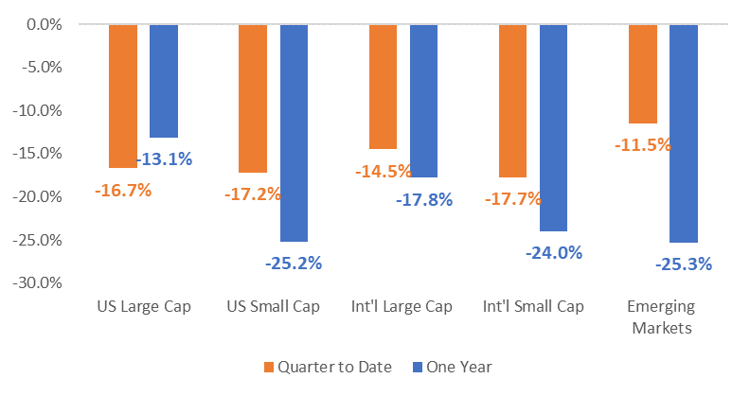
- Equity markets finished lower for a third consecutive quarter as the Federal Reserve tightened monetary policy in hopes of deterring rising inflation.
- U.S. equity markets experienced large declines across all sectors with small cap and growth stocks leading the plunge.
- Continued strength in the U.S. dollar led to large declines in Non-U.S. equity. Non-U.S. value stocks outperformed Non-U.S. growth stocks by a fairly wide margin.
- A large number of broad equity market indices have entered into “bear market territory” as prices have declined more than 20% from recent peaks.
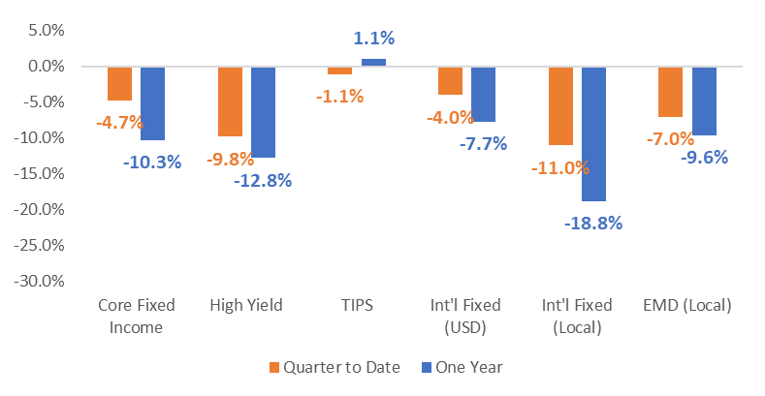
- Fixed income markets are off to the worst start in more than 50 years as inflation and expectations for aggressive monetary policy interventions forced large bond sell offs.
- All major fixed income asset classes sold off in the second quarter, including those with the highest credit quality (ex: Core Fixed Income).
- Fixed income assets that exhibit higher risk characteristics (ex: high yield) sold off the most in the second quarter as investors became more concerned over future economic growth.
Equity Market Performance
Fixed Income Market Performance
2022 Theme: The Pandemic Begins to Evolve Into An Endemic
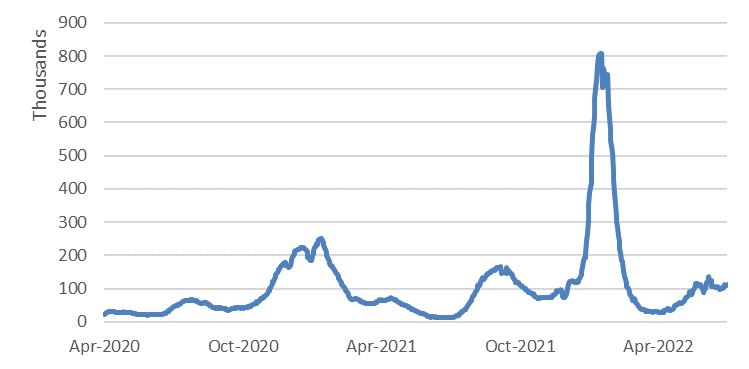
- While COVID-19 case counts and hospitalizations remain near the lowest levels of the pandemic, new variants continue to develop.
- The latest variants may result in COVID-19 “surges” before the end of the year.
- COVID-19 variants may continue to create challenges for years to come, but COVID-19 is becoming more manageable in 2022.
- Vaccinations greatly reduce the potential for severe disease, hospitalizations and death.
- Health care professionals have made tremendous progress with treatment procedures and have dramatically improved patient recovery times.
- New, less invasive vaccinations and therapies are likely to continue to hit the market in 2022.
- The combination of infections and vaccinations has the U.S. population getting closer to “herd immunity.”
- Takeaways
- The seriousness of the current or future COVID-19 variants should never be discounted, but the pandemic may show signs of evolving into an endemic in 2022.
- The potential of “economic shutdowns” are lower than they have been since the beginning of the pandemic.
U.S. COVID Confirmed Cases
7 Day Average
Macroeconomic Outlook For the Next 6-12 Months
- Economic growth
- Economic activity in the U.S. will continue to decelerate in the second half of 2022.
- The global economy (including the U.S.) is slowing as a result of inflation and tighter monetary policy. A moderate recession is likely at some point, but the timing is uncertain.
- Certain macroeconomic and market indicators (ex: inverted yield curve) are beginning to signal that an economic contraction may be on the horizon.
- The global economy (including the U.S.) is slowing as a result of inflation and tighter monetary policy. A moderate recession is likely at some point, but the timing is uncertain.
- Economic activity in the U.S. will continue to decelerate in the second half of 2022.
- Inflation
- Expect inflation to moderate meaningfully in the second half of 2022 but remain above the Federal Reserve’s 2% target through 2023.
- Although the Fed’s monetary policy interventions cannot directly impact some inflationary issues (i.e. supply constraints due to strict COVID-19 policies in China), higher interest rates are likely to slow the overall demand for goods and services and ease aggregate price pressure.
- Supply constraints will continue to improve in the second half, wage growth is expected to fall and consumption is expected to decline in the second half of 2022.
- Energy prices will remain elevated, but prices for oil and gas are expected to decline following the summer travel season as demand softens.
- Expect inflation to moderate meaningfully in the second half of 2022 but remain above the Federal Reserve’s 2% target through 2023.
- Interest rates
- The Fed may raise its short-term policy rate above 3% by the end of 2022.
- Markets have already priced in a 75bp rate hike, expected in July 2022.
- Interest rate hikes may slow, however, if inflation softens and risks to economic growth escalate.
- The Fed will continue to shrink the size of its balance sheet through its quantitative tightening program. These activities may create moderate upside pressure on longer term yields.
- That said, the upward movement on yields could be offset by “flight to safety” behaviors if the threat of an economic contraction increases.
- That said, the upward movement on yields could be offset by “flight to safety” behaviors if the threat of an economic contraction increases.
- The Fed may raise its short-term policy rate above 3% by the end of 2022.
Market Outlook For the Next 6-12 Months
- Equities
- Equity market volatility in the U.S. is likely to remain elevated until the market has more clarity around the “end game” for Federal Reserve interest rate hikes.
- Equity valuations are slightly below long-term historical averages, but further downside in U.S. equities cannot be ruled out as the market discounts the potential for more aggressive tightening actions from the Fed.
- Expect equity market volatility to decline materially if/when the Fed communicates plans for pausing (or ending) interest rate hikes.
- Growth stocks in the U.S. may outperform value stocks during periods of slowing inflation and slowing economic growth.
- Growth stock valuations have come down in 2022, but still remain well above those of value stocks. That said, declining economic expectations could lead to short-term outperformance from growth stocks.
- International and Emerging Market stocks remain “cheap” compared to U.S. stocks, but may underperform in the short term as economic prospects decline overseas.
- Relative to U.S. equities, long-term valuations for international and emerging market equities remain attractive. Continued strength in the U.S. dollar, however, may weigh on non-U.S. economies until interest rate differentials normalize.
- Equity market volatility in the U.S. is likely to remain elevated until the market has more clarity around the “end game” for Federal Reserve interest rate hikes.
- Fixed Income
- Fixed income volatility is likely to remain elevated for corporate credit as economic growth slows and default risk increases.
- Volatility in higher quality fixed income assets (ex: treasuries) may soften as economic growth concerns increase the demand of safer assets.
- Short-term yields are likely to move higher as the Fed continues its monetary policy tightening program.
- This upward move in short-term yields could be short lived if the economy contracts materially (which may result in interest rate cuts).
2022 Theme: Tighter Monetary Policy
- The Federal Reserve uses its monetary policies to achieve its dual mandate of:
- Full employment
- Price stability
- With inflation running high and unemployment close to pre-pandemic levels, the Fed has communicated its commitment to significantly tighten monetary conditions in 2022.
- The Fed believes that its monetary policy interventions will help slow inflation without creating significant increases in unemployment (i.e. “soft landing”).
- Higher levels of unemployment, sticky inflation and an economic recession cannot be ruled out, however.
- Takeaways
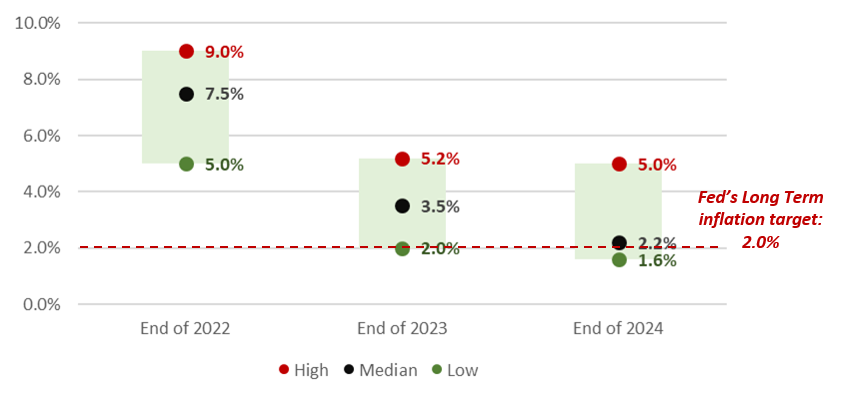
- Inflation is likely to fall meaningfully over the next few quarters, but remain above the Fed’s 2% target through the end of 2023.
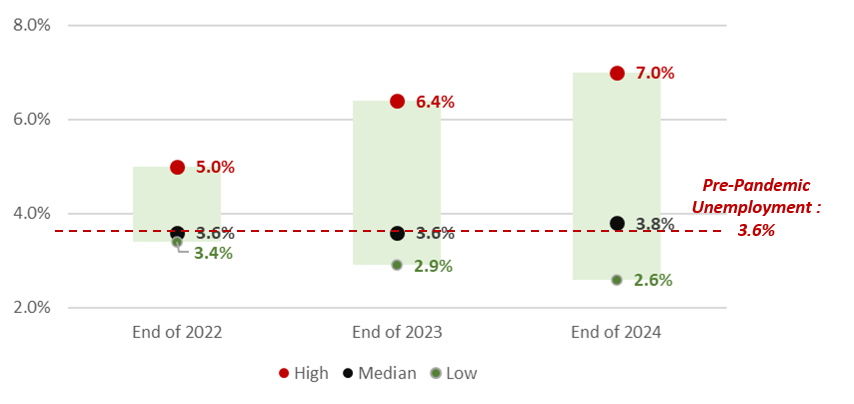
- Despite the Fed’s hope for a “soft landing,” there is a growing risk that unemployment levels increase in the quarters ahead as tighter monetary conditions dampen overall economic activity.
Projected Range of Inflation Outcomes
Projected Range of Unemployment Outcomes
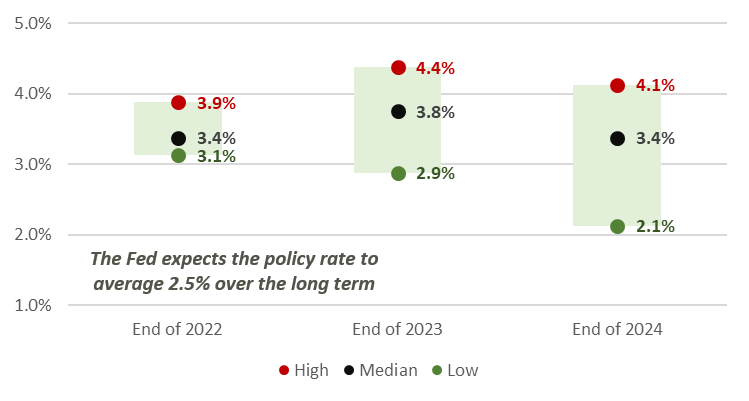
- The Federal Reserve has communicated its anticipated plans for rate hikes in 2022, which will likely change as facts and circumstances evolve.
- Fed policy rate at the end of 2022: 3.25% - 3.5%
- Fed policy rate at the end of 2023: 3.75% - 4.0%
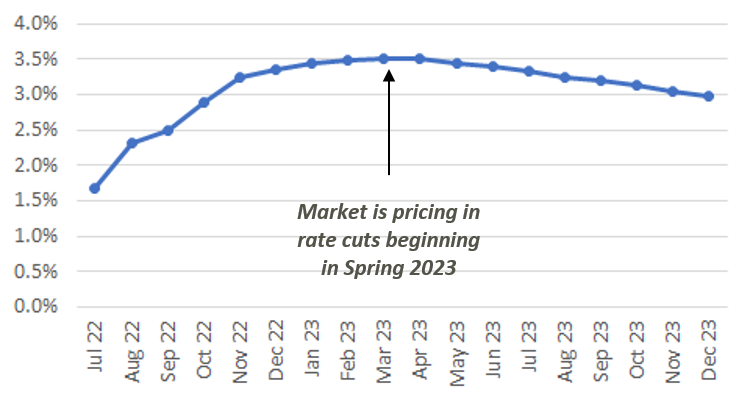
- As a result of softer-than-expected macroeconomic data, however, markets are beginning to price in rate cuts as early as April 2023.
- Takeaways
- The Fed will continue with its current plans to raise rates if inflation remains high and unemployment remains low.
- The Fed will likely pause its interest rate hikes if economic conditions warrant a less aggressive monetary policy.
- Fed communication will continue to move markets in the quarters ahead and market volatility will likely remain elevated until market participants are more certain about the path of Fed rate hikes.
Projected Range of Fed Funds Policy Rate
Market Implied Fed Funds Rate
2022 Theme: Inflation
- Despite the recent explosive growth in inflation, forward looking inflation expectations remain somewhat “anchored” to the Federal Reserve’s inflation target of 2%.
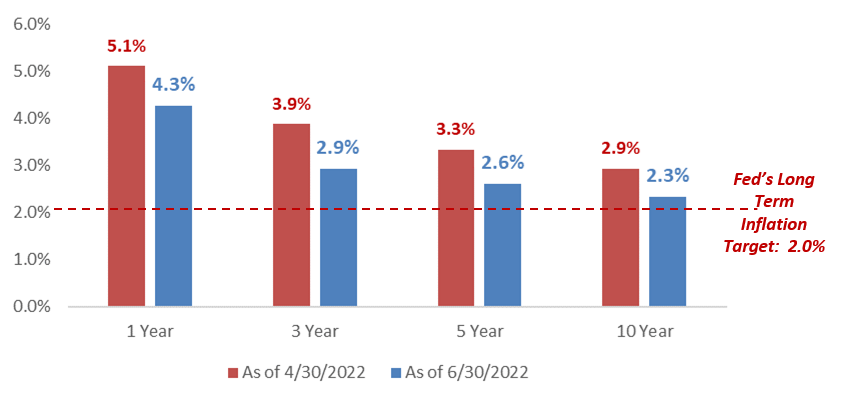
- Market-implied inflation expectations have declined meaningfully in the second quarter of 2022.
- Market-based inflation expectations have declined about 20% (on a relative basis) since the end of April 2022.
- Example (see chart):
- In April 2022, the market expected inflation to be 5.1% in one year’s time.
- In June 2022, the market expected inflation to be 4.3% in one year’s time.
- Takeaway
- Even though inflation has dominated the market’s attention in 2022, market participants are not concerned about runaway inflation over the intermediate and long term.
Market Implied Inflation Expectations
2022 Theme: Decelerating Economic Growth
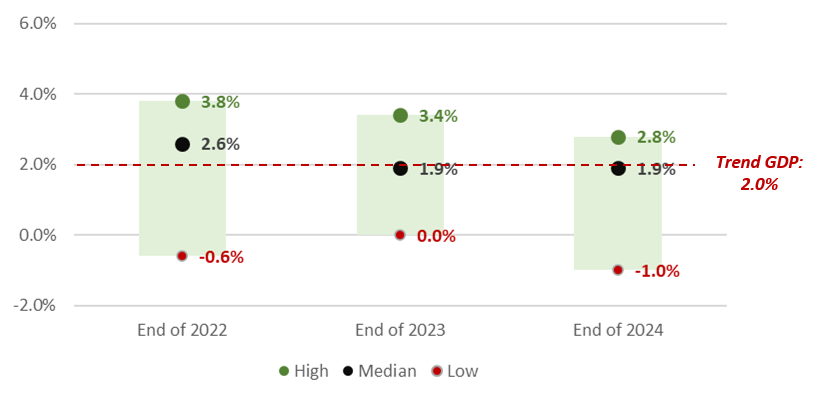
- U.S. economic growth projections have declined in recent weeks as investors discount the prospect of tighter monetary policy interventions from the Federal Reserve.
- The decline in growth projections reflects growing concern that economic activity in the U.S. will contract at some point in 2022.
- The majority of market analysts still anticipate above trend economic growth in 2022, but the risk of a recession cannot be ruled out.
- Takeaway
- The prospects of higher interest rates will likely have a more meaningful impact of future economic growth in the U.S. than any other macroeconomic variable.
Projected Range of GDP Outcomes
The Economic Cycle
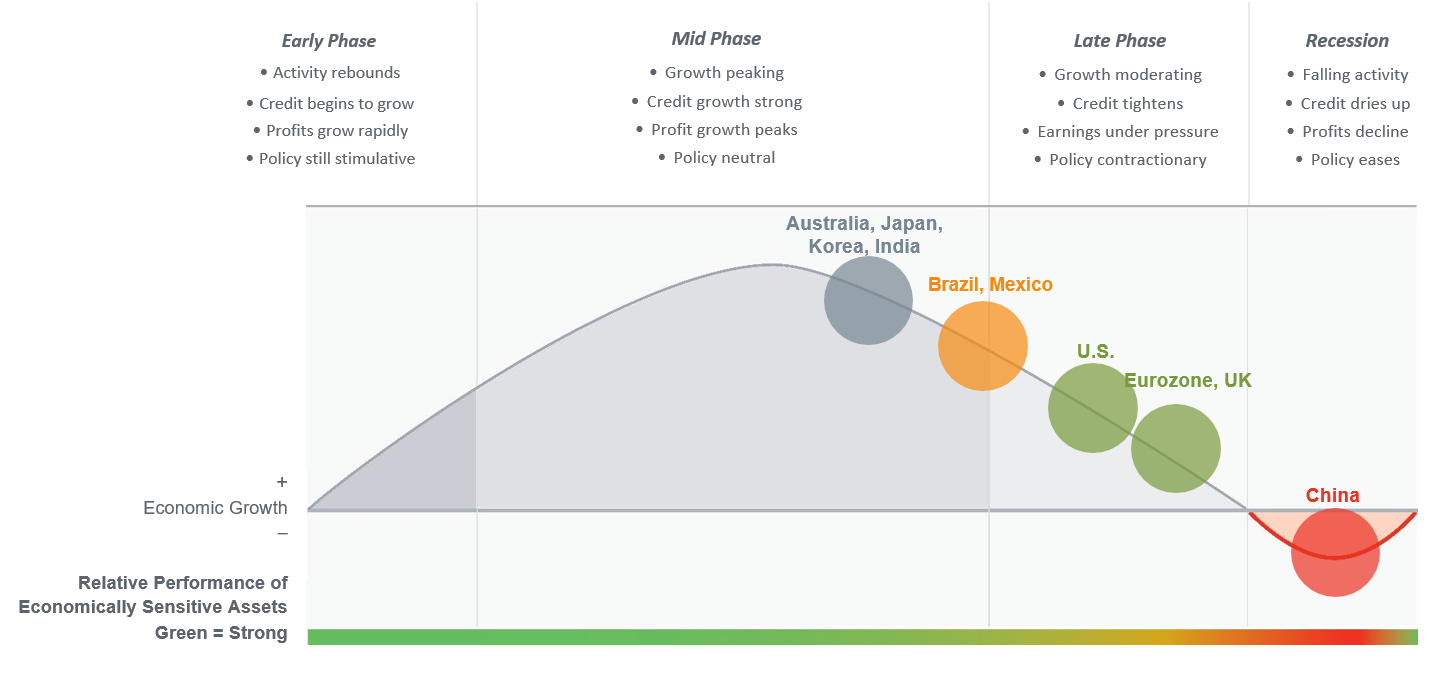
- The U.S. economy is decelerating at an accelerating pace and is in the late phase of the economic cycle.
- A recession, which can be defined as two consecutive quarters of negative economic growth, may be on the horizon.
- Other parts of the global economy may be decelerating at a greater clip than the U.S. (ex: Eurozone, UK) due to the strength of the U.S. dollar and its impact on foreign finances and trade.
- China’s economy is attempting to recover from COVID-19-related shutdowns and may be poised to return to economic expansion before any other major economy.
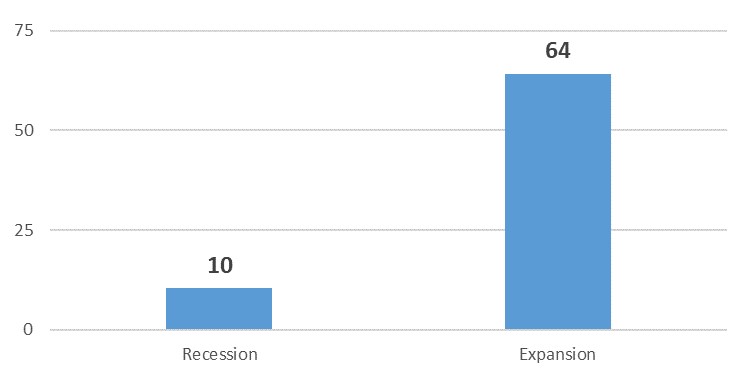
- If the U.S. does fall into a recession in the near term, investors should remember that periods of economic decline are typically short term in nature.
- Historically, recessionary periods are relatively short lived.
- Since 1945, recessions in the U.S. have averaged 10 months in duration.
- In the past 100 years, only one recession has lasted longer than 2 years (Great Depression).
- Since 1945, expansionary periods have averaged 64 months in duration.
- Since 1945, recessions in the U.S. have averaged 10 months in duration.
- Takeaway
- If the U.S. enters a recession in the short term, it is likely that any decline in economic activity would be short term in nature.
Average Length of Recessions and Expansions (Months) Since WWII
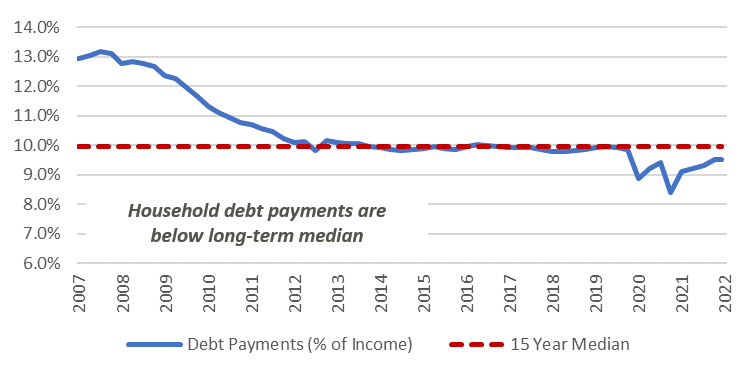
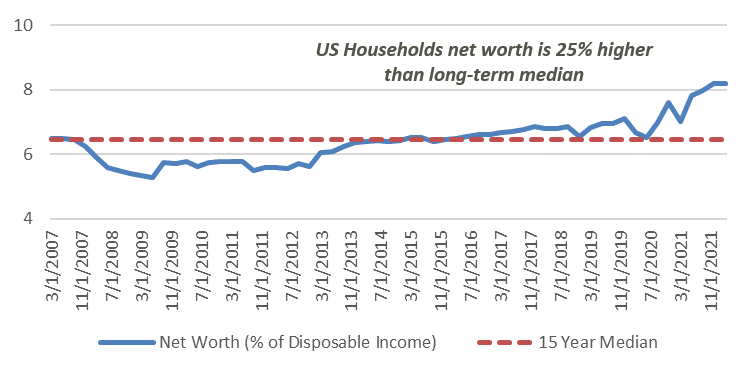
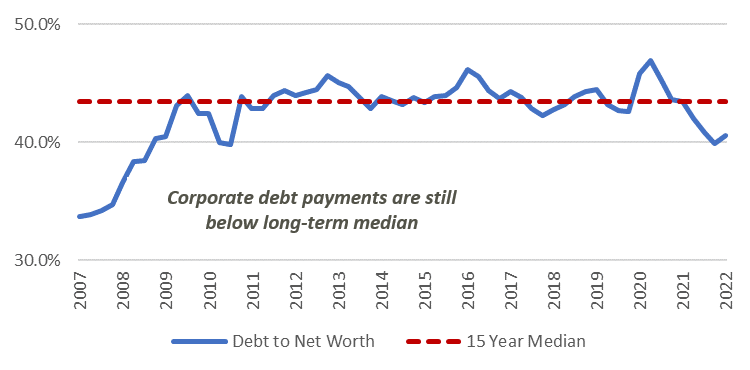
- In addition to being short term in nature, it is likely that any recession in the U.S. will be mild relative to other recessionary periods.
- Consumers and businesses are in relatively strong financial positions and more likely to ride out economic headwinds than during previous economic slowdowns.
- Households have a high level of savings available.
- Household debt service are near multi-decade lows.
- Corporate balance sheets are strong.
- Takeaway
- Businesses and consumers are in a healthy financial position which should help limit the magnitude of any decline in overall economic activity in the U.S.
Household Debt Payments
(As a Percentage of Income)
U.S. Household Net Worth
(As a Percentage of Disposable Income)
U.S. Corporate Debt
(As a Percentage of Net Worth)
2022 Theme: Equity Market Volatility
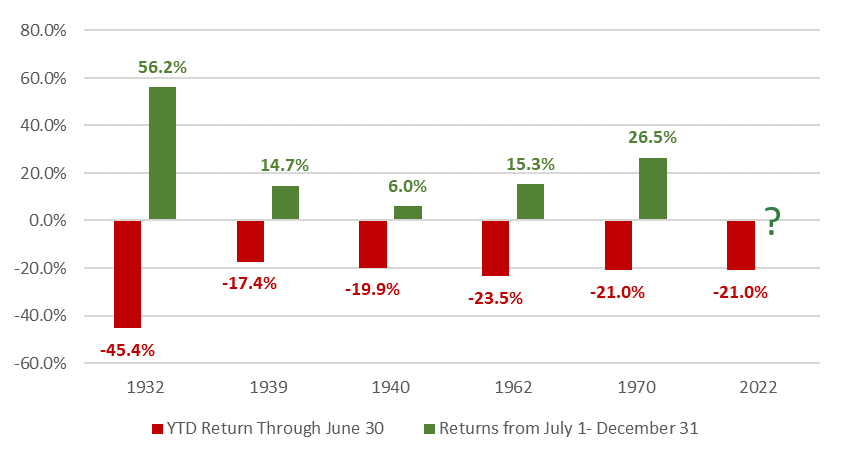
- The S&P 500 declined 21% in the first half of 2022, the largest first half decline in more than 50 years.
- There have been five occasions where the S&P declined by at least 15% in the first half of the year. In all five occasions, the market posted positive returns in the second half of the year.
- Takeaway
- Investors should remember that staying invested during extreme volatility is the best way to participate in equity market recoveries.
S&P 500 Performance in Years When Market is Down At Least 15% At End of June
S&P 500 Performance and Intra-Year Declines
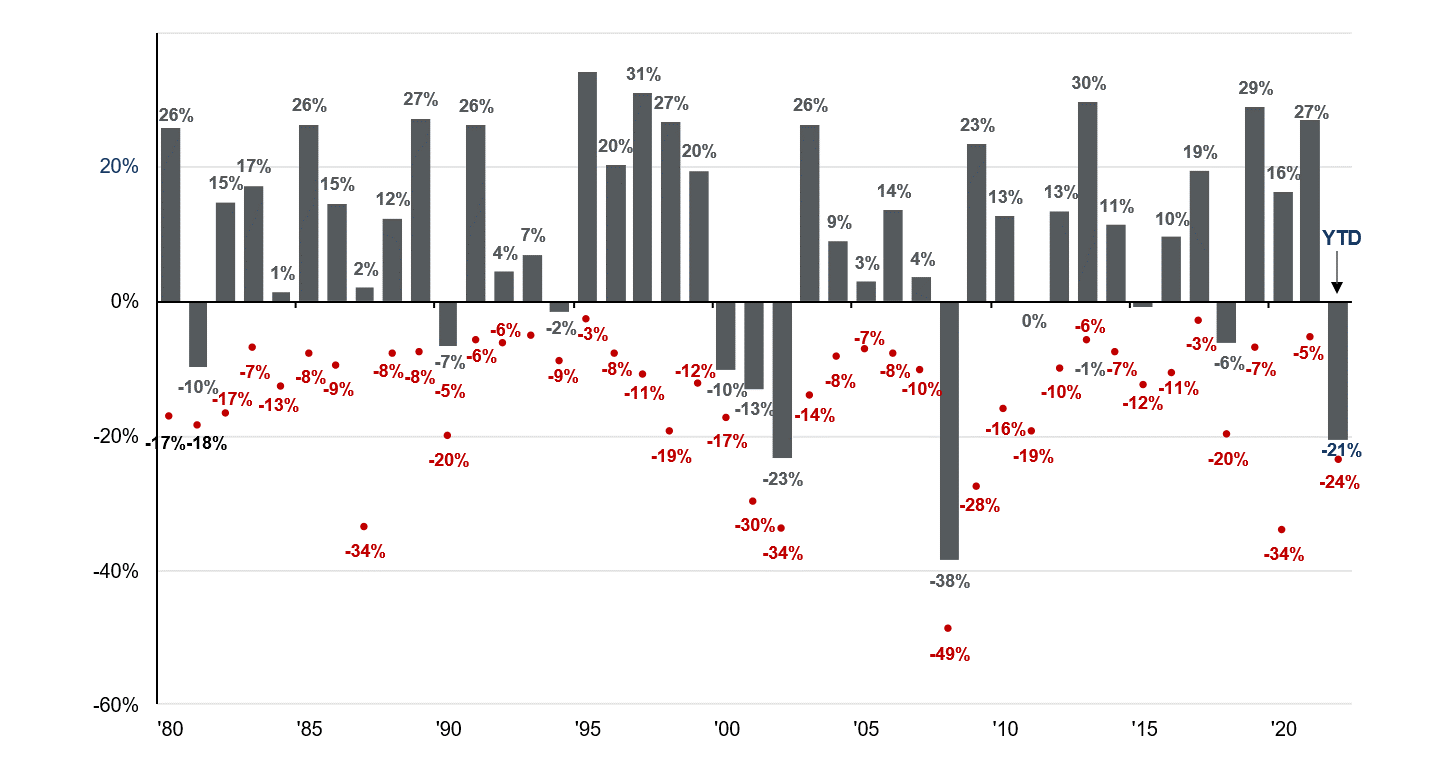
- The chart illustrates annual S&P 500 performance since 1980 (shown in columns above) and the intra-year declines during each year (shown by the red dots).
- Ex: In 2020, the S&P 500 experienced an intra-year decline of -34% before finishing up 16% for the year.
- Over the past 42 years, the S&P 500 has experienced an average intra-year decline of 14%. Despite that, the S&P 500 had positive annual performance in 32 of the last 42 years.
- Takeaway
- As painful as market volatility can be, equity market sell-offs are normal and investors are rewarded for patience.
2022 Theme: Fixed Income Market Volatility
Bloomberg Aggregate Bond Index Performance and Intra-Year Declines
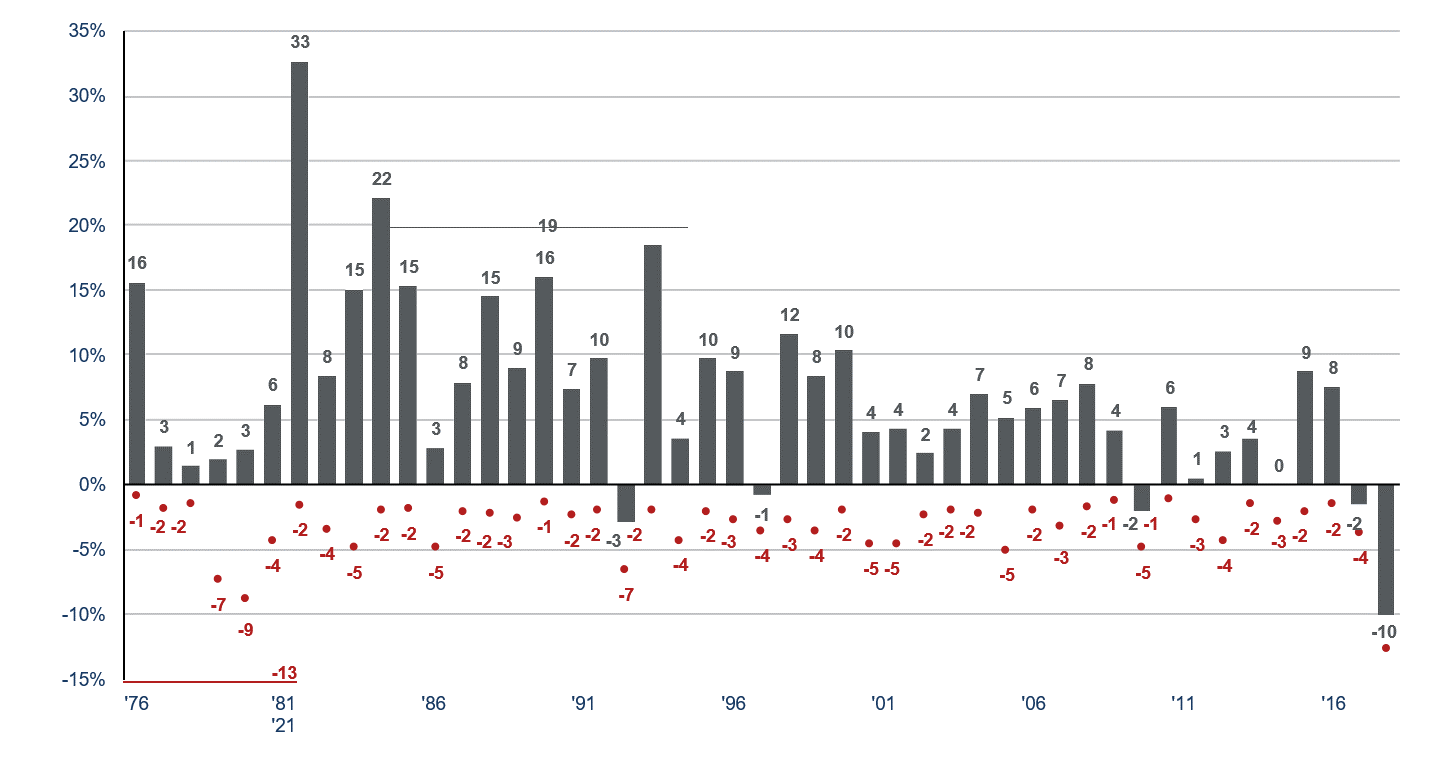
- The chart illustrates annual broad based fixed income market performance since 1976 (shown in columns above) and the intra-year declines during each year (shown by the red dots).
- Ex: In 2016, the Bloomberg Barclays Aggregate Bond Index experienced an intra-year decline of -4%, but the index was up 3% for the year.
- Over the past 42 years, the Bloomberg Barclays Aggregate Bond Index has experienced an average intra-year decline of 3.1%. Despite that, the Bloomberg Barclays Aggregate Bond Index had positive annual performance in 42 of the last 46 years.
- Takeaway
- As painful as market volatility can be, fixed income market sell-offs are normal and investors are rewarded for patience.
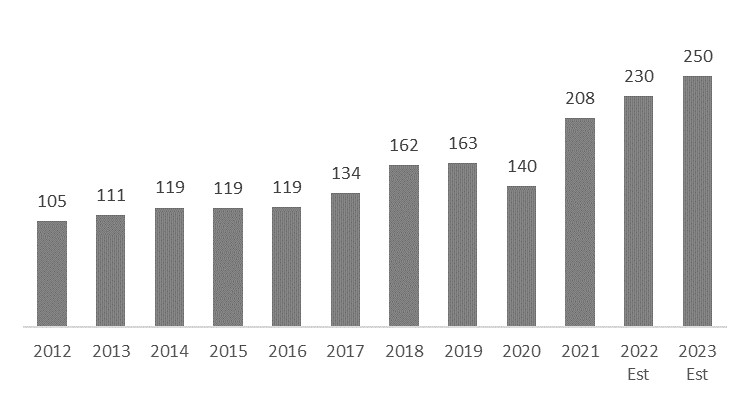
2022 Theme: Decelerating Growth in Corporate Earnings
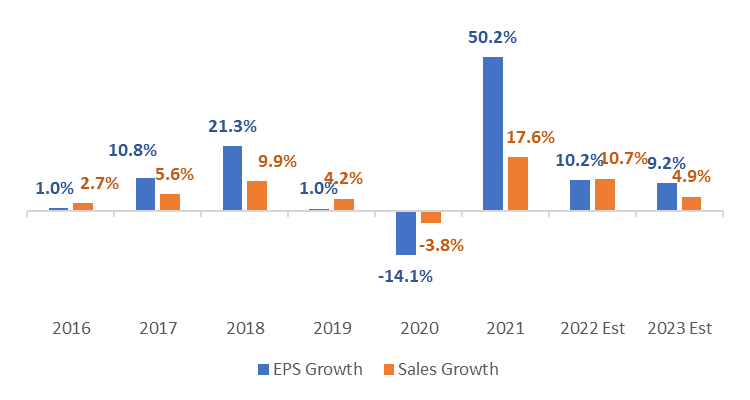
- U.S. corporate earnings growth in the first quarter of 2022 remained strong at +9%. Second quarter 2022 earnings growth is expected to slow to approximately 4%.
- Current forward P/E of the S&P 500 is approximately 17x. This is relative to 21.5x as of the end of 2021. The decline in P/E has been entirely driven by multiple compression.
- Corporate earnings are expected to grow by close to 10% in 2022, about 40% higher than the historical average of 6%.
- We have not seen analysts adjust their EPS estimates despite increasing concerns of downside risk to these estimates. We believe earnings cuts are likely.
- Takeaway
- Slowing growth, tightening financial conditions, lingering supply-chain pressures and FX headwinds could pressure companies’ bottom line in 2022. While not currently reflected in consensus estimates, we could see contraction in S&P 500 EPS in the future.
S&P 500 Bottom-Up EPS Actuals & Estimates
S&P 500 Earnings & Revenue Growth
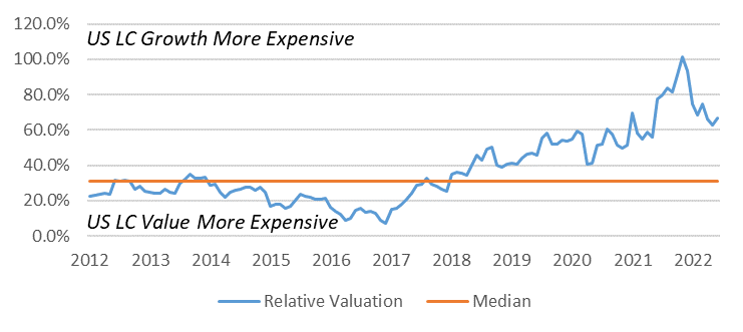
2022 Playbook: U.S. Equity
- Valuation measures of U.S. stocks have declined to more reasonable levels.
- Most fundamental valuations for U.S. Large Cap equities are now in-line with their 10- and 15-year historical averages. This compares to the +30% premium seen at the end of 2021.
- “Growth” stocks in the U.S. are significantly more expensive than “value” stocks, despite their significant underperformance year to date.
- Historically, “value” stocks have tended to outperform “growth” stocks during periods of increasing interest rates. “Growth” stocks have tended to outperform during recessionary periods.
- Takeaways:
- While corporate earnings expectations currently point to growth for 2022, ongoing headwinds put these estimates into question.
- Investors may be best suited to apply a balanced allocation between “growth” and “value” as we navigate the current environment.
Relative Valuation
U.S. Large Cap Growth vs U.S. Large Cap Value
Forward P/E
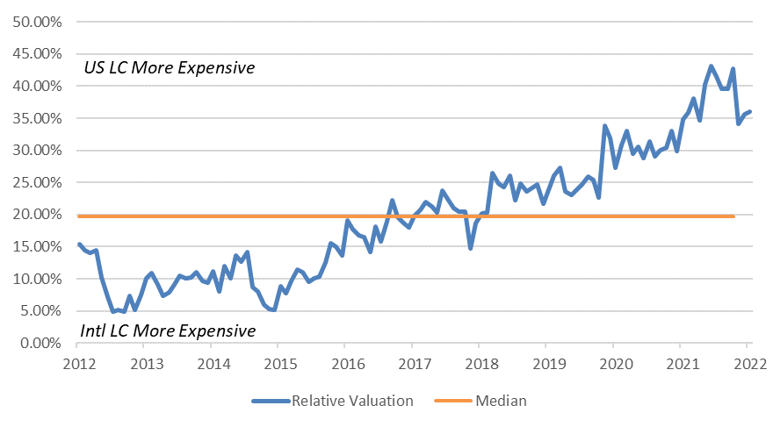
Relative Valuation
U.S. Large Cap vs International Large Cap
Forward P/E
2022 Playbook: International Equity
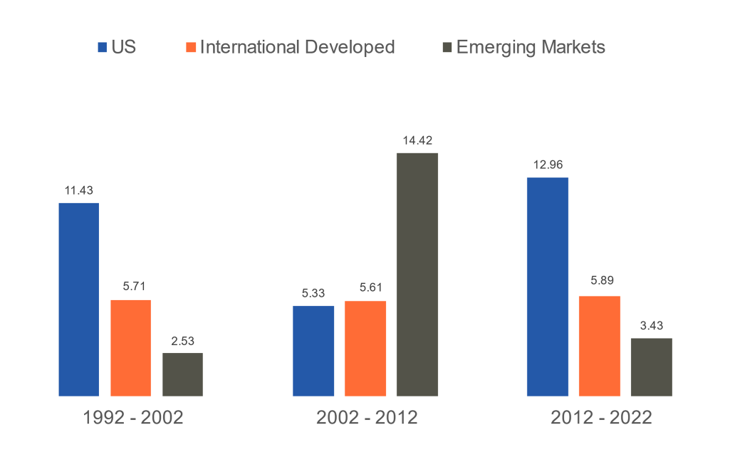
- U.S. investors have benefited from home-country overexposure in the past 10 years.
- Consistent outperformance of U.S. equity markets is not a natural state and will reverse at some point.
- Historical returns over longer time periods show that return differences between U.S. and international markets are cyclical in nature (the current cycle of U.S. outperformance is the longest ever recorded).
- Even though U.S. equities entered a bear market in 2022, International and Emerging Market equities are still cheaper, and have a higher potential for upside as a result.
- Takeaways:
- Investors that shy away from International and Emerging Market equities are likely reducing the upside potential of their investment portfolios.
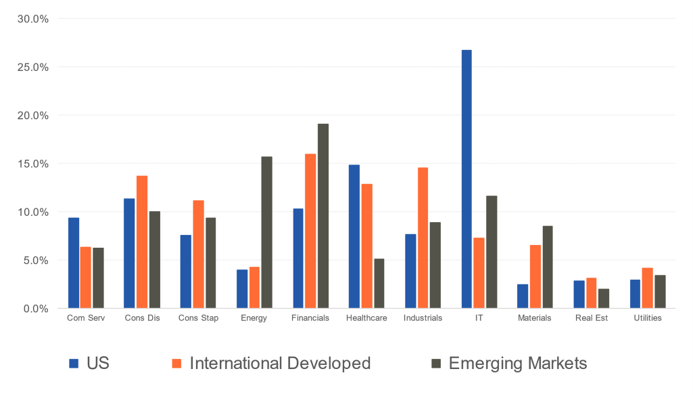
- Benefits of a globally diversified portfolio are not solely geographic. Sector exposure varies across global markets.
World Equity Annualized Market Performance
World Equity Sector Allocation
2022 Playbook: Fixed Income
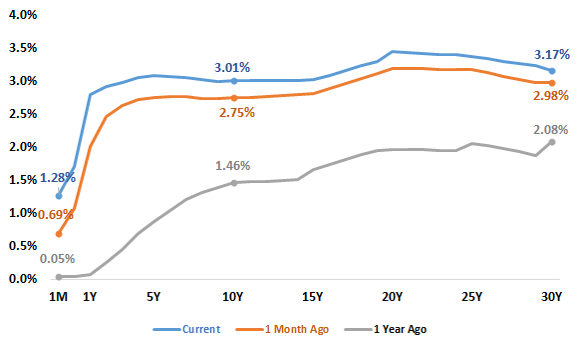
- Short-term fixed income yields have increased dramatically over the past year as market expectations for tighter monetary policy have evolved.
- Short-term yields, which are highly impacted by Federal Reserve policy rates, are set to move higher in the months ahead as the Fed continues raising its policy rate.
- Longer-term yields, although higher over the past year, have declined in recent weeks as markets begin to price in slower economic growth in the U.S. (i.e. “flight to quality”).
- A continuation of this “flight to quality” behavior from investors may ultimately result in a yield curve inversion (i.e. longer-term yields are lower than shorter-term yields).
- Takeaway
- An inverted yield curve may be challenging for the Fed to avoid assuming rate hikes continue as planned.
U.S. Treasury Yields
U.S. Treasury Yield Spreads
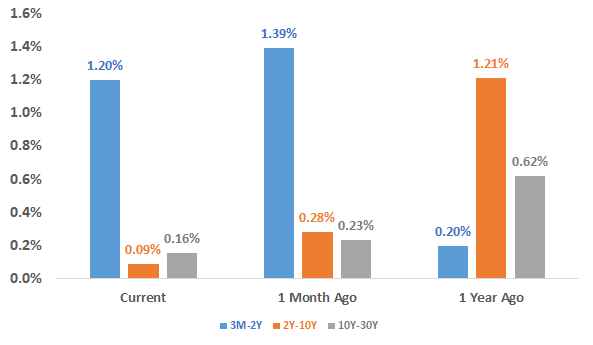
- Long-term interest rates have increased dramatically in 2022, but the risk of even higher interest rates over the short term may be somewhat low.
- Long-term interest rates are determined by market supply and demand (i.e. long-term rates are not dramatically impacted by Federal Reserve interest rate policy).
- Supply and demand for long-term interest rates are primarily driven by the market’s expectations for economic growth and inflation.
- Expectations for slower growth and lower inflation may put a “cap” on long-term rates over the short term.
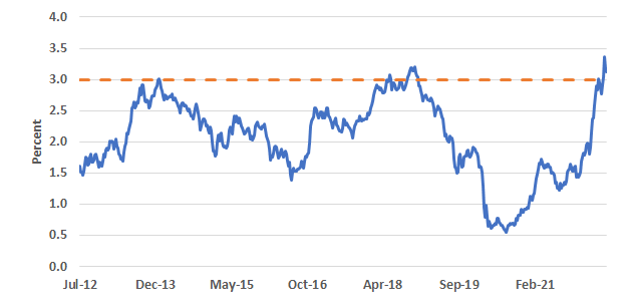
- Additionally, it is important to note that since the financial crisis, the 10-year treasury yield has struggled to break and remain above 3% for any sustainable amount of time.
- Takeaways:
- While rates have surprised to the upside in 2022, it is likely that long-term rates will decline if economic growth and inflation expectations continue to decline.
- Extending portfolio duration may be the most appropriate way for fixed income investors to navigate the uncertain environment.
10-Year Treasury Yield
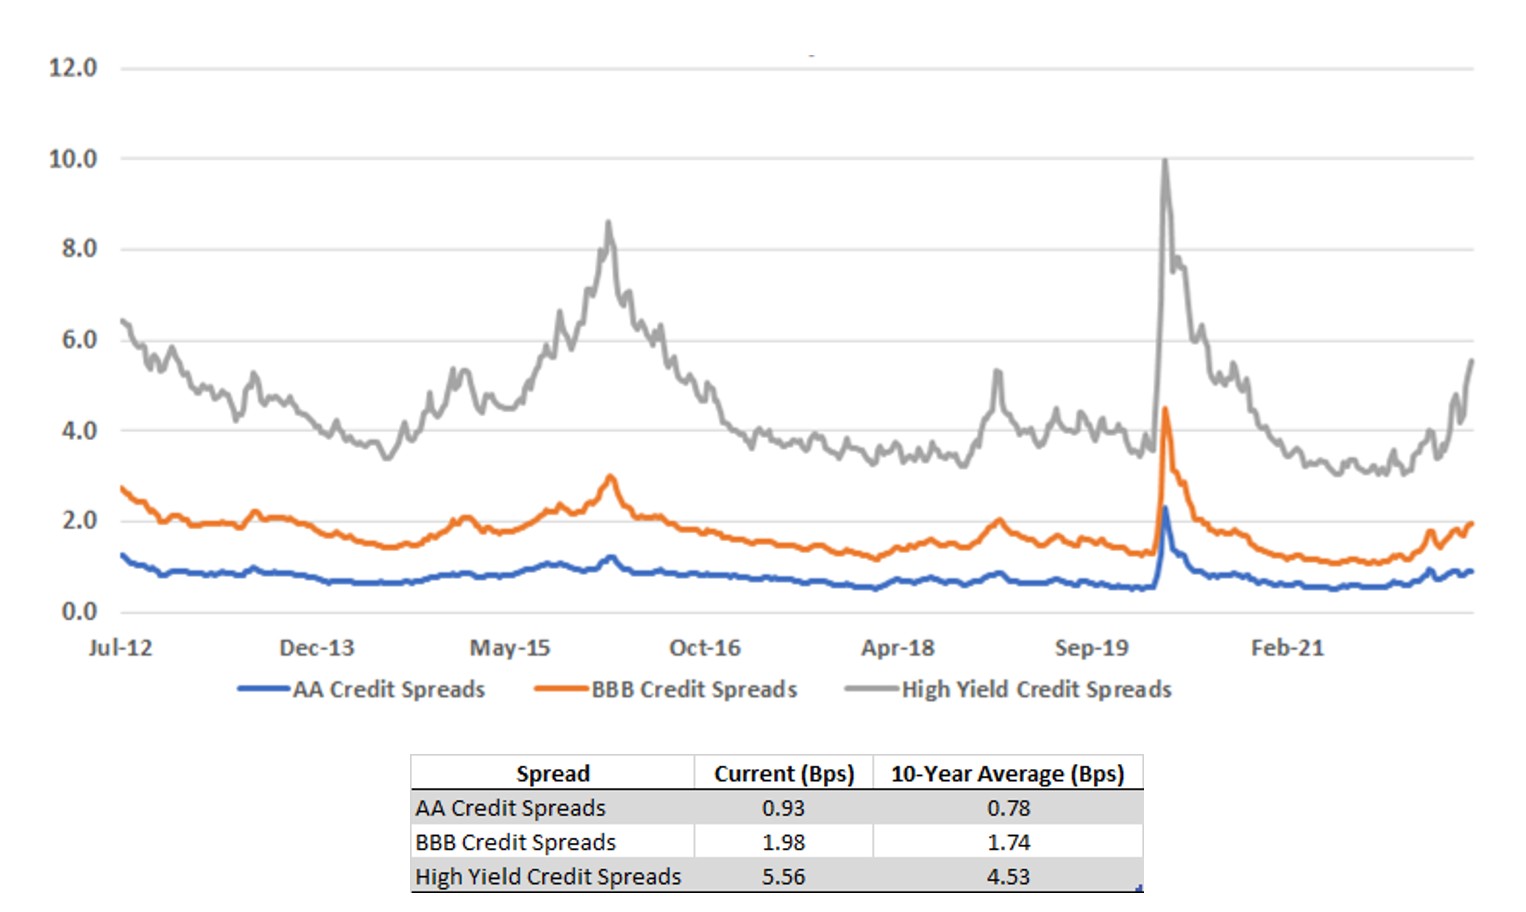
- The difference between corporate bond yields and treasury yields (credit spreads) has increased in 2022 after reaching historical lows in 2021.
- Spreads for lower-quality fixed income (ex: High Yield) steadily widened during the first and second quarters of the year and now are above the past 10-year average.
- This so called “spread widening” is a direct result of increasing investor concerns over default risk.
- Despite the recent widening of credit spreads, further deterioration in economic strength could result in more upward pressure on corporate bond yields (and lower prices).
- Takeaway
- Repositioning the fixed income portfolio to include higher-quality credit is prudent given the current risks to the economic outlook.
U.S. Credit Spreads
2022 Playbook Summary
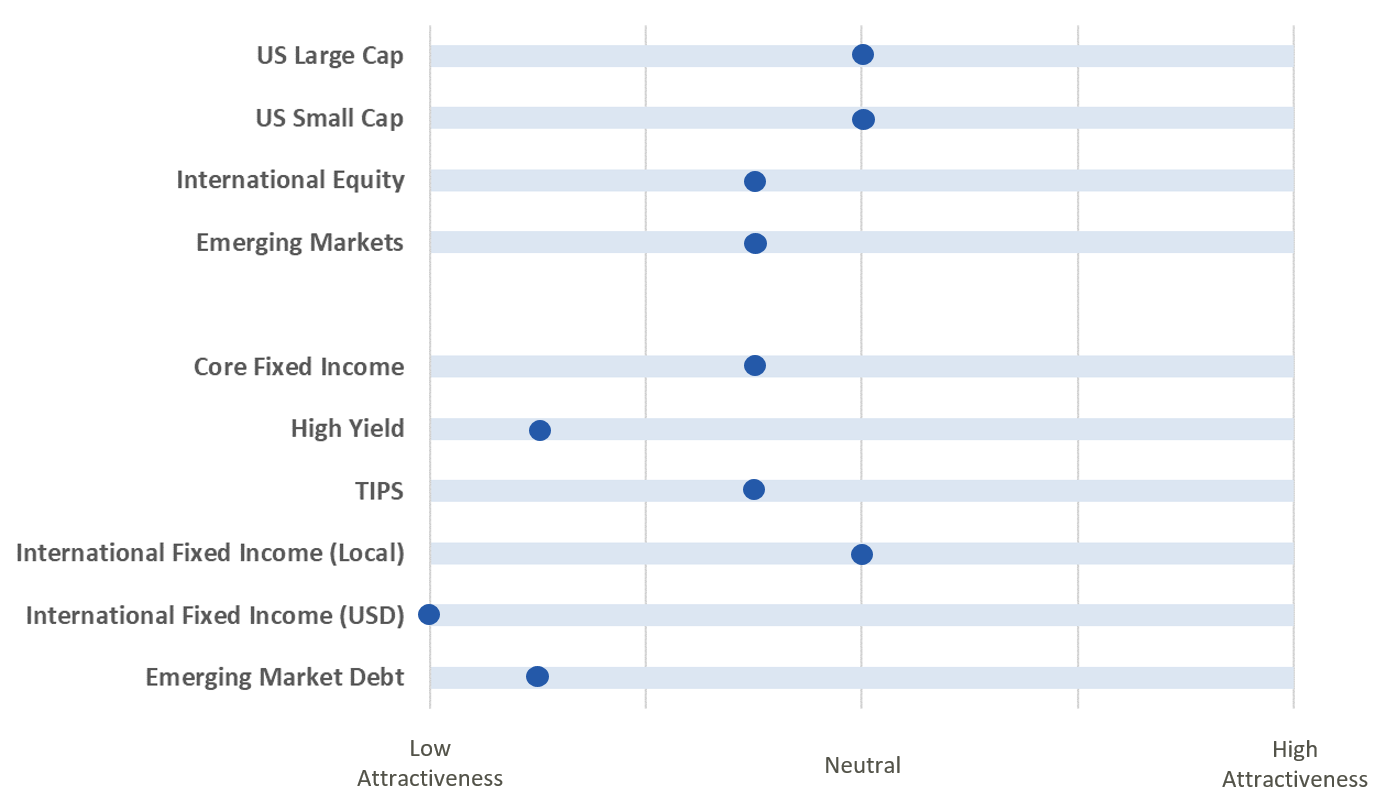
- The above table indicates where each major investment asset class falls on the distribution of attractiveness (from low to high). This table is meant to provide a standardized and comparable view of the level of opportunity in each asset class category.
- In subsequent quarters, we will discuss any movement along the scale for each asset class and the driving forces behind the change in outlook.

