
Capital Markets Playbook | Q3 2023

2023 Q2 Summary
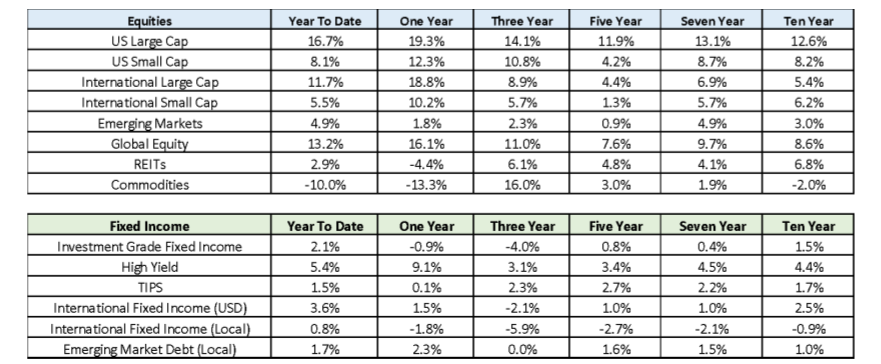
- Despite concerns over slowing global growth, equity markets across the world had a strong first half of 2023.
- Stocks were up about 13% globally, led by U.S. Large Cap (+16.7%) and International Large Cap (+11.7%).
- U.S. Small Cap equities struggled to keep up with most major equity asset classes, but still posted strong returns in June 2023.
- Fixed Income markets also experienced a positive first half of the year as investor demand for income helped keep yields from moving higher.
- Despite concerns of an economic slow down, riskier fixed income assets (High Yield) led all major fixed income categories in the first half of 2023 (+5.4%).
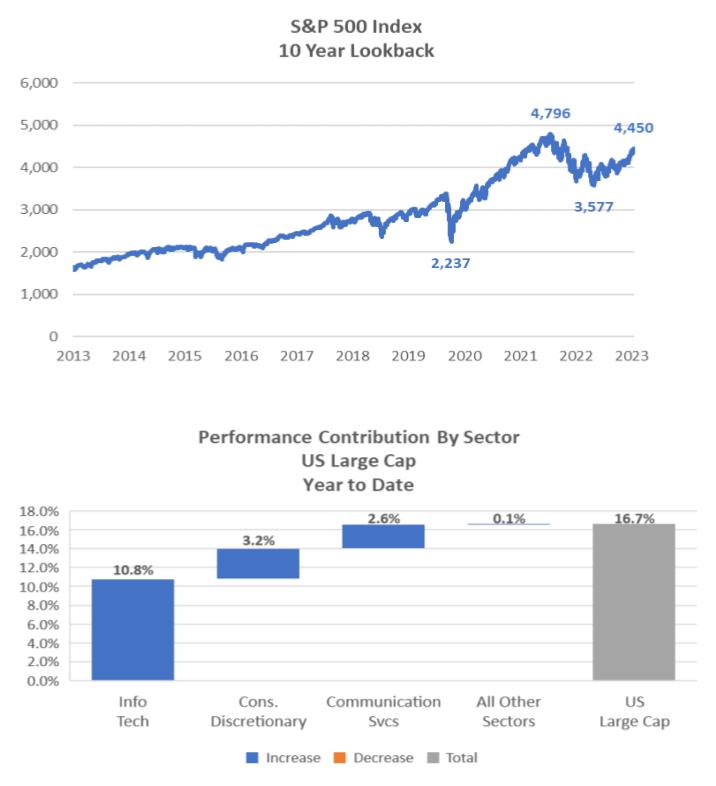
Equity Market Volatility
- Equity markets have been on a wild ride since the beginning of the pandemic, but stocks have just about doubled since the pandemic low in March 2023.
- U.S. Large Cap stocks are up about 100% since the pandemic low (3/23/2020).
- U.S. Large Cap stocks are up about 25% since October 2022.
- U.S. Large Cap stocks are about 10% lower than all-time highs reached in late 2021.
- Despite the strong performance of U.S. Large Cap stocks in the first half of 2023, a disproportionate amount of U.S. Large Cap stock returns have been driven by three sectors this year:
- Information technology, consumer discretionary, and communication services sectors are responsible for essentially all of U.S. Large Cap returns in 2023.
- There are eight sectors within U.S. Large Cap that have either a) posted losses in the first half of 2023, or b) had very small gains in the first half of 2023.
- Takeaways
- Investors would be wise to take gains in information technology and consumer discretionary stocks in particular as these stocks are likely “overbought” and/or “expensive” in the current environment.
- Other sectors of the equity market may need to post positive performance in order for U.S. Large Cap indices to finish strong in the second half of the year.
Economic Expectations
- Economic growth in the U.S. has been stronger than originally expected in the first half of 2023, but an economic slowdown remains the most likely outcome over the next 12-24 months.
- The potential for above-trend economic growth remains unlikely over the next several quarters.
- The potential for a recession in 2023 looks remote due to a strong labor market, strong consumer spending and slowing inflation, but an economic contraction cannot be ruled out for 2024.
- Recent data points that suggest the economy is likely to slow in the quarters ahead:
- Consumer and business confidence is declining.
- Consumer spending, which drives economic growth in the U.S., is slowing.
- The labor market, while still hot, is beginning to cool.
- The Treasury yield curve has remained deeply inverted over the past few quarters.
- Banks are tightening lending standards in the wake of lower projected earnings.
- Forward corporate earnings estimates are declining.
- Markets will be watching a number of important data points in the weeks ahead as investors look for certainty on what the future holds for the U.S. economy. The most important questions that investors are focused on are shown below:
- Inflation: How much will inflation decline as economic growth slows?
- Unemployment: How much will unemployment increase as capital market participants prepare for the potential of slower consumption, slower lending and slower economic growth? Will wage growth continue to slow as a result of higher unemployment?
- Monetary policy: How much would the Fed’s path for monetary policy change in the wake of slower economic growth, higher unemployment and lower inflation?
- Economic growth: Will the U.S. slip into a period of economic contraction in 2024? If so, just how deep would a recession be?
- Given the uncertainty in the underlying economy, there are a wide range of possible outcomes for economic growth in the U.S. over the next two years.
- While it is impossible to detail each of the possible outcomes, there are three broad-based themes that investors are focused on.
- Soft landing: Economic growth is stronger than expected; the U.S. avoids a recession.
- Consumption and lending are stronger than currently expected.
- Unemployment remains below 4.5%.
- Inflation is sticky and remains well above the Fed’s 2% target.
- Monetary policy remains tighter for longer than expected and the Fed raises rates more than expected.
- Important note: A soft landing would be good for the U.S. in the short term, but it would also create a higher probability of a deeper recession in the future.
- Moderate landing: Economic growth slows moderately; the U.S. may enter a mild recession.
- Consumption and lending activity slow moderately.
- Unemployment increases moderately and is close to the “natural rate of unemployment.”
- Inflation continues to fall moderately but remains above the Fed’s 2% target.
- Monetary policy remains restrictive, but the Fed pauses rate hikes in late 2023 or early 2024.
- Important note: A moderate landing may be the most probable outcome based on today’s facts and circumstances.
- Hard landing: Economic growth declines materially; the U.S. enters a deeper recession than most currently expect.
- Consumption and lending activity decline materially.
- Unemployment increases materially.
- Inflation slows materially and may reach the Fed’s 2% target.
- Monetary policy becomes dovish (the Fed may cut rates in early 2024).
- Important note: A hard landing would create painful outcomes in the short term, but is not expected to be as painful as other severe recessions the U.S. has experienced in the recent past (ex: financial crisis).
- Soft landing: Economic growth is stronger than expected; the U.S. avoids a recession.
Economic Resilience in the U.S.
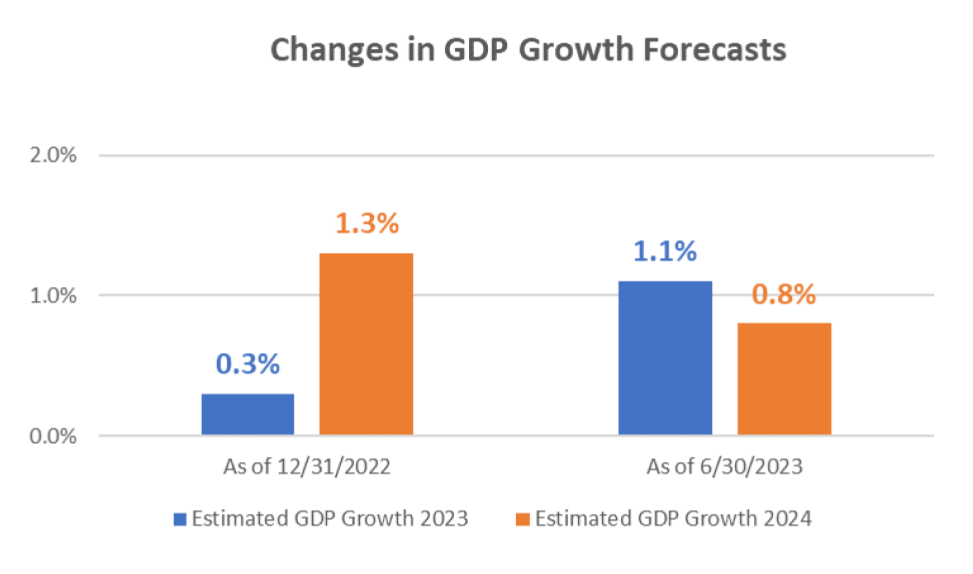
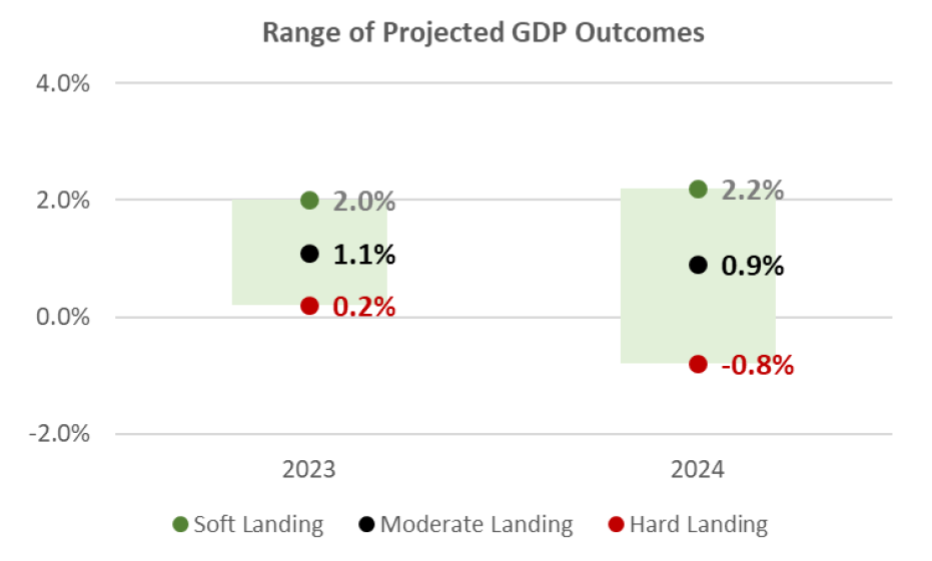
- Heading into 2023, market consensus was that GDP growth for the year would be 0.3% and that an economic recession was possible before year-end.
- Despite expectations for slower growth in 2023, the U.S. economy has been surprisingly resilient in the first six months of the year.
- First quarter GDP growth was higher than expected (2.0%).
- Second quarter GDP growth looks like it may surprise to the upside as well.
- Although the economy has outperformed thus far in 2023, analysts are still expecting below trend GDP growth for 2023 and 2024.
- GDP growth estimates for 2023 have risen, while GDP growth estimates for 2024 have declined in recent weeks.
- Takeaways
- Economic growth in the U.S. will likely remain below its long-term average over the next 2 years.
- It appears that the U.S. will avoid a recession in 2023 given the current strength of the U.S. economy.
- Even if the U.S. avoids an economic recession in 2023, the probability of a recession in 2024 is still higher than normal.
Surveys and Financial Indicators Imply Slower Growth
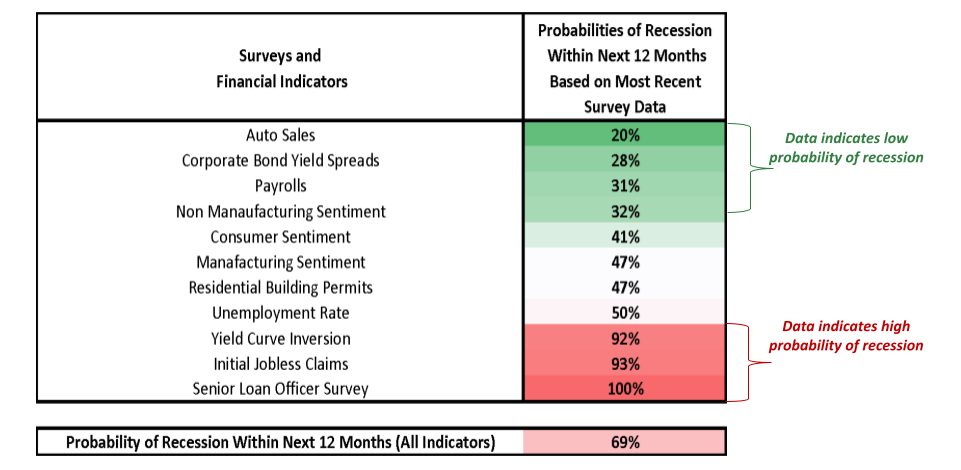
- The table above lists recession probabilities based on the current values for selected surveys and financial indicators.
- Example: When consumer sentiment has been at its current level, the U.S. has entered into a recession within the next twelve months about 40% of the time.
- Based on current values of the surveys and financial indicators listed above, historical data suggests that there is about a 70% chance of recession in the U.S. within the next twelve months.
- Takeaways
- Certain indicators suggest that the U.S. will avoid recession over the next twelve months (auto sales, payrolls, etc.), while other indicators suggest that the U.S. will enter into a recession within the next twelve months (yield curve inversion, initial jobless claims, etc.).
- While past performance is not an indicator of future results, it is important to note that certain financial indicators (ex: yield curve inversion) are less volatile and have better predictive value than others (ex: auto sales).
2023 Theme: Decelerating Economic Growth
- While the prospects for economic growth are largely uncertain today, the following can be said with confidence:
- Despite stronger than expected economic growth in the first half of 2023, the U.S. is likely to experience below trend GDP growth over the next two years.
- Market participants believe that an economic recession, should it occur in the short term, is more likely to occur in 2024 (not 2023).
- If U.S. economic growth is much stronger than anyone anticipates over the next two years, it could exacerbate inflationary pressure and create more financial pain in future years.
- Scenarios
- Soft landing
- Economic activity in the U.S. is higher than its long-term trend rate over the next two years.
- Moderate landing
- Economic activity in the U.S. is below its long-term trend rate and the U.S. may enter into a short-term, shallow recession.
- Hard landing
- Economic activity declines materially and the U.S. enters into a recession
- GDP is well below the long-term GDP trend rate over the next two years.
- Soft landing
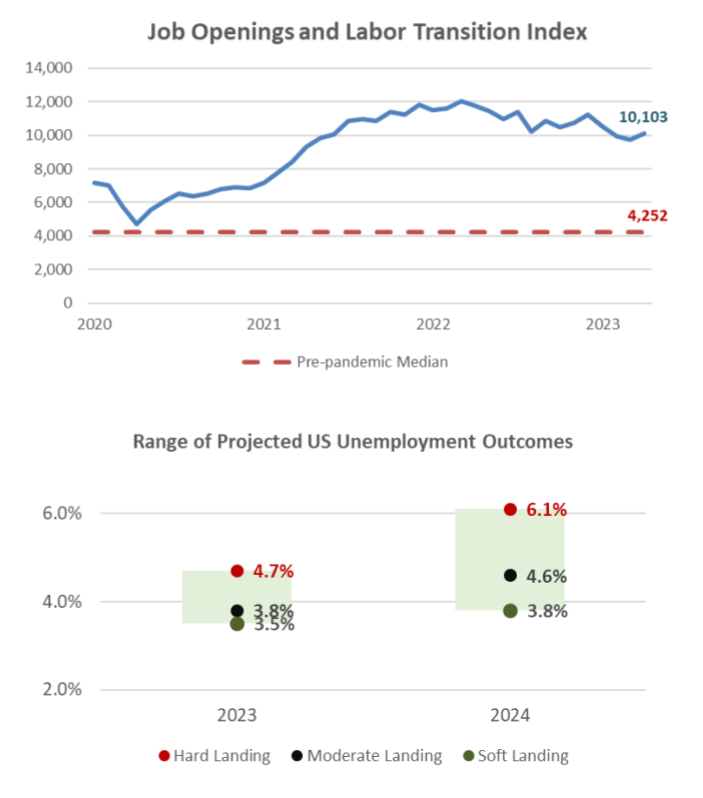
2023 Theme: Higher Unemployment, Slower Wage Growth
- The labor market has begun to cool in recent months, but unemployment remains near historical lows (3.7%).
- The number of open positions in the U.S. has declined by 10% since the beginning of 2022 but remains well above the long-term average.
- Scenarios
- Soft landing
- Unemployment is largely unchanged from its current level and remains near historical lows over the next two years.
- Moderate landing
- As economic growth slows in the U.S., unemployment ticks higher but remains below 5% over the next two years.
- Hard landing
- Unemployment exceeds 6% by the end of 2024 as a result of meaningfully slower economic growth.
- Soft landing
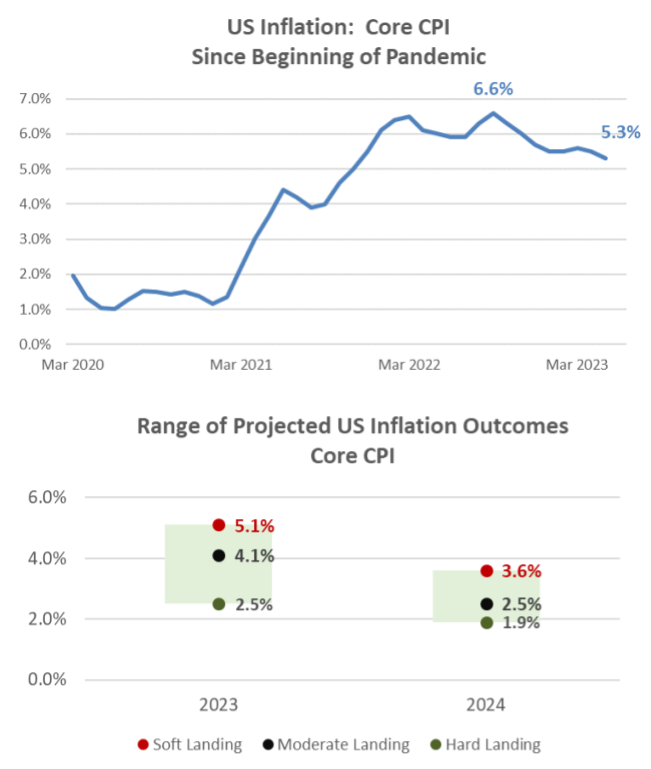
2023 Theme: Slowing Inflation
- Inflation has moved lower in recent months and appears to be heading lower in the months ahead.
- Core CPI has declined about 1.3% since peaking in September of 2022.
- That said, inflation has been somewhat “sticky” in 2023 and remains well above the Fed’s 2% long-term objective.
- Scenarios
- Soft landing
- Inflation continues to be sticky throughout the aggregate economy and remains 1-2% higher than the Fed’s long-term inflation target through the end of 2024.
- Moderate landing
- Inflation continues to moderate slowly and is still slightly above the Fed’s 2% target by the end of 2024.
- Hard landing
- Inflation falls abruptly as a result of slower economic growth and reaches the Fed’s long-term inflation target before the end of 2024.
- Soft landing
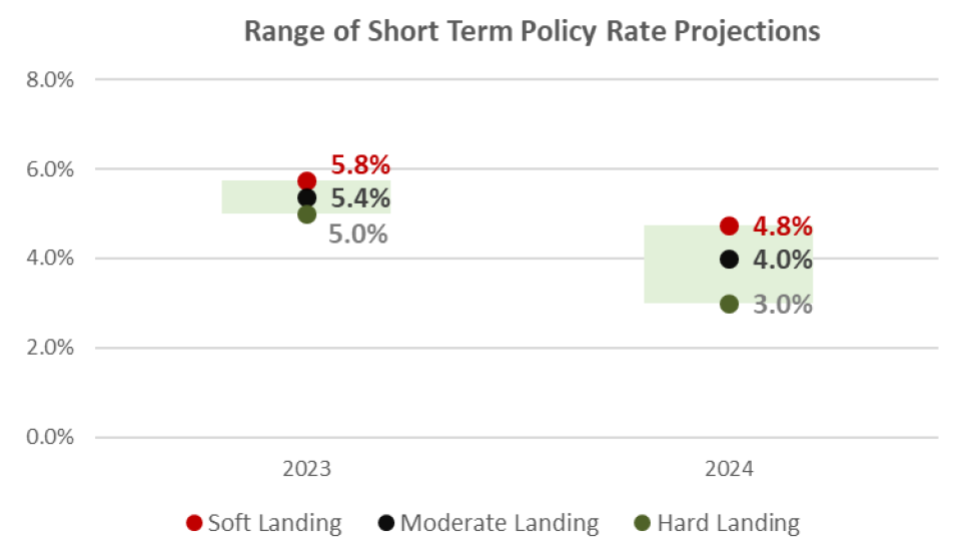
2023 Theme: Tighter Monetary Policy
- The Federal Reserve continues to maintain its hawkish stance on monetary policy and has signaled its overnight policy rate could eclipse 5% in 2023. Its dot plot projections are as follows:
- Scenarios
- Soft landing
- High inflation and low unemployment allow the Fed to keep hiking interest rates through the end of 2023.
- The Fed’s short-term policy rate remains above 4% through the end of 2024.
- Moderate landing
- Moderating inflation and slightly higher unemployment allow the Fed to begin cutting rates in 2024.
- The Fed’s short-term policy rate remains above 3% through the end of 2024.
- Hard landing
- Inflation drops quickly and unemployment increases to the point where the Fed begins cutting rates in early 2024.
- The Fed’s short-term policy rate is still above 2% by the end of 2024.
- Soft landing
- Scenarios
2023 Theme: Decelerating Economic Growth
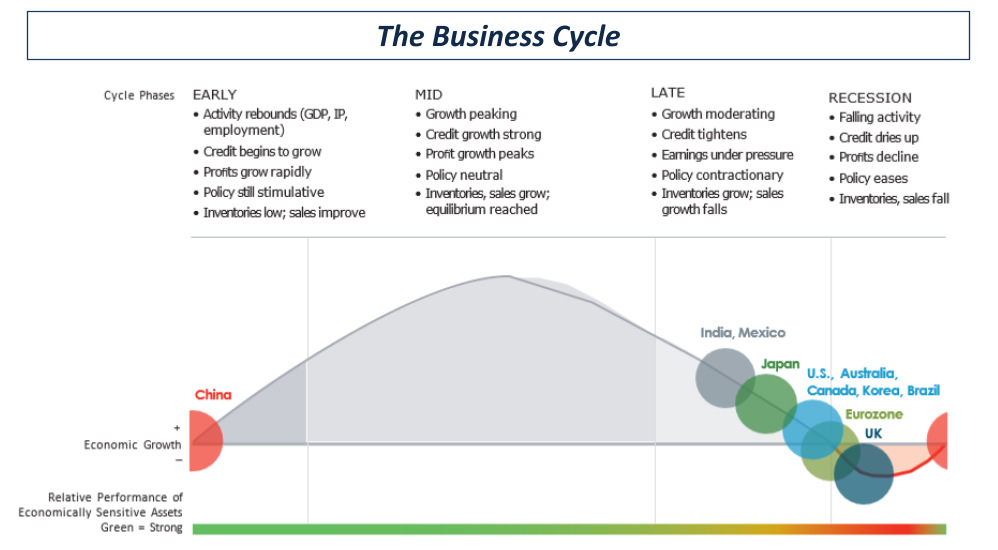
- The U.S. economy is decelerating and is in the late phase of the economic cycle.
- A recession, which can be defined as two consecutive quarters of negative economic growth, may occur before the end of 2024.
- Other parts of the global economy may be decelerating at a greater clip than the U.S. (ex: Eurozone, UK) due to the strength of the U.S. dollar and its impact on foreign finances and trade.
- Eurozone economies and the UK have been badly hit by higher energy prices and energy shortages due to the Ukraine war.
- China’s economy is attempting to recover from COVID-19 related shutdowns and may be poised to return to economic expansion before any other major economy. With the easing of its zero-covid policy, growth in China should pick up in 2023.
2023 Theme Decelerating Economic Growth
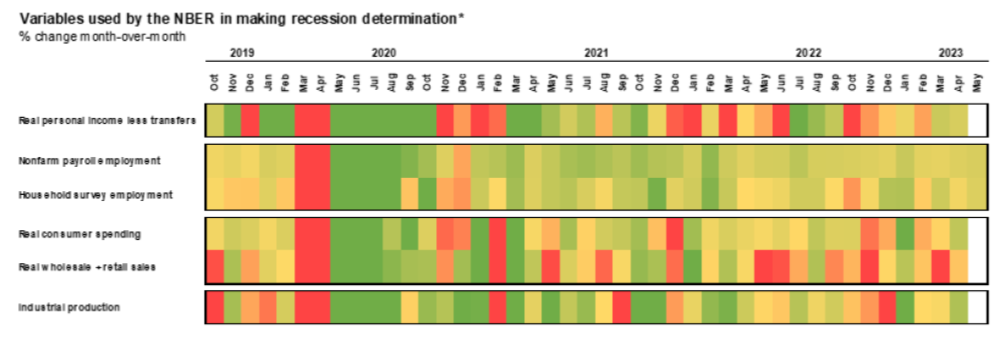
- The table highlights six different economic variables that are most important to economists.
- Green shaded areas represent “strong” economic data and red shaded areas represent “weak” economic data.
- Personal income, consumer spending and industrial production data has been weakening since 2021 and is expected to continue to weaken over the short term.
- Unemployment, should it remain historically low in the months ahead, could help the U.S. avoid a recession for the time being.
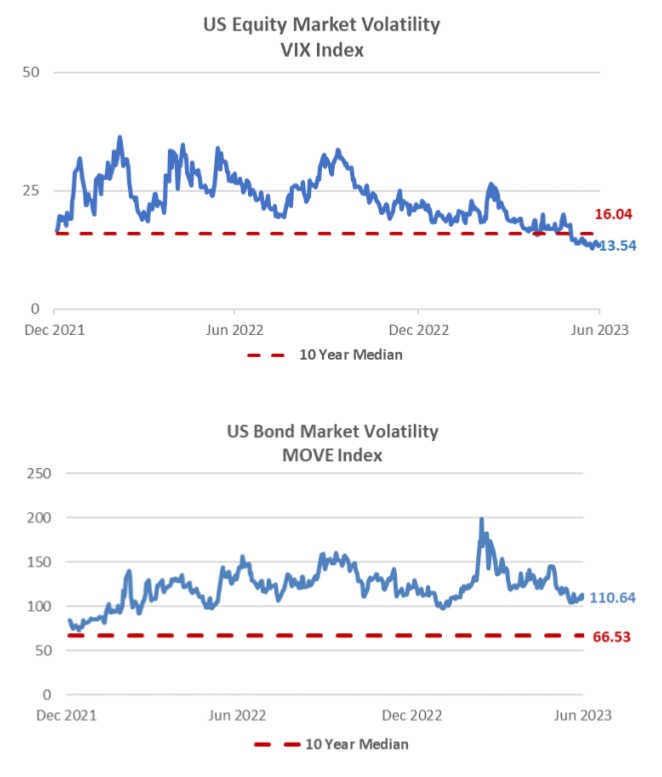
2023 Theme: Market Volatility
- Uncertainty associated with inflation, monetary policy and economic growth have led to higher than “normal” levels of volatility in fixed income and equity markets.
- Although volatility in fixed income and equity markets declined in the weeks following SVB’s failure, it is likely that market volatility remains above normal in the weeks and months ahead.
- Factors that will help dampen volatility:
- Greater certainty over monetary policy and, more specifically, a better understanding of when the Fed will pause interest rate hikes.
- Greater certainty that recent declines in inflation will continue.
- Greater certainty that liquidity issues experienced by SVB will not be pervasive across the financial system.
- Takeaways
- Market volatility is, by definition, a function of uncertainty.
- Volatility will decline as market participants have more clarity into the future of inflation, monetary policy, economic growth, etc.
2023 Playbook: Equities
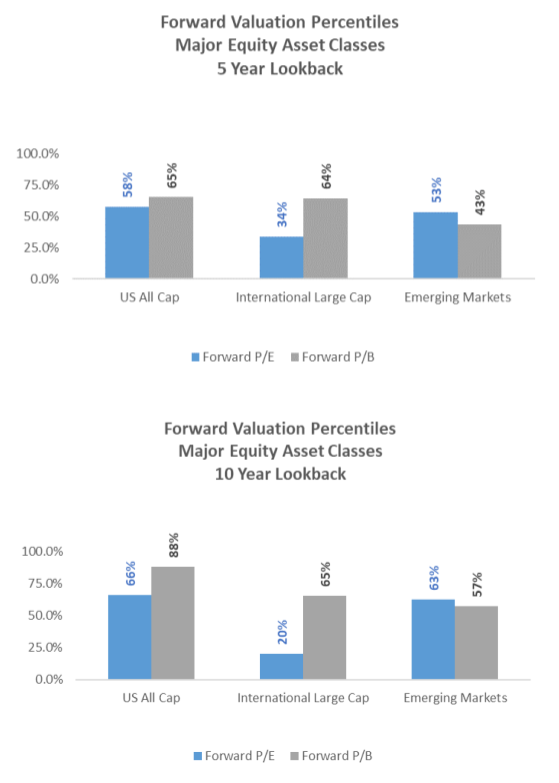
- Fundamental valuation metrics for U.S. Equity, International Equity and Emerging Market Equity suggest that most major equity asset classes are either “fairly priced” or “cheap” on a historical fundamental valuation basis.
- Both U.S. and international earnings per share (EPS) ratios have decreased by the same amount in recent months. But the price-to-earnings ratio of U.S. stocks have increased more strongly than international stocks.
- Scenarios
- Soft landing
- Global equity prices increase, valuations likely become more expensive in the short term.
- As valuations increase, downside risk for equities increases as well.
- Moderate landing
- Global equity prices trade in a tight range and valuations remain near current levels.
- Stocks are neither cheap nor expensive over the short term.
- Hard landing
- Global equity prices decline materially and valuations become meaningfully cheaper
- As prices move lower and valuations become cheaper, upside risk for equities increases over the short term.
- Soft landing
2023 Playbook: U.S. Equity
- Given the uncertainty in markets today, assets that are cheap relative to others could get even cheaper (and assets that are expensive relative to others could get more expensive) over the short term.
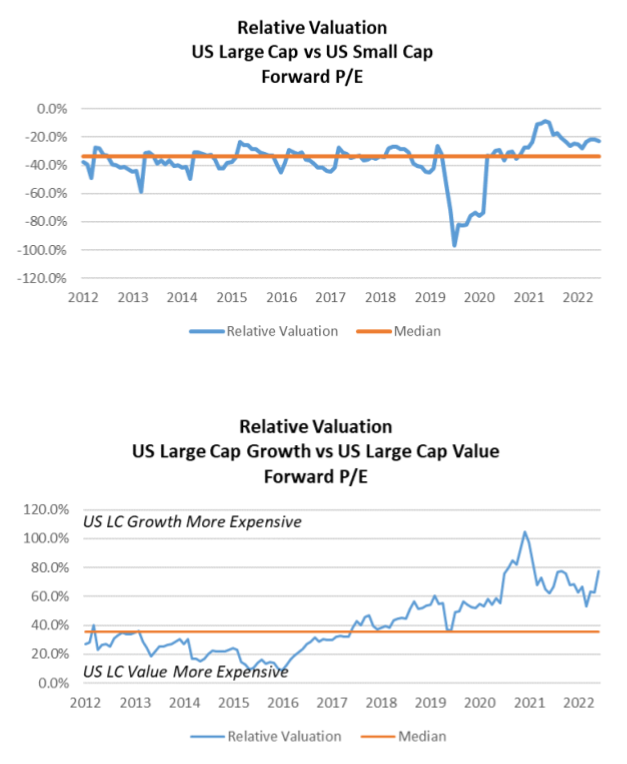
- U.S. Large Cap equities are slightly more expensive than U.S. Small Cap equities based on relative fundamental valuation metrics.
- U.S. Large Cap growth equities are meaningfully more expensive than U.S. Large Cap value equities based on relative fundamental valuation metrics.
- Scenarios
- Soft landing
- U.S. Small Cap outperforms U.S. Large Cap, U.S. Large Cap value outperforms U.S. Large Cap growth.
- U.S. Large Cap becomes less expensive relative to U.S. Small Cap; U.S. Large Cap growth becomes less expensive relative to U.S. Large Cap value.
- Moderate landing
- Price appreciation and fundamental valuation differences do not change meaningfully.
- Hard landing
- U.S. Large Cap outperforms U.S. Small Cap, U.S. Large Cap growth outperforms U.S. Large Cap value.
- U.S. Large Cap becomes more expensive relative to U.S. Small Cap; U.S. Large Cap growth becomes more expensive relative to U.S. Large Cap value.
- Soft landing
2023 Playbook: International Equity
- Given the uncertainty in markets today, assets that are cheap relative to others could get even cheaper (and assets that are expensive relative to others could get more expensive) over the short term.
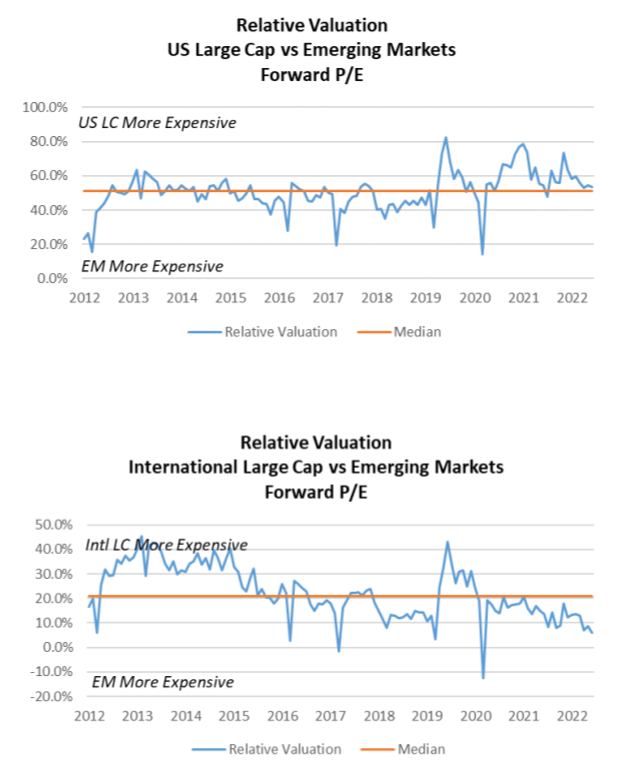
- U.S. Large Cap equities are slightly more expensive than emerging market equities and International Large Cap.
- Emerging market equities are slightly more expensive than international equities.
- Scenarios
- Soft landing
- Emerging markets outperforms U.S. Large Cap, International Large Cap outperforms U.S. Large Cap.
- U.S. Large Cap becomes less expensive compared to emerging markets and International Large Cap.
- Moderate landing
- Price appreciation and fundamental valuation differences do not change meaningfully.
- Hard landing
- U.S. Large Cap outperforms emerging markets and International Large Cap.
- U.S. Large Cap becomes more expensive relative to emerging markets and International Large Cap
- Soft landing
2023 Playbook: Fixed Income
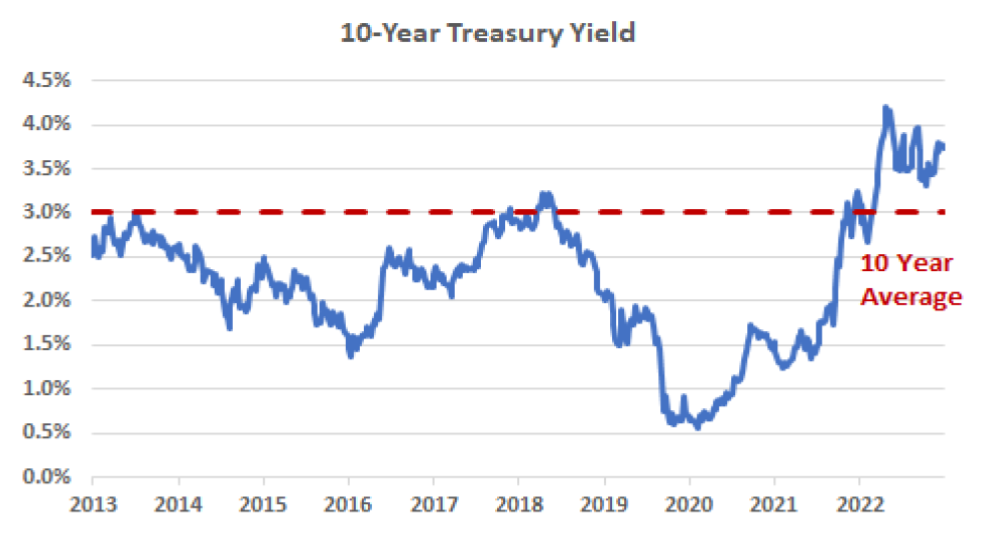
- Long-term Treasury yields have increased dramatically over the past two years.
- The 10-year Treasury yield, for example, was about 3.80% (or 70% on a relative basis) higher than its long-term average yield at the end of March 2023.
- Long-term interest rates are determined by market supply and demand (i.e., long-term rates are not dramatically impacted by Federal Reserve interest rate policy).
- Supply and demand for long-term interest rates is primarily driven by the market’s expectations for economic growth and inflation.
- Scenarios
- Soft landing
- Long-term Treasury yields move meaningfully higher as markets price in expectations for higher inflation and better-than-expected economic growth.
- Moderate landing
- Long-term Treasury yields fall slightly as markets price in slightly lower inflation and economic growth.
- Hard landing
- Long-term Treasury yields fall meaningfully as inflation and economic growth expectations decline materially.
- Soft landing
2023 Playbook: Fixed Income
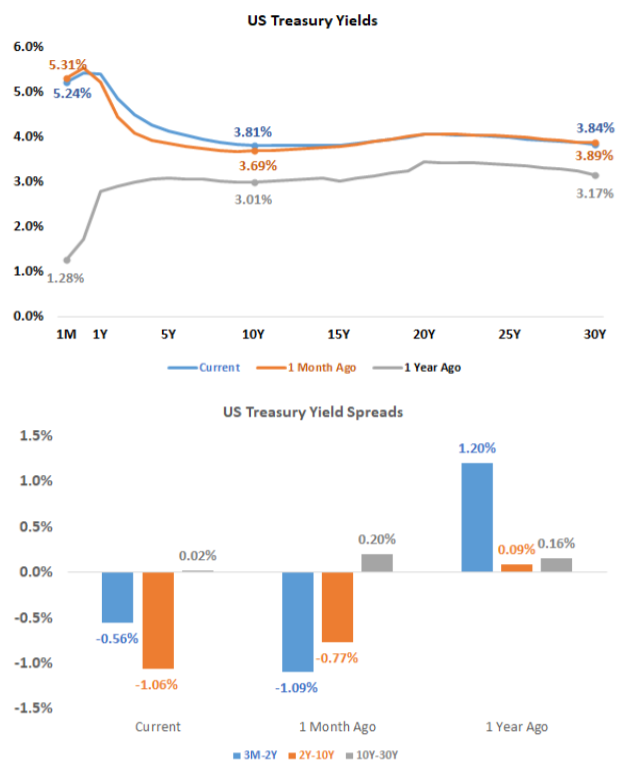
- Key sections of the Treasury yield curve have been inverted since the mid-summer of 2022.
- Yield curve inversion occurs when short-term rates are higher than long-term rates.
- Yield curve inversion has historically led to disruptions in borrowing and lending activity that may result in meaningful declines in economic activity.
- The longer a yield curve inversion persists (and the larger the size of the inversion), the more likely lending and borrowing activity will decline meaningfully.
- Scenarios
- Soft landing
- Yield curve inversion persists into 2025.
- Short duration, high-quality fixed income outperforms long duration, high-quality fixed income.
- Moderate landing
- Yield curve inversion continues into mid/late 2024.
- Long duration, high-quality fixed income outperforms short duration, high-quality fixed income at the margin.
- Hard landing
- Yield curve inversion is no longer present by mid-2024.
- Long duration, high-quality fixed income materially outperforms short duration, high-quality fixed income.
- Soft landing
2023 Playbook: Fixed Income
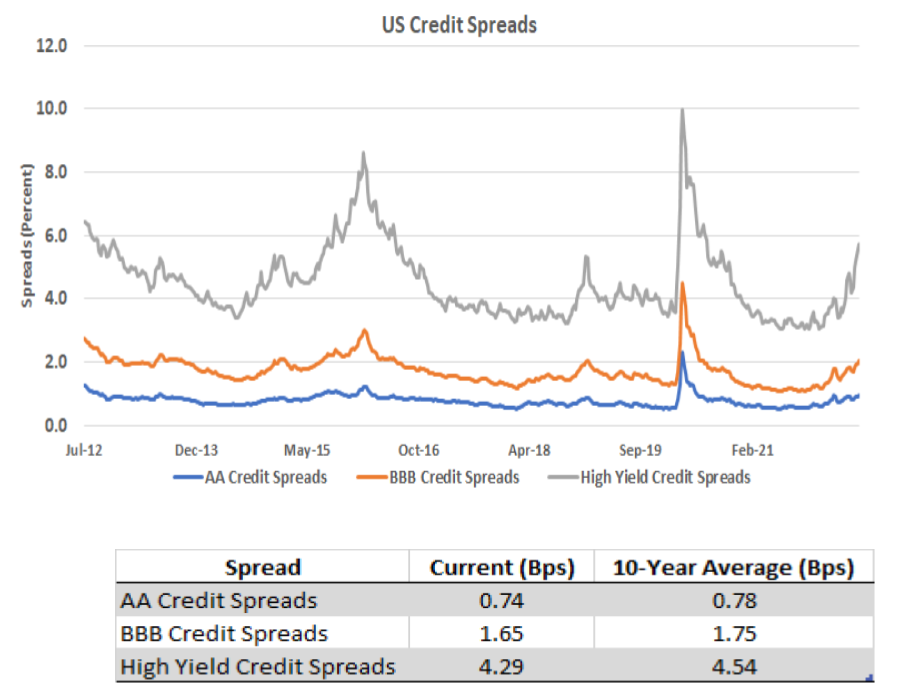
- The difference between corporate bond yields and Treasury yields (credit spreads) remains near long-term averages.
- Credit is neither “cheap” nor “expensive” on a fundamental basis.
- That said, credit spreads are not yet pricing in a slowdown in economic growth and could increase substantially should the U.S. enter a period of economic contraction.
- Scenarios
- Soft landing
- Credit spreads remain very low as expectations for economic growth improve.
- Low-quality credit outperforms high-quality credit as investor willingness to take risk remains high.
- Moderate landing
- Credit spreads increase moderately as economic growth slows.
- Higher-quality credit outperforms lower-quality credit at the margin.
- Hard landing
- Credit spreads increase substantially as expectations for economic growth decline materially.
- Higher-quality credit outperforms lower-quality credit by a wide margin.
- Soft landing
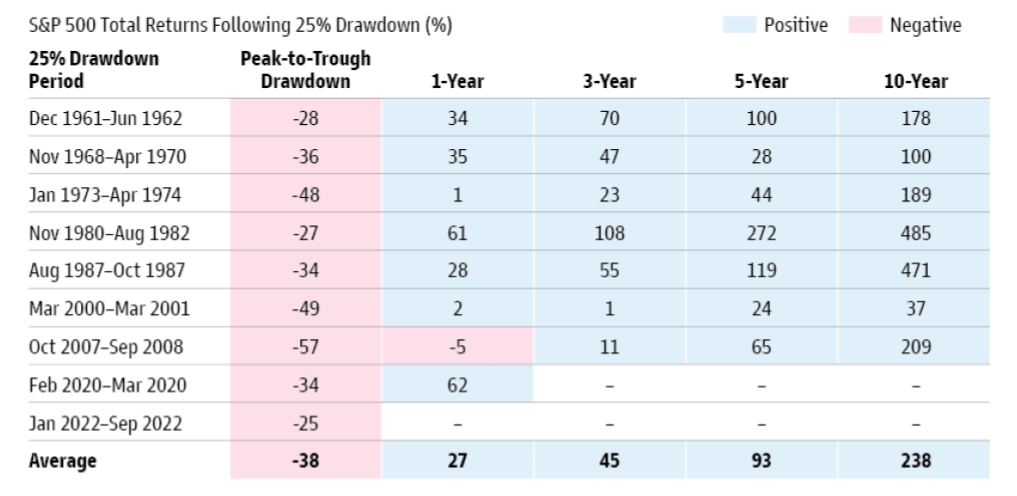
A Note About Equity Market Selloffs
- Long-term investors should remember that equity market selloffs are often followed by periods of above-normal returns.
- Investors that try to “time” market selloffs (i.e., sell stocks ahead of a market decline) usually fail to reinvest prior to the subsequent stock market recovery.
- Takeaways
- Long-term investors should never attempt to time the market.
- Riding out market volatility is the best way to build wealth over the long term.
2023 Playbook Summary
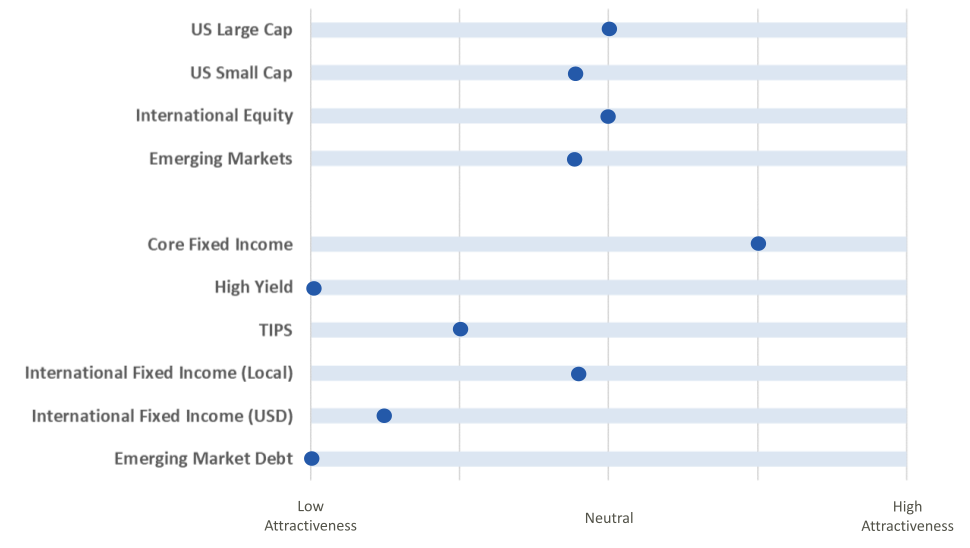
- The above table indicates where each major investment asset class falls on the distribution of attractiveness (from low to high). This table is meant to provide a standardized and comparable view of the level of opportunity in each asset class category.
- In subsequent quarters, we will discuss any movement along the scale for each asset class and the driving forces behind the change in outlook.

