
Capital Markets Playbook | Q4 2022

2022 Q3 Summary
- Equity markets declined in the third quarter as a result of expectations that monetary policy would be more restrictive to growth than originally anticipated.
- Market sentiment deteriorated meaningfully throughout the quarter as market participants became more concerned about inflation and monetary policy intervention.
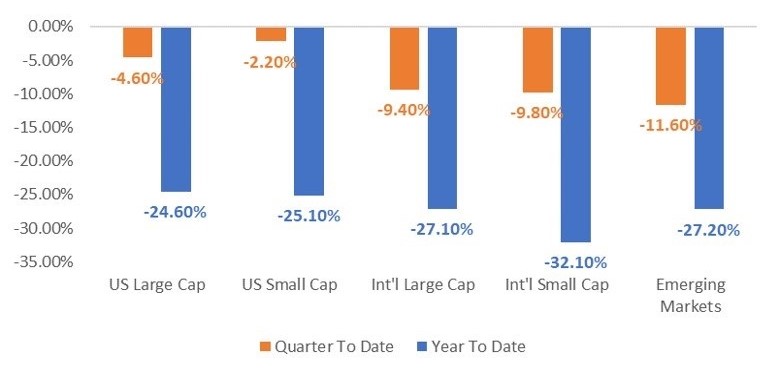
- U.S. equity markets declined across most sectors, with the relative outperformance coming from energy and consumer discretionary.
- Continued strength in the U.S. dollar weighed on international and emerging market equities.
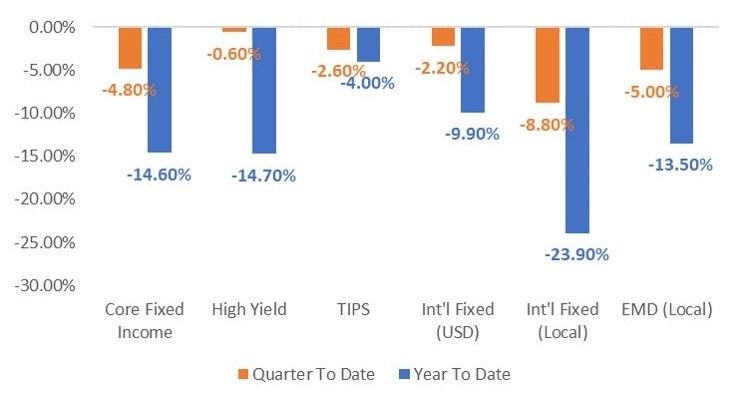
- Fixed income also struggled throughout the quarter as rates moved higher.
- Equity and fixed income performance have continued to exhibit high correlation, a situation that is unusual (and will reverse in time).
- All major fixed income assets sold off in the third quarter, led by international fixed income.
Equity Market Performance
Fixed Income Market Performance
Macroeconomic Outlook for the Next 6-12 Months
- Economic growth
- Economic activity in the U.S. will continue to decelerate over the next 12 months and the probability of recession is higher than normal.
- Non-U.S. economies are slowing at a faster pace than the U.S. as a result of high inflation, tighter monetary policy and local currency weakness. It is likely that some non-U.S. economies will experience recessions sooner than the U.S.
- Any recessionary period in the U.S. is expected to be moderate in nature due to the strength of consumer and business balance sheets.
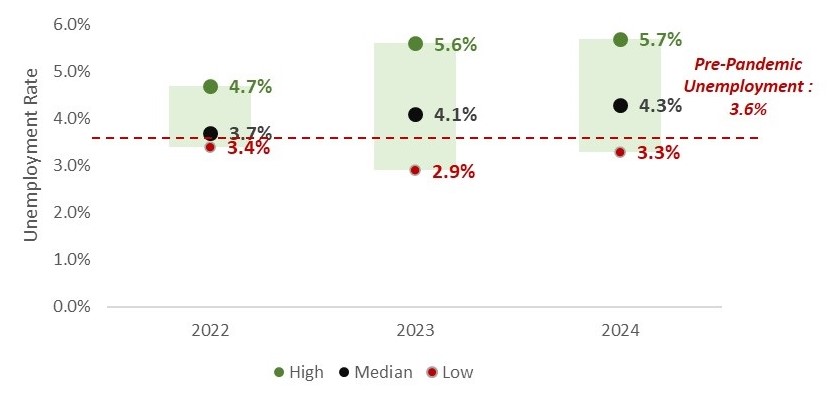
- Unemployment is expected to tick higher in the months ahead, but the probability of extremely high unemployment is low.
- Economic activity in the U.S. will continue to decelerate over the next 12 months and the probability of recession is higher than normal.
- Inflation
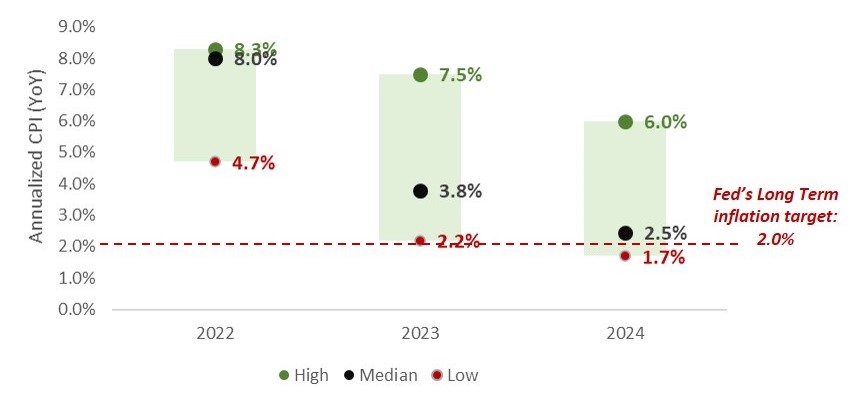
- Expect inflation to moderate meaningfully over the next 12 months but remain above the Federal Reserve’s 2% until 2024.
- Supply chain constraints are improving, prices for goods are moderating and labor shortages are improving in some sectors of the U.S. economy.
- Moderate increases in unemployment will likely continue to push wage growth lower.
- Higher interest rates will begin to slow consumption and investment activity across the aggregate economy.
- Expect inflation to moderate meaningfully over the next 12 months but remain above the Federal Reserve’s 2% until 2024.
- Interest rates
- The Fed has indicated its short-term policy rate will be above 4.25% by the end of 2022.
- Markets have priced in continued rate hikes, with a 75bp rate hike expected in November 2022.
- Interest rate hikes may slow, however, if inflation softens and risks to economic growth escalate.
- The Fed will continue to shrink the size of its balance sheet through its quantitative tightening program. These activities may create moderate upside pressure on longer-term yields.
- That said, the upward movement on yields could be offset by “flight to safety” behaviors if the threat of an economic contraction increases.
- The Fed has indicated its short-term policy rate will be above 4.25% by the end of 2022.
Market Outlook for the Next 6-12 Months
- Equities
- Persistent inflation risk, slowing growth momentum and greater monetary policy uncertainty will result in market volatility remaining elevated in the U.S. over the short term.
- Equity valuations are slightly below long-term historical averages, but further downside in U.S. equities cannot be ruled out as the market discounts the potential for more aggressive or sustained tightening actions from the Fed.
- Expect equity market volatility to decline materially if/when the Fed communicates plans for pausing (or ending) interest rate hikes.
- Growth stocks in the U.S. may outperform value stocks during periods of slowing inflation and slowing economic growth.
- Growth stock valuations have come down in 2022, but still remain well above those of value stocks. That said, declining economic expectations could lead to short-term outperformance from growth stocks.
- International and emerging market stocks remain “cheap” compared to U.S. stocks but may underperform in the short term as economic prospects decline overseas.
- Relative to U.S. equities, long-term valuations for international and emerging market equities remain attractive. Continued strength in the U.S. dollar, however, may weigh on non-U.S. economies until interest rate differentials normalize.
- Persistent inflation risk, slowing growth momentum and greater monetary policy uncertainty will result in market volatility remaining elevated in the U.S. over the short term.
- Fixed income
- Fixed income volatility is likely to remain elevated for corporate credit as economic growth slows and default risk increases.
- Volatility in higher-quality fixed income assets (ex: treasuries) may soften as economic growth concerns increase the demand of safer assets.
- Short-term yields are likely to move higher as the Fed continues its monetary policy tightening program.
- This upward move in short-term yields could be short lived if the economy contracts materially (which may result in interest rate cuts).
2022 Theme: Tighter Monetary Policy
- The Fed uses its monetary policies to achieve its dual mandate of:
- Full employment
- Price stability
- The Fed has attempted to slow inflation by raising interest rates aggressively in 2022.
- Markets anticipate that monetary policy intervention will begin to slow inflation soon, but inflation may remain above the Fed’s 2% inflation target through 2024.
- The Fed is committed to raising interest rates until historically low levels of unemployment move higher.
- Markets anticipate that aggressive monetary policy will continue until unemployment is closer to 4.5% on a sustained basis.
- Takeaways:
- If inflation trends lower and unemployment trends higher, the Fed is more likely pause its interest rates hikes.
- A potential pause in Fed rate hikes cannot be ruled out in early 2023.
Range of Potential Inflation Outcomes
Range of Potential Unemployment Outcomes
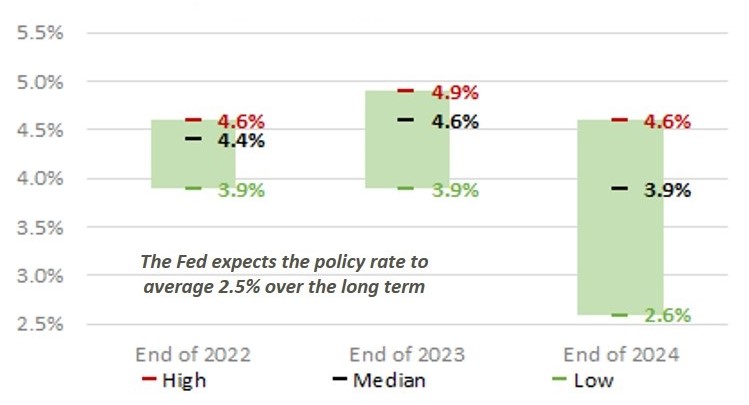
- The Fed has communicated its anticipated plans for rate hikes in 2022, which will likely change as facts and circumstances evolve.
- Fed policy rate at the end of 2022: 4.25% - 4.50%
- Fed policy rate at the end of 2023: 4.5% - 4.75%
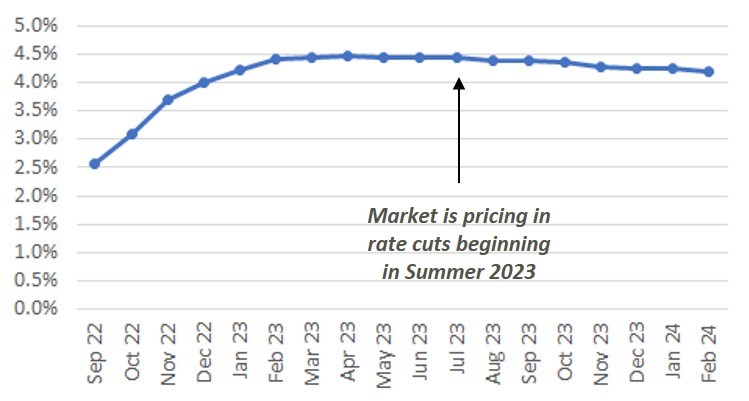
- Markets are expecting rates to remain elevated through much of 2023 but begin to price in rate cuts in the second half of the year.
- Takeaways:
- The Fed will continue with its current plans to raise rates if inflation remains high and unemployment remains low.
- The Fed will likely pause its interest rate hikes if economic conditions warrant a less aggressive monetary policy.
- Fed communication will continue to move markets in the quarters ahead and market volatility will likely remain elevated until market participants are more certain about the path of Fed rate hikes.
Projected Range of Fed Funds Policy Rate
Market Implied Fed Funds Rate
2022 Theme: Inflation
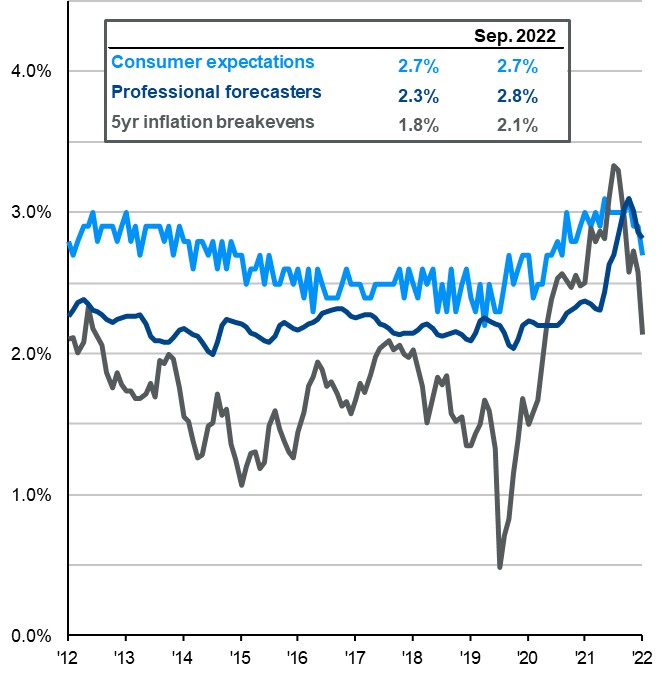
- Despite the recent explosive growth in inflation, forward-looking inflation expectations (5-year) remain somewhat “anchored” to the Fed’s inflation target of 2%.
- Inflation expectations carry a tremendous weight when it comes to Fed policy decision-making.
- Long-term inflation expectations reached a high of 3.4% during the pandemic but have come down meaningfully since the Fed began raising interest rates in 2022. Inflation expectations are currently:
- Market-based long-term inflation expectations: 2.1%
- Consumer long-term inflation expectations: 2.7%
- Professional forecaster long-term inflation expectations: 2.8%
- Takeaways:
- The Fed may become less aggressive with monetary policy if inflation expectations continue to move closer to the Fed’s long-term inflation target of 2%.
- Even though inflation has dominated the market’s attention in 2022, market participants are not concerned about runaway inflation over the intermediate and long term.
Inflation Expectations (5 Yr)
2022 Theme: Decelerating Economic Growth
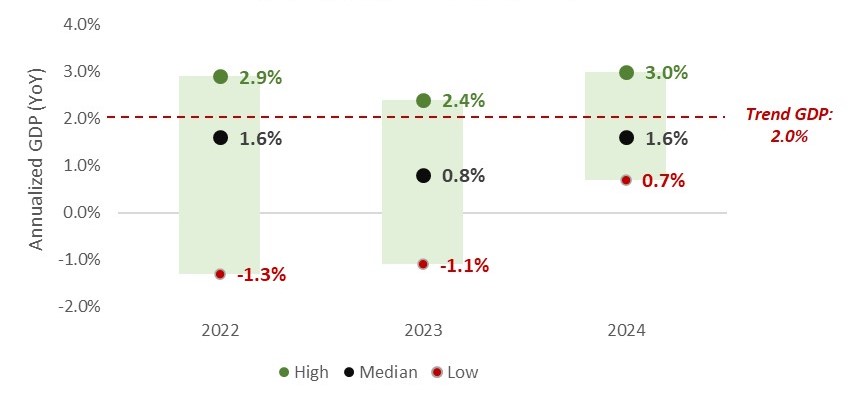
- Tighter monetary policy from the Fed has resulted in declining growth expectations in the U.S.
- Consensus expectation is that the U.S. will grow below the long-term trend rate of 2% through 2024.
- Some forecasters, however, anticipate an economic recession in the U.S. over the near term as higher interest rates begin to slow consumption and investment activity.
- Most forecasts of economic recession imply a relatively low reduction in economic growth.
- Takeaways:
- Recession risk is more elevated than normal as a result of monetary policy intervention from the Fed.
- If inflation remains stubbornly high, it could result in a more aggressive Fed, which would further increase the probability of recession.
- If a U.S. recession does occur soon, it is likely to be relatively minor compared to U.S. recessions in the past.
Range of Potential GDP Outcomes
The Economic Cycle
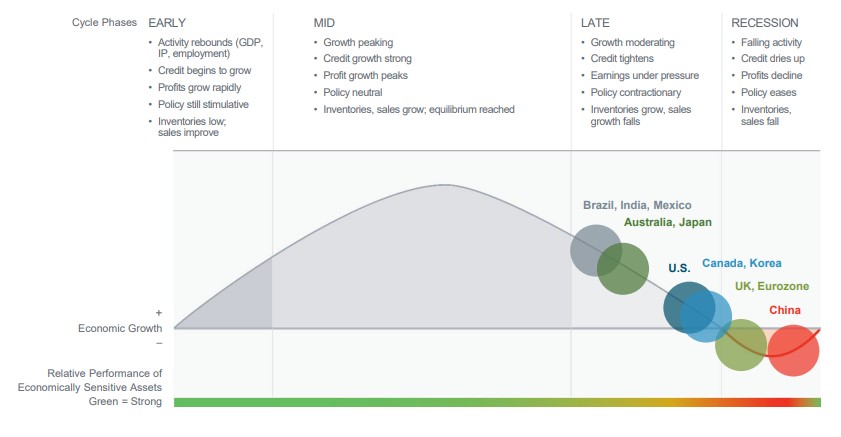
- The U.S. economy is decelerating at a quickening pace and is in the late phase of the economic cycle.
- A recession, which can be defined as two consecutive quarters of negative economic growth, may be on the horizon.
- Other parts of the global economy may be decelerating at a greater clip than the U.S. (ex: Eurozone, UK) due to the strength of the U.S. dollar and its impact on foreign finances and trade.
- China’s economy is attempting to recover from COVID-19 related shutdowns and may be poised to return to economic expansion before any other major economy.
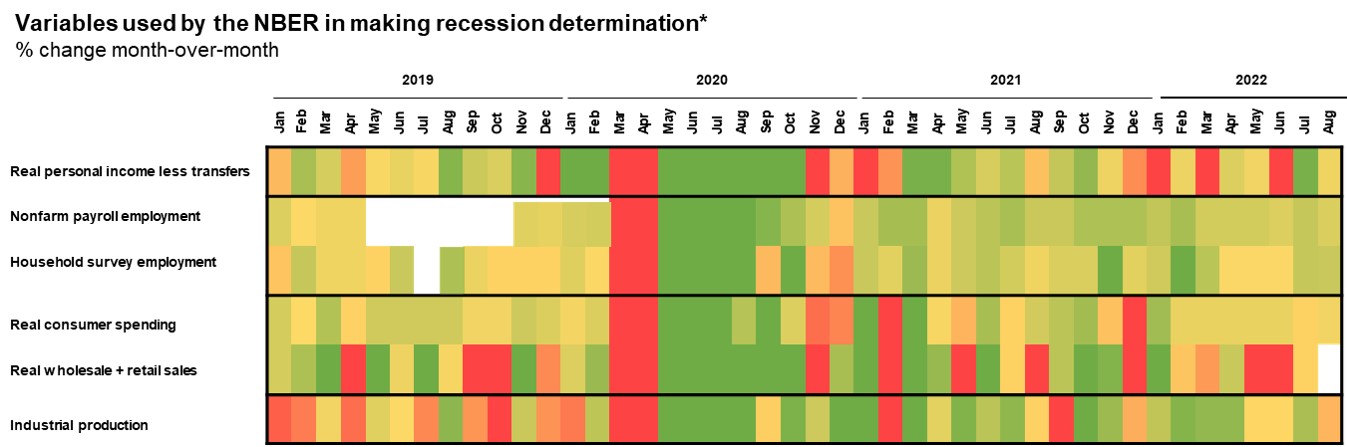
- The table highlights six different economic variables that are most important to economists.
- Green shaded areas represent “strong” economic data, red shaded areas represent “weak” economic data.
- Personal income, consumer spending and industrial production data have been weakening since 2021 and are expected to continue to weaken over the short term.
- Despite a slowdown of some of the factors listed in the table, historically low unemployment has provided a cushion to slowing growth so far this year.
- The NBER’s definition of a recession involves a significant decline in economic activity that is spread across the economy and lasts more than a few months. Because a recession must influence the economy broadly and not be confined to one sector, the committee emphasizes economy-wide measures of economic activity, as listed above.
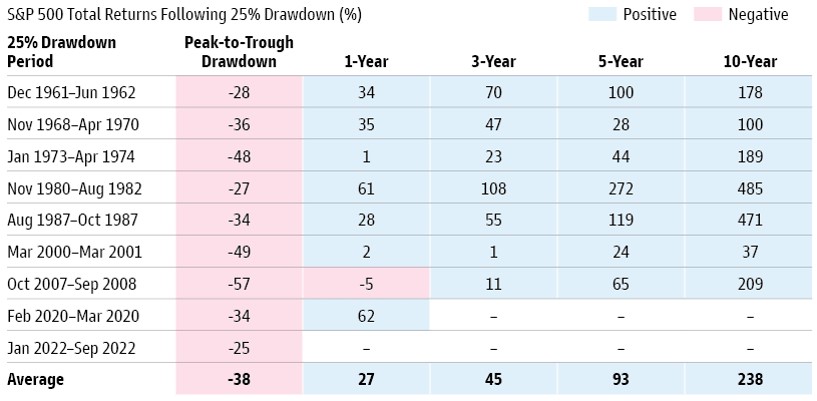
2022 Theme: Equity Market Volatility
- The S&P 500, a broad-based benchmark for U.S. Large Cap equity, has declined 25% so far in 2022 (through 9/30/2022).
- Large equity market drawdowns like the one seen so far in 2022 have often resulted in strong performance in subsequent years.
- Example:
- The S&P 500 declined 27% over a 23-month period ending in August 1982.
- The S&P 500 returned more than 100% over a 36-month period following the drawdown.
- The S&P 500 returned close to 500% over a 10-year period following the drawdown.
- Example:
- Takeaway:
- Despite the poor equity performance in 2022, long-term investors are wise to stay invested.
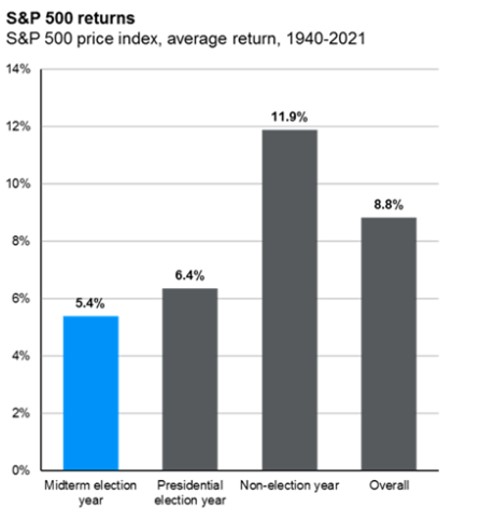
Midterm Election Update
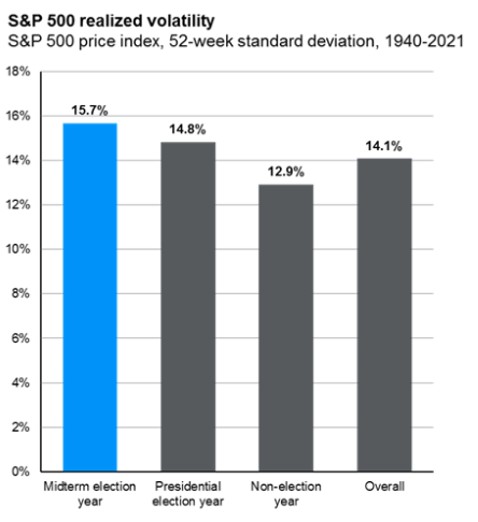
- Markets often experience lower returns and higher volatility during midterm election years due to heightened uncertainty.
- Volatility is usually a result of investors discounting potential changes in congressional leadership.
- The Senate is currently split evenly with Vice President Kamala Harris casting the tie-breaking vote.
- Current polling suggests that the Democrats may hold onto Senate leadership in 2023, but this is far from certain.
- The House of Representatives is currently held by the Democrats with a four-seat majority.
- Current polling suggests that Republicans may take over leadership in the House in 2023, but this result is also far from certain.
- Takeaways:
- Any market reaction to election outcomes is likely to be short term in nature.
- Market reactions to political issues are often “noise” that should not impact investment decision-making.
2022 Theme: Equity Market Volatility
S&P 500 Performance and Intra-Year Declines
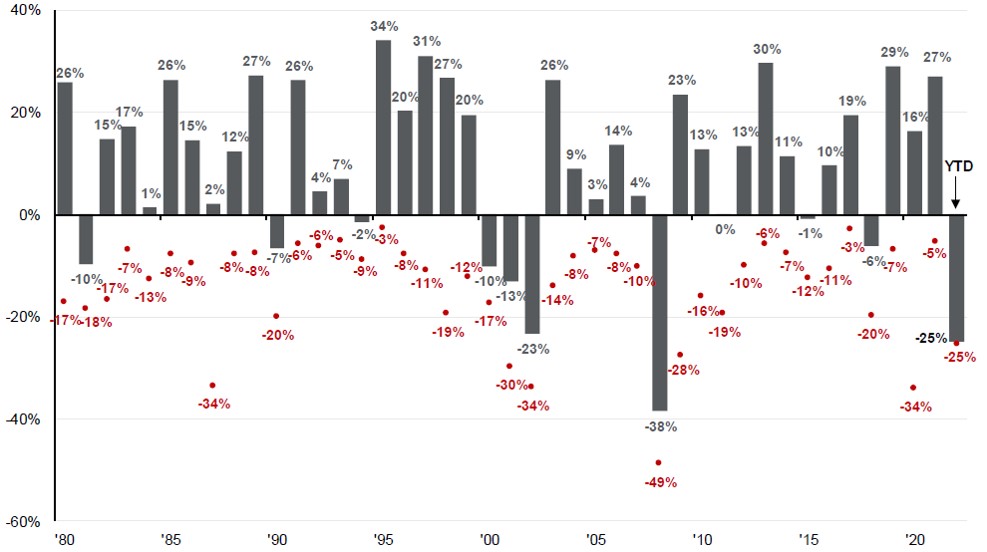
- The chart illustrates annual S&P 500 performance since 1980 (shown in columns above) and the intra-year declines during each year (shown by the red dots).
- Ex: In 2020, the S&P 500 experienced an intra-year decline of -34% before finishing up 16% for the year.
- Over the past 42 years, the S&P 500 has experienced an average intra-year decline of 14%. Despite that, the S&P 500 had positive annual performance in 32 of the last 42 years.
- Takeaway:
- As painful as market volatility can be, equity market sell-offs are normal and investors are rewarded for patience.
2022 Theme: Fixed Income Market Volatility
Bloomberg Aggregate Bond Index Performance and Intra-Year Declines
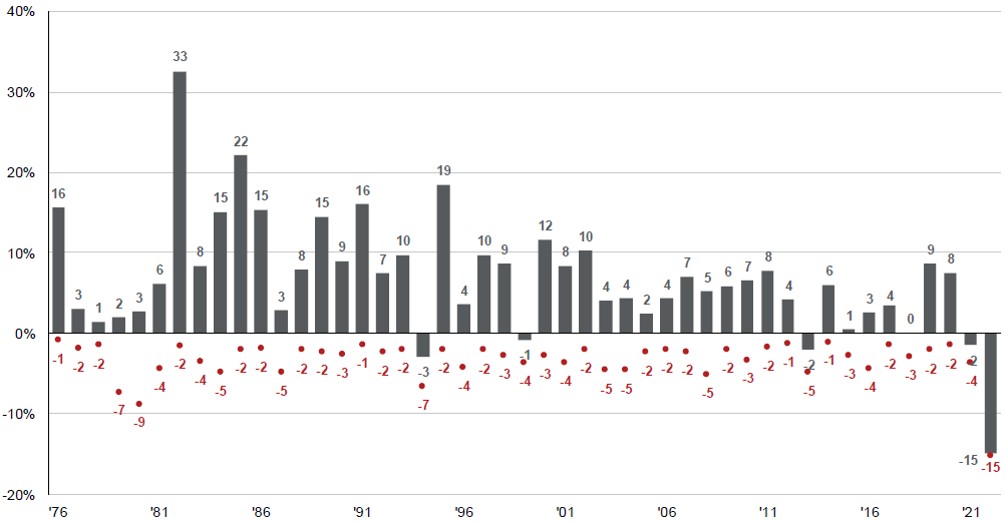
- The chart illustrates annual broad based fixed income market performance since 1976 (shown in columns above) and the intra-year declines during each year (shown by the red dots).
- Ex: In 2016, the Bloomberg Barclays Aggregate Bond Index experienced an intra-year decline of -4%, but the index was up 3% for the year.
- Over the past 42 years, the Bloomberg Barclays Aggregate Bond Index has experienced an average intra-year decline of 3.1%. Despite that, the Bloomberg Barclays Aggregate Bond Index had positive annual performance in 42 of the last 46 years.
- Takeaway:
- As painful as market volatility can be, fixed income market sell-offs are normal and investors are rewarded for patience.
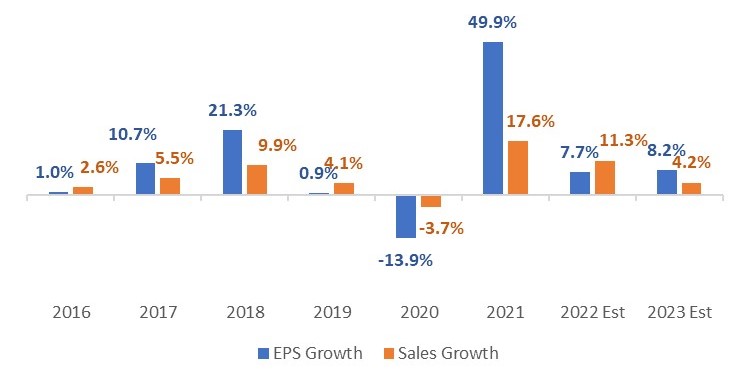
2022 Theme: Decelerating Growth in Corporate Earnings
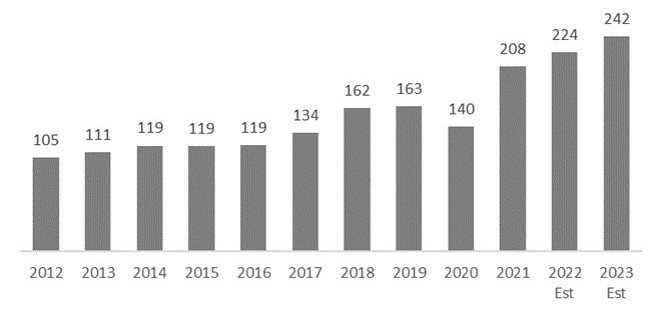
- U.S. corporate earnings growth estimates for 3Q 2022 have declined steadily during the quarter.
- The S&P 500 is expected to report earnings growth of +2.9% for 3Q. This compares to the estimated year-over-year growth rate of 9.8% on June 30.
- Current forward P/E of the S&P 500 is approximately 15.4x. This is relative to 21.5x as of the end of 2021 and 17x as of the start of the quarter. The decline in P/E has been entirely driven by multiple compression.
- Corporate earnings are expected to grow by approximately 8% in 2022. This compares to the historical average of 6%.
- Analysts have become more pessimistic in their earnings estimates for S&P 500 companies for the third quarter, after keeping previous estimates high in our opinion.
- U.S. recessions, on average, have resulted in EPS declines of 20%. We are cautious of the possibility for further decline in equity markets should a recession occur.
- Takeaway:
- Slowing growth, tightening financial conditions, lingering supply chain pressures and FX headwinds could pressure companies’ bottom lines in 2022. We could continue to see contraction in S&P 500 EPS estimates as the Fed maintains a hawkish stance. A recession could imply further pressure on earnings.
S&P 500 Bottom-Up EPS Actuals & Estimates
S&P 500 Earnings & Revenue Growth
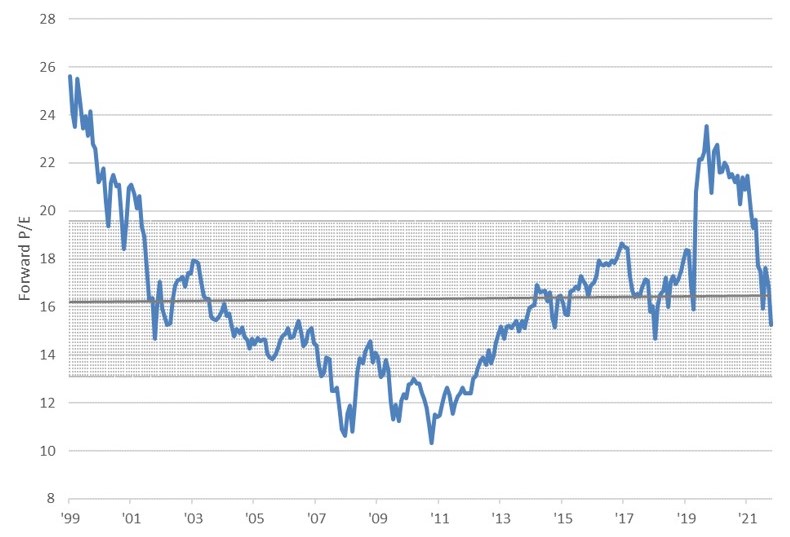
2022 Playbook: U.S. Equity
- Valuation measures of U.S. stocks have declined to more reasonable levels.
- U.S. Large Cap equities have declined below their 25-year average of approximately 16.8x. While downside risk remains for equity markets, current levels are more attractive from a historical perspective.
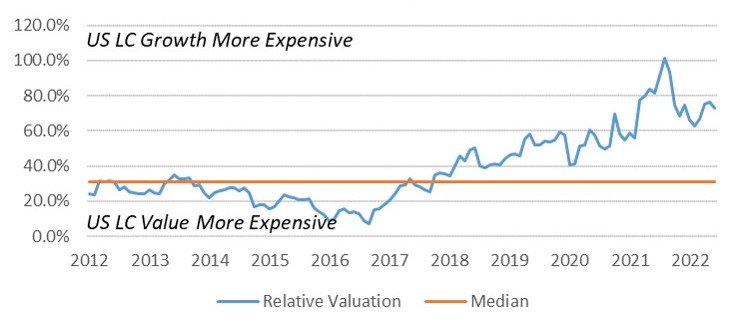
- “Growth” stocks in the U.S. are significantly more expensive than “value” stocks, despite their significant underperformance year to date.
- Equity valuations outside the U.S. remain far below their long-run averages as well.
- Higher interest rates will likely continue to compress valuations. U.S. value stocks and international equities may be better positioned to outperform.
- Takeaways:
- Depressed equity valuation levels in U.S. Large Cap should set investors up for better returns in the long run.
- Investors may be best suited to apply a balanced allocation between “growth” and “value” as we navigate the current environment.
S&P 500 Forward P/E Ratio
Relative Valuation
U.S. Large Cap Growth vs. U.S. Large Cap Value
Forward P/E
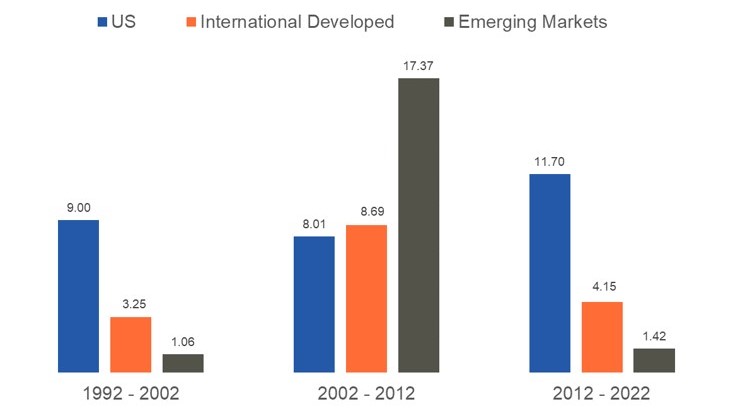
2022 Playbook: International Equity
- U.S. investors have benefited from home-country overexposure in the past 10 years.
- Consistent outperformance of U.S. equity markets is not a natural state and will reverse at some point.
- Historical returns over longer time periods show that return differences between U.S. and international markets are cyclical in nature (the current cycle of U.S. outperformance is the longest ever recorded).
- Even though U.S. equities entered a bear market in 2022, international and emerging market equities appear more attractive and have a higher potential for upside as a result.
- Takeaways:
- Investors that shy away from international and emerging market equities are likely reducing the upside potential of their investment portfolios.
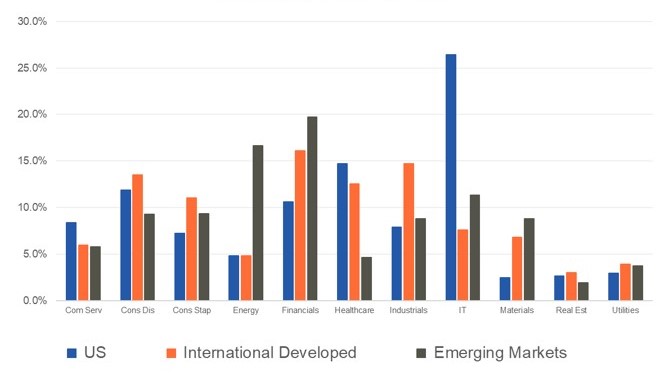
- Benefits of a globally diversified portfolio are not solely geographic. Sector exposure varies across global markets.
World Equity Annualized Market Performance (%)
World Equity Sector Allocation
2022 Playbook: Fixed Income
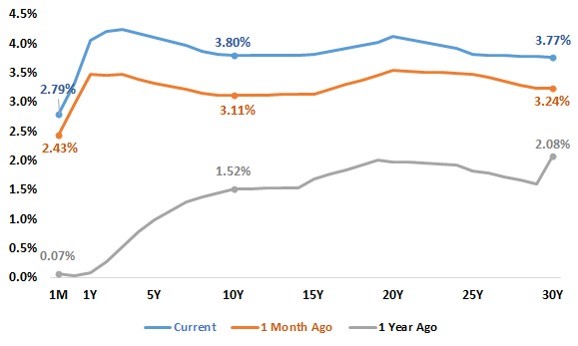
- Short-term fixed income yields have increased dramatically over the quarter as the Fed maintained their aggressive interest rate hiking and expectations of rates began moving upwards.
- After the September meeting, the Fed released their dot plot of rate hike expectations which showed a median year-end rate of 4.375%, suggesting additional hikes of 0.5% or more.
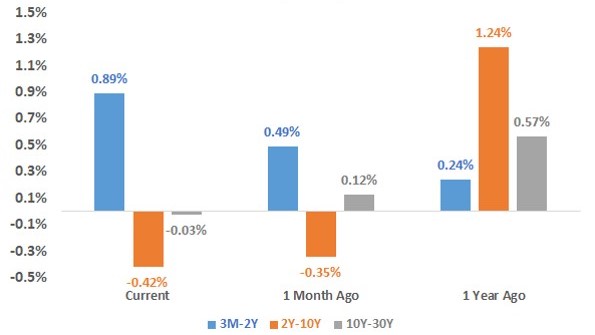
- The yield curve became inverted at the beginning of Q3. The entire yield curve shifted upward, but shorter-term rates spiked as it became clear the Fed would continue hiking and not pivot.
- Short-term yields, which are highly impacted by Fed policy rates, are set to move higher in the final months ahead as the Fed continues raising its policy rate.
- Long-term yields, which are highly impacted by growth expectations, did not rise as much, as investors brace for slower economic growth and look for safety.
- Inverted yield curves are a popular signal of recessions, yet an imperfect one. Not every inversion results in recession. The lag between inversion and recession is over 12 to 24 months and should not be used for short-term trading decisions.
- Takeaway:
- An inverted yield curve, while serious, should not prompt investors to overhaul portfolios or abandon their strategy.
U.S. Treasury Yields
U.S. Treasury Yield Spreads
- Long-term interest rates have increased dramatically in 2022, but the risk of even higher interest rates over the short term may be somewhat low.
- Long-term interest rates are determined by market supply and demand (i.e. long-term rates are not dramatically impacted by Fed interest rate policy).
- Supply and demand for long-term interest rates is primarily driven by the market’s expectations for economic growth and inflation.
- Expectations for slower growth and lower inflation may put a “cap” on long-term rates over the short term.
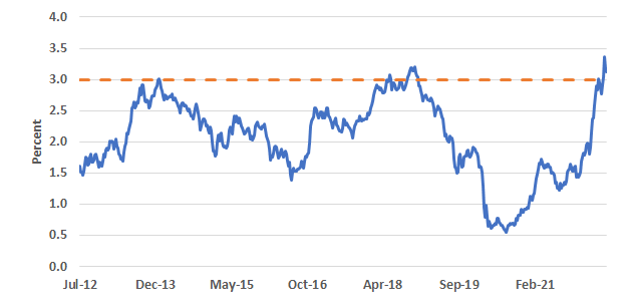
- Additionally, it is important to note that since the Financial Crisis, the 10-year treasury yield has struggled to break and remain above 3% for any sustainable amount of time.
- Takeaways:
- While rates have surprised to the upside in 2022, it is likely that long-term rates will decline if economic growth and inflation expectations continue to decline.
- Extending portfolio duration may be the most appropriate way for fixed income investors to navigate the uncertain environment.
10-Year Treasury Yield
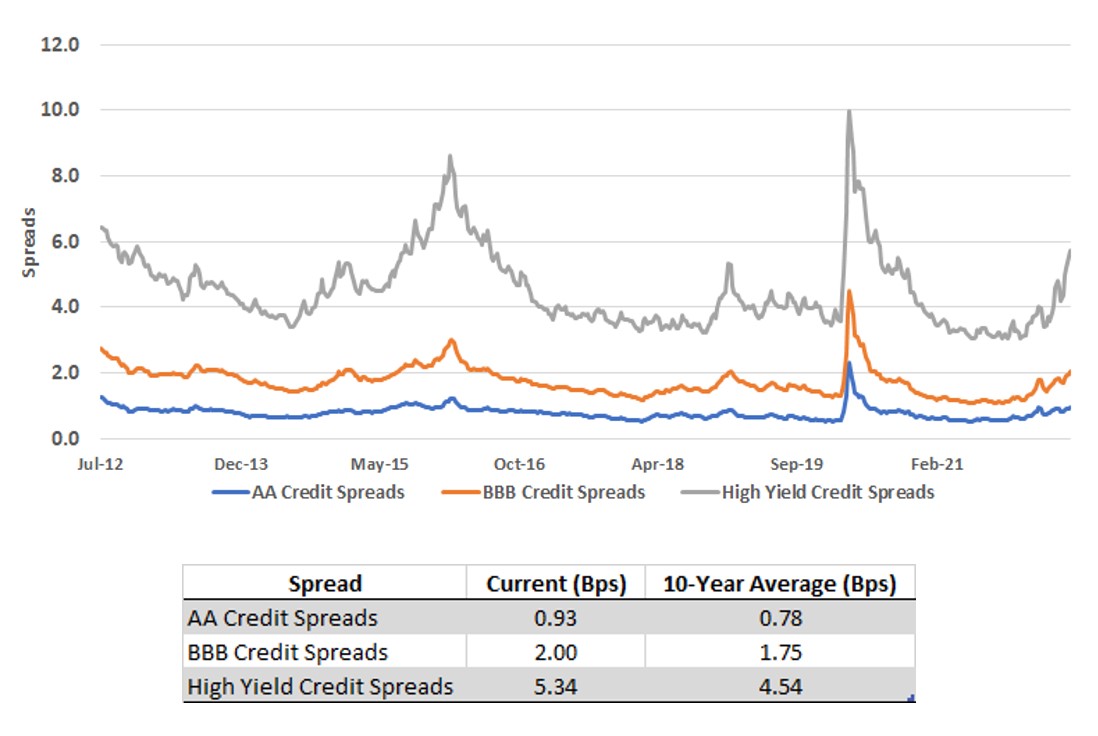
- The difference between corporate bond yields and treasury yields (credit spreads) has increased in 2022 after reaching historical lows in 2021.
- Spreads for lower-quality fixed income (ex: high yield) steadily widened through all three quarters of the year and now are above the past 10-year average.
- This so called “spread widening” is a direct result of increasing investor concerns over default risk.
- Despite the recent widening of credit spreads, further deterioration in economic strength could result in more upward pressure on corporate bond yields (and lower prices).
- Takeaway:
- Repositioning the fixed income portfolio to include higher-quality credit is prudent given the current risks to the economic outlook.
U.S. Credit Spreads
2022 Playbook Summary
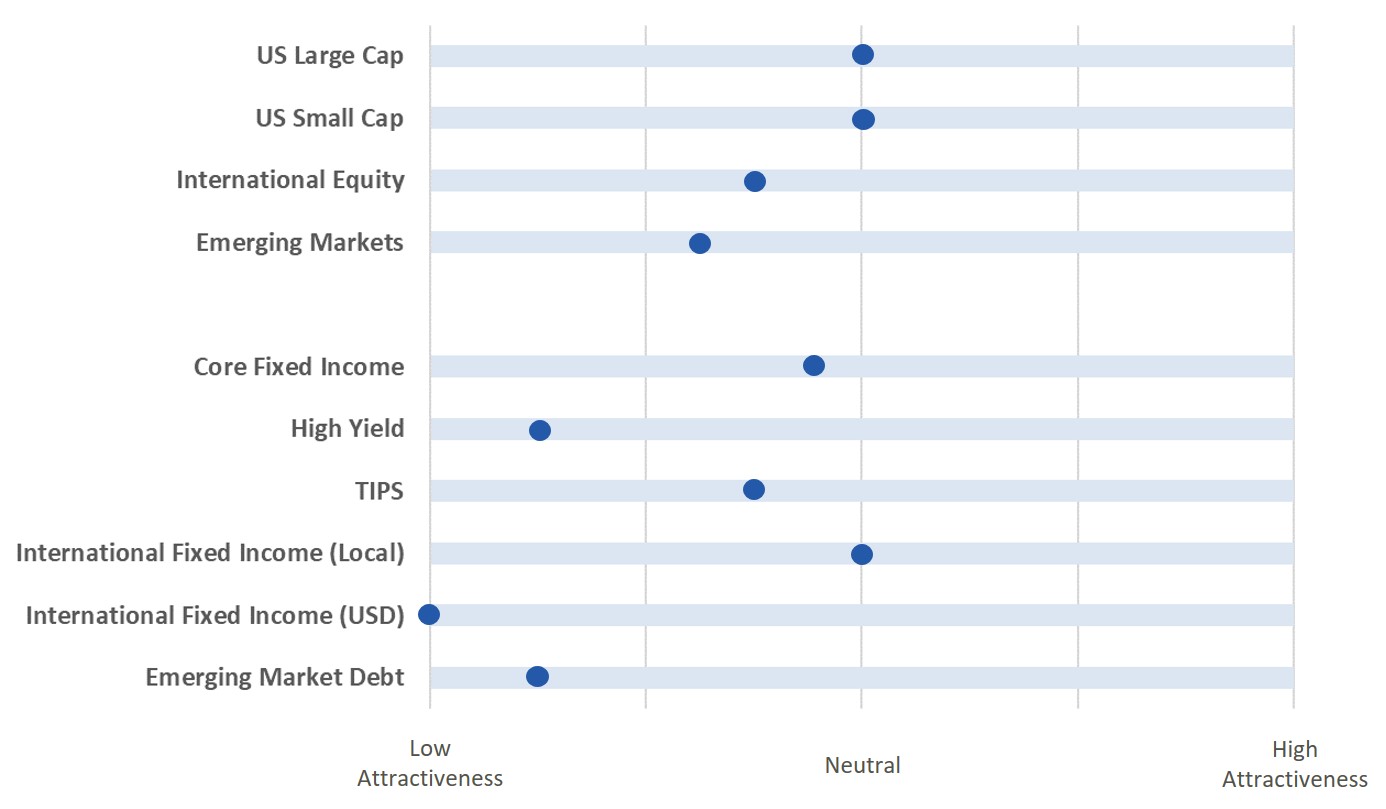
- The above table indicates where each major investment asset class falls on the distribution of attractiveness (from low to high). This table is meant to provide a standardized and comparable view of the level of opportunity in each asset class category.
- In subsequent quarters, we will discuss any movement along the scale for each asset class and the driving forces behind the change in outlook.
Disclaimer

