
Capital Markets Playbook | Q4 2023

2023 Q4 Summary
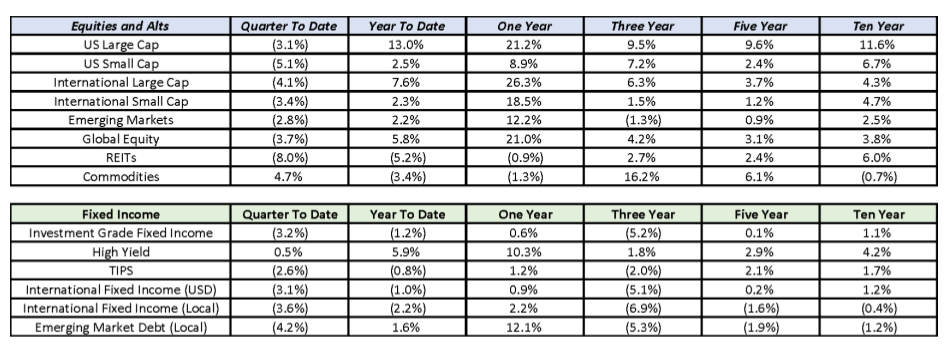
- Equity markets experienced heightened volatility in the third quarter as concerns over monetary policy began to weigh on investors.
- Most major equity asset classes were down at least 3% in the third quarter. U.S. Small Cap suffered the largest decline (-5.1%).
- However, despite the selloff over the third quarter, stocks are still up in 2023. Year to date, U.S. Large Cap remains the best performing major equity asset class (+13%).
- Fixed income markets also faired poorly in the third quarter, largely due to the same concerns over monetary policy.
- Investment Grade Fixed Income was down more than 3% over the past three months and is down more than 1% year to date.
- High Yield has outperformed all other major fixed income asset classes year to date (+5.9%) as investor concerns over defaults have yet to materialize.
Economic Expectations
- Economic growth in the U.S. has been stronger than originally expected in the first three quarters of 2023, but the possibility of an economic recession over the next 12-24 months cannot be ruled out.
- Reasons for cautious optimism:
- Core Inflation has declined by more than 2% since fall of 2022.
- Unemployment remains low (3.8%).
- Labor markets have become less tight and wage growth is no longer increasing across the aggregate economy.
- Reasons for more caution:
- The Federal Reserve’s aggressive rate hikes are beginning to impact the overall economy in the following ways:
- Banks are tightening lending standards. The availability of credit is declining.
- Consumer discretionary spending is moving lower.
- Small business optimism is declining and hiring plans are being delayed.
- In the short term, the partial U.S. government shutdown, UAW strikes and the resumption of student loan payments will dampen economic activity.
- The Federal Reserve’s aggressive rate hikes are beginning to impact the overall economy in the following ways:
- Reasons for cautious optimism:
- Markets will be watching a number of important data points in the weeks ahead as investors look for certainty on what the future holds for the U.S. economy. The most important questions that investors are focused on are shown below.
- Inflation
- Will inflation continue to decline and revert back to the Fed’s 2% target?
- Unemployment
- How much will unemployment increase as the economy slows in the quarters ahead?
- Monetary policy
- The Fed continues to suggest that interest rates will be higher for longer. Will the Fed continue to raise short-term interest rates in the months ahead even though it appears that inflation is moderating?
- Economic growth
- Will the U.S. slip into a period of economic contraction in 2024? If so, just how deep would a recession be?
- Inflation
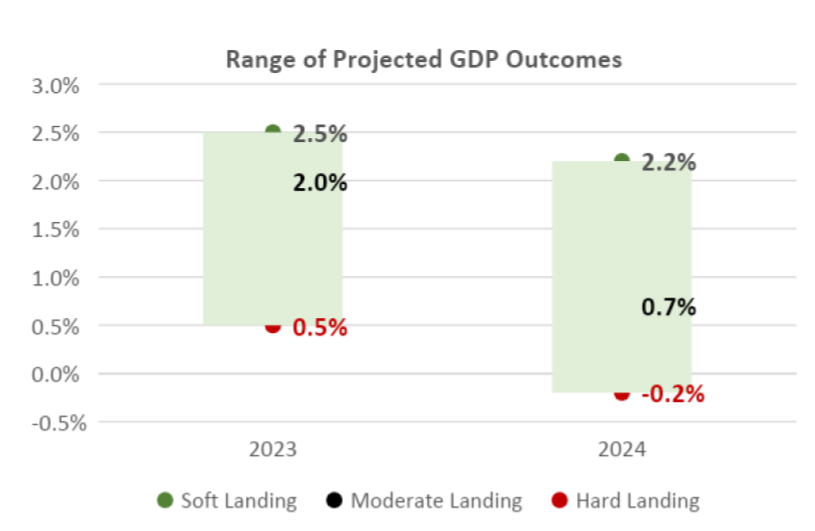
- Given all the uncertainty in the underlying economy, there are a wide range of possible outcomes for economic growth in the U.S. over the next two years.
- While it is impossible to detail each of the possible outcomes, there are three broad-based themes that investors are focused on.
- Soft landing: Economic growth is stronger than expected; the U.S. avoids a recession.
- Unemployment remains below 4.5%.
- Inflation is sticky and remains well above the Fed’s 2% target.
- Monetary policy remains tighter for longer than expected and the Fed raises rates more than expected.
- Important notes:
- A soft landing would be good for the U.S. in the short term, but it would also create a higher probability of a deeper recession in the future.
- Markets are currently pricing in a soft landing.
- Moderate landing: Economic growth slows moderately; the U.S. enters a mild recession.
- Unemployment increases moderately and is close to the “natural rate of unemployment.”
- Inflation continues to fall moderately but remains above the Fed’s 2% target into 2025.
- Monetary policy remains restrictive, but the Fed pauses rate hikes in late 2023 or early 2024.
- Important note:
- Even though the market is currently pricing in a “soft landing,” a “moderate landing” may be the most probable outcome based on today’s facts and circumstances.
- Hard landing: Economic growth declines materially; the U.S. enters a deeper recession than most currently expect.
- Unemployment increases materially.
- Inflation slows materially and may reach the Fed’s 2% target in 2024.
- Monetary policy becomes dovish (the Fed may cut rates in early 2024).
- Important notes:
- A “Hard landing” would create painful outcomes over the short term, but is not expected to be as painful as other severe recessions the U.S. has experienced in the recent past (ex: financial crisis)
- A “Hard landing” may be the least probable outcome based on current facts and circumstances, but cannot be ruled out.
- Soft landing: Economic growth is stronger than expected; the U.S. avoids a recession.
Is a “Soft Landing” In The Cards?
- For the past few months, equity and fixed income markets have effectively priced in a high probability of a “soft landing.”
- Throughout much of 2023, fixed income yields have risen dramatically on the long end of the yield curve and equity valuations moved higher as well.
- A soft landing is far from certain, however, and the probability of a recession over the short term remains elevated.
- Interest rate hikes take time to filter through the aggregate economy, and recently, it does appear that higher rates are beginning to slow certain segments of the aggregate economy.
- Additionally, there are short-term risks that have emerged recently that may have negative impacts on the U.S. economy. These include:
- Reinstatement of student loan payments
- The resumption of student loan payments could slow consumer spending by as much as $300B a year and may potentially reduce economic growth by as much as 0.5% in 2024.
- UAW strikes
- Even though automobile manufacturing makes up a rather small part of U.S. economic activity, there are other industries (ex: materials, technology) that would be negatively impacted by a long-standing strike.
- UAW strikes, by some estimates, could reduce economic growth in the U.S. by 0.3% for every month there is no agreement.
- High energy prices
- Energy prices have increased substantially over the past few months and discretionary consumption has declined as a result. If energy prices remain high in the months ahead, it will result in slower economic growth.
- Partial government shutdown
- The possibility of a partial government shutdown occurring before the end of 2023 still exists despite a short-term resolution that was passed recently.
- Should a partial government shutdown occur before the end of the year, it could slow economic growth by as much as 0.2% for each week it lasts.
- Reinstatement of student loan payments
- Takeaway:
- A soft landing is far from assured, and given the emergence of new risks, it is prudent for investors to remain somewhat cautious until the Fed signals a more accommodative interest rate policy.
2023 Theme: Decelerating Economic Growth
- While the prospects for economic growth are largely uncertain today, the following can be said with confidence:
- The U.S. economy has been much stronger than expected in 2023, but a “soft landing” is far from a guaranteed outcome.
- The U.S. will likely avoid a recession in 2023, but the probability of an economic contraction in 2024 remains elevated.
- If U.S. economic growth is much stronger than anyone anticipates over the next two years, it could exacerbate inflationary pressure and create more financial pain in future years.
- Scenarios:
- Soft landing
- Economic activity in the U.S. is higher than its long-term trend rate over the next two years.
- Moderate landing
- Economic activity in the U.S. is below its long-term trend rate and the U.S. may enter into a short-term, shallow recession.
- Hard landing
- Economic activity declines materially and the U.S. enters into a recession.
- GDP is well below the long-term GDP trend rate over the next two years.
- Soft landing
The Business Cycle
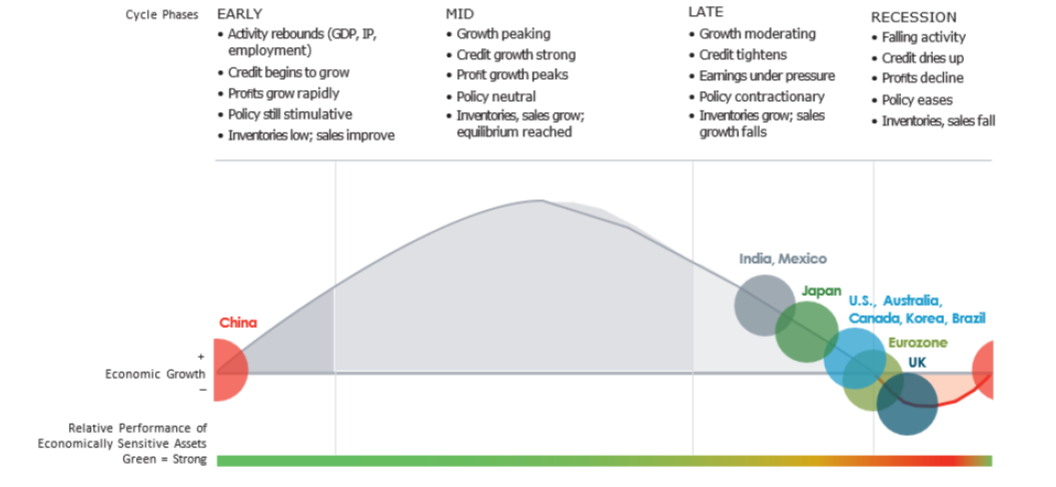
- Despite stronger-than-expected growth in 2023, the U.S. economy is in the late phase of the economic cycle.
- A recession, which can be defined as two consecutive quarters of negative economic growth, may occur before the end of 2024.
- Other parts of the global economy may be decelerating at a greater clip than the U.S. (ex: Eurozone, UK) due to the strength of the U.S. dollar and its impact on foreign finances and trade.
- Many parts of Europe are likely in a recession already (or will be soon).
- China’s economy, which has been slower than expected in 2023, is likely to strengthen in 2024.
Surveys and Financial Indicators Imply Slower Growth
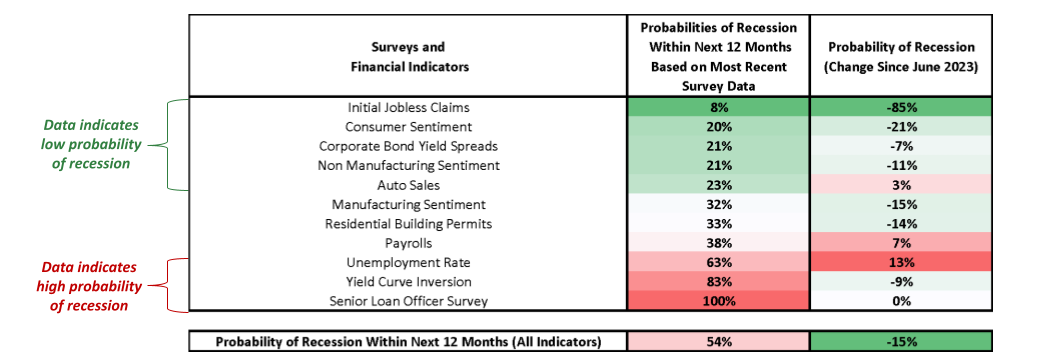
- The table above lists recession probabilities based on the current values for selected surveys and financial indicators.
- Example: When consumer sentiment has been at its current level, the U.S. has entered into a recession within the next twelve months about 20% of the time.
- The probability of a recession over the next twelve months has declined about 15% since June 2023.
- Takeaways:
- The probability of recession over the next 12 months is still higher than normal (54%), but survey data indicates that the economy has strengthened in the past few months.
- Certain indicators suggest that the economy is strong enough to avoid a recession in the next year (consumer and manufacturing sentiment), while other indicators suggest that the U.S. is likely to enter into a recession within the next twelve months (payrolls and unemployment rate).
- While past performance is not an indicator of future results, it is important to note that certain financial indicators (ex: yield curve inversion) are less volatile and have better predictive value than others (ex: auto sales).
- The probability of recession over the next 12 months is still higher than normal (54%), but survey data indicates that the economy has strengthened in the past few months.
2023 Theme: Higher Unemployment, Slower Wage Growth
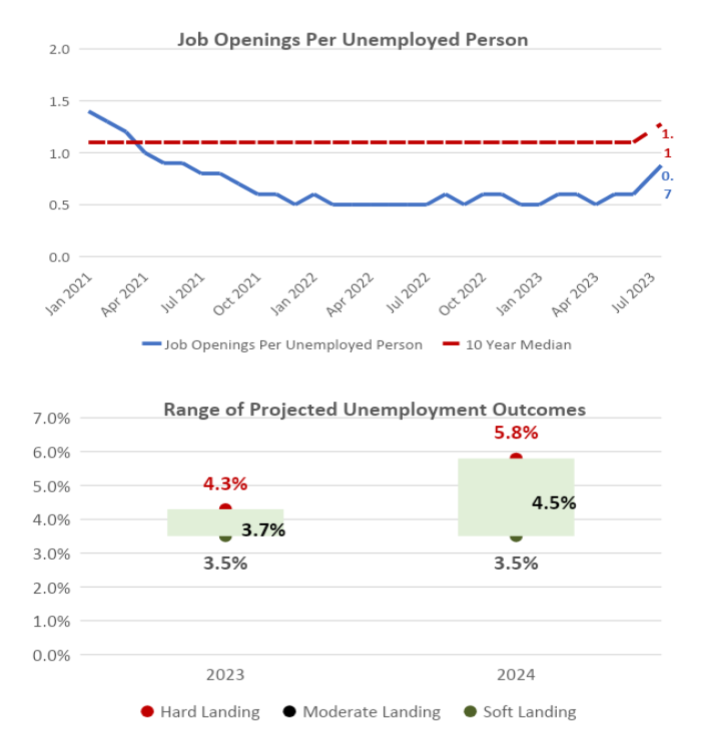
- The labor market has begun to cool in recent months, but unemployment remains near historic lows (3.7%).
- The labor market is still tighter than normal, but the number of job openings per unemployed person has improved in recent months (which has led to declines in wage growth).
- Scenarios:
- Soft landing
- Unemployment is largely unchanged from its current level and remains near historical lows over the next two years.
- Moderate landing
- As economic growth slows in the U.S., unemployment ticks higher, but remains below 5% over the next two years.
- Hard landing
- Unemployment exceeds 6% by the end of 2024 as a result of meaningfully slower economic growth.
- Soft landing
2023 Theme: Slowing Inflation
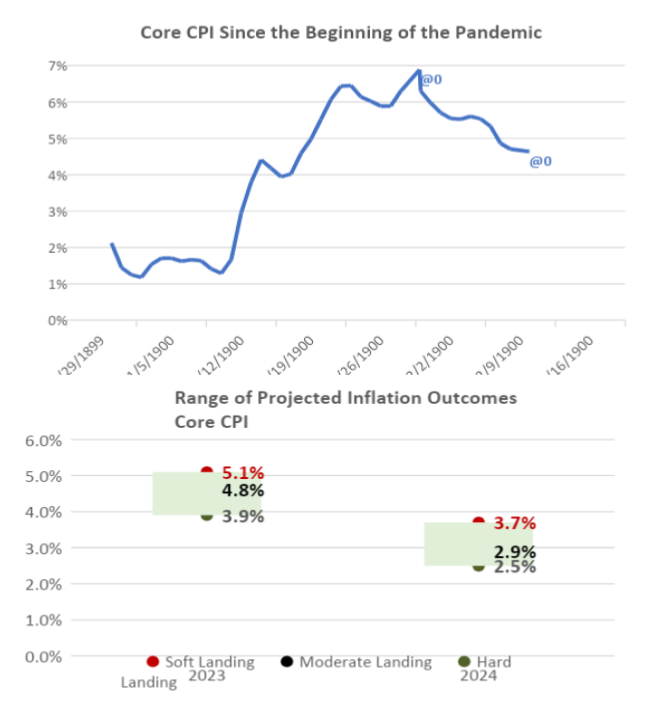
- Inflation has moved lower in recent months and appears to be heading lower in the months ahead.
- Core CPI has declined more than 2% since peaking in September of 2022.
- Still, inflation has been somewhat “sticky” in 2023 and remains well above the Fed’s 2% long-term objective.
- Scenarios:
- Soft landing
- Inflation continues to be sticky throughout the aggregate economy and remains about 2% higher than the Fed’s long-term inflation target through the end of 2024.
- Moderate landing
- Inflation continues to moderate slowly and is still about 1% above the Fed’s 2% target by the end of 2024.
- Hard landing
- Inflation falls abruptly as a result of slower economic growth and is close to the Fed’s long-term inflation target before the end of 2024.
- Soft landing
2023 Theme: Tighter Monetary Policy
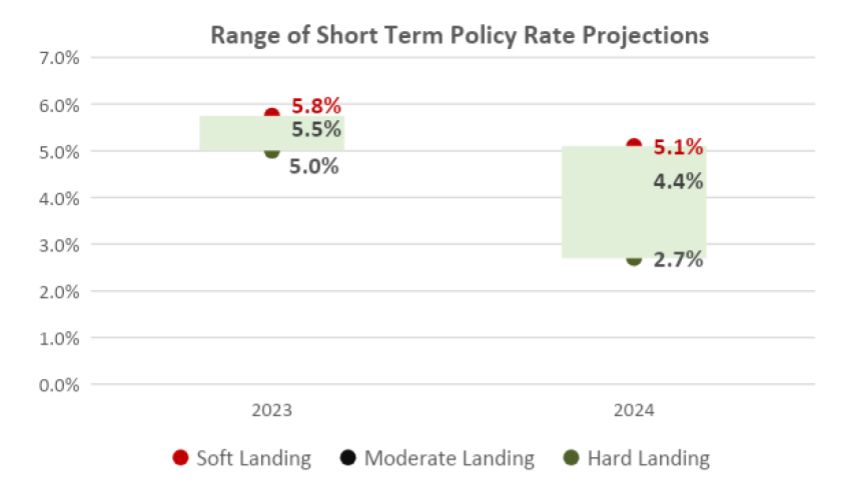
- The Federal Reserve continues to maintain its hawkish stance on monetary policy and has signaled its overnight policy rate could increase by another 0.25% to 0.50% before the end of 2023.
- Scenarios:
- Soft landing
- High inflation and low unemployment allow the Fed to keep hiking interest rates through the end of 2023 and into 2024.
- The Fed’s short-term policy rate remains above 5% through the end of 2024.
- Moderate landing
- Moderating inflation and slightly higher unemployment allow the Fed to begin slowly cutting rates by the middle of 2024.
- The Fed’s short-term policy rate remains above 4% through the end of 2024.
- Hard landing
- Inflation drops quickly and unemployment increases to the point where the Fed begins aggressively cutting rates in 2024.
- The Fed’s short-term policy rate is below 3% by the end of 2024.
- Soft landing
- Scenarios:
2023 Theme Decelerating Economic Growth
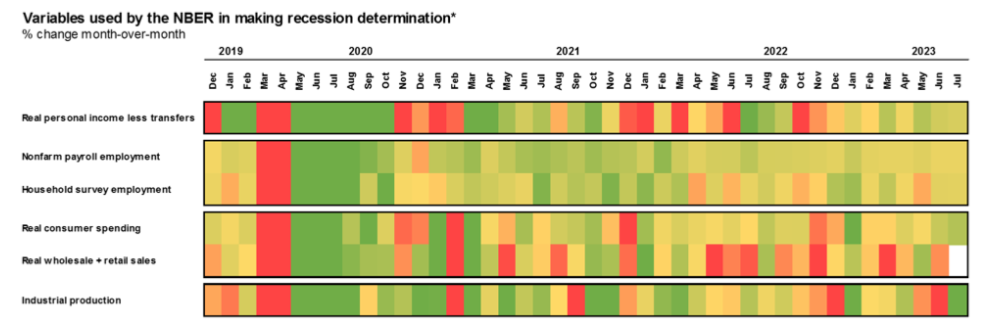
- The table highlights six economic variables that are most important to economists.
- Green shaded areas represent “strong” economic data; red shaded areas represent “weak” economic data.
- Personal income, consumer spending and industrial production have held up so far this year, helping to contribute to higher-than-expected economic growth in 2023.
- That said, higher interest rates will certainly have a negative impact on employment, consumption, sentiment and economic growth over the near term.
2023 Theme: Market Volatility
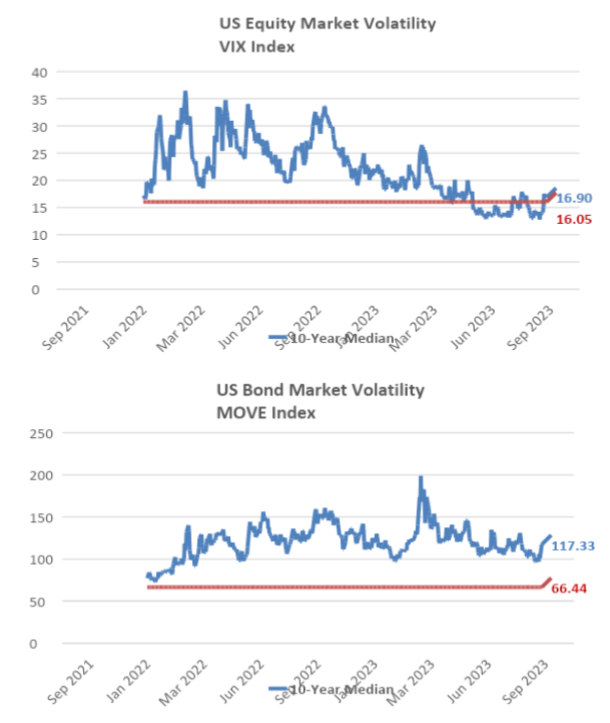
- Uncertainty associated with inflation, monetary policy and economic growth have led to “higher-than-normal” levels of volatility in fixed income and equity markets in 2023.
- Although volatility in fixed income and equity markets declined since the beginning of the year, volatility will likely remain elevated in the short term.
- Factors that will help dampen volatility:
- Greater certainty over monetary policy and, more specifically, a better understanding of when the Fed will pause interest rate hikes.
- Greater certainty that recent declines in inflation will continue.
- Takeaways:
- Market volatility is, by definition, a function of uncertainty.
- Volatility will decline as market participants have more clarity into the future of inflation, monetary policy, economic growth, etc.
2023 Playbook: Equities
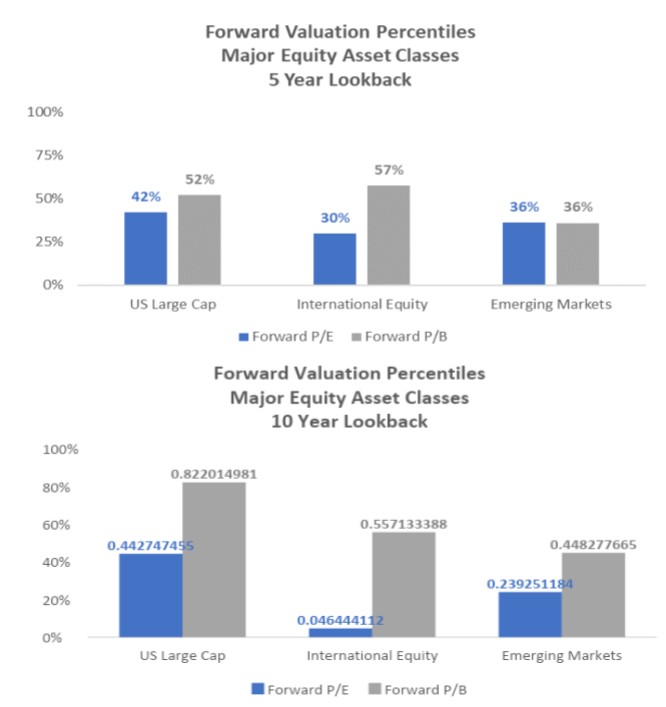
- Fundamental valuation metrics for U.S. Equity, International Equity and Emerging Market Equity suggest that most major equity asset classes are either “fairly priced” or “cheap” on a historical fundamental valuation basis.
- Both U.S. and international EPS ratios have declined as equity markets sold off in the summer of 2023.
- International Equity and Emerging Market equities are more attractive than U.S. Large Cap on a relative valuation basis.
- Scenarios:
- Soft landing
- Global equity prices increase, valuations likely become more expensive in the short term.
- As valuations increase, downside risk for equities increases as well.
- Moderate landing
- Global equity prices trade in a tight range and valuations remain near current levels.
- Stocks are neither cheap nor expensive over the short term.
- Hard landing
- Global equity prices decline materially and valuations become meaningfully cheaper.
- As prices move lower and valuations become cheaper, upside risk for equities increases over the short term.
- Soft landing
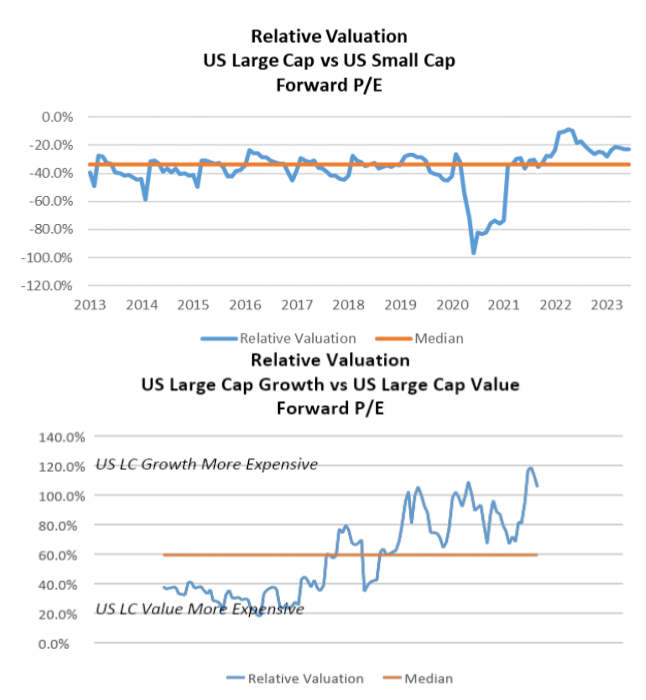
- Given the uncertainty in markets today, assets that are cheap relative to others could get even cheaper (and assets that are expensive relative to others could get more expensive) over the short term.
- U.S. Large Cap equities are slightly more expensive than U.S. Small Cap equities based on relative fundamental valuation metrics.
- U.S. Large Cap Growth equities are meaningfully more expensive than U.S. Large Cap Value equities based on relative fundamental valuation metrics.
- Scenarios:
- Soft landing
- U.S. Small Cap outperforms U.S. Large Cap; U.S. Large Cap Value outperforms U.S. Large Cap Growth.
- U.S. Large Cap becomes less expensive relative to U.S. Small Cap; U.S. Large Cap Growth becomes less expensive relative to U.S. Large Cap Value.
- Moderate landing
- Price appreciation and fundamental valuation differences do not change meaningfully.
- Hard landing
- U.S. Large Cap outperforms U.S. Small Cap; U.S. Large Cap Growth outperforms U.S. Large Cap Value.
- US Large Cap becomes more expensive relative to U.S. Small Cap; U.S. Large Cap Growth becomes more expensive relative to U.S. Large Cap Value.
- Soft landing
2023 Playbook: International Equity
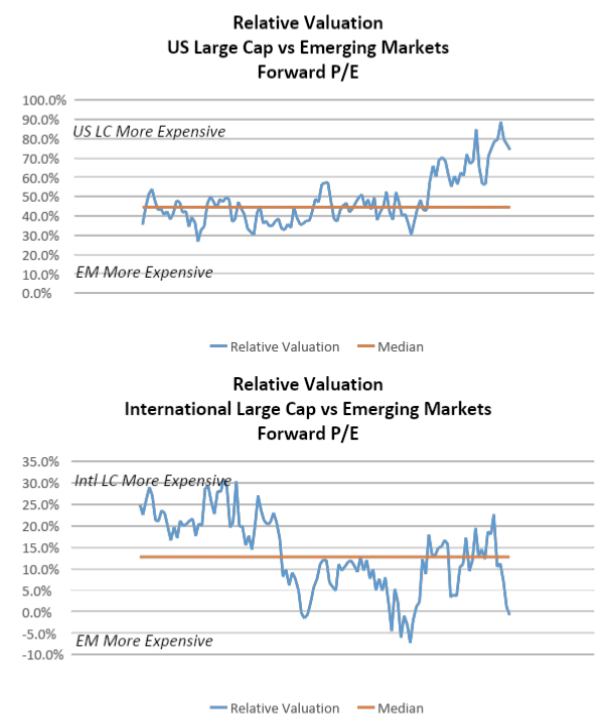
- Given the uncertainty in markets today, assets that are cheap relative to others could get even cheaper (and assets that are expensive relative to others could get more expensive) over the short term.
- U.S. Large Cap equities are slightly more expensive than Emerging Market equities and International Large Cap.
- Emerging Market equities are slightly more expensive than international equities.
- Scenarios:
- Soft landing
- Emerging Markets outperforms U.S. Large Cap; International Large Cap outperforms U.S. Large Cap.
- U.S. Large Cap becomes less expensive compared to Emerging Markets and International Large Cap.
- Moderate landing
- Price appreciation and fundamental valuation differences do not change meaningfully.
- Hard landing
- U.S. Large Cap outperforms Emerging Markets and International Large Cap.
- U.S. Large Cap becomes more expensive relative to Emerging Markets and International Large Cap.
- Soft landing
2023 Playbook: Fixed Income
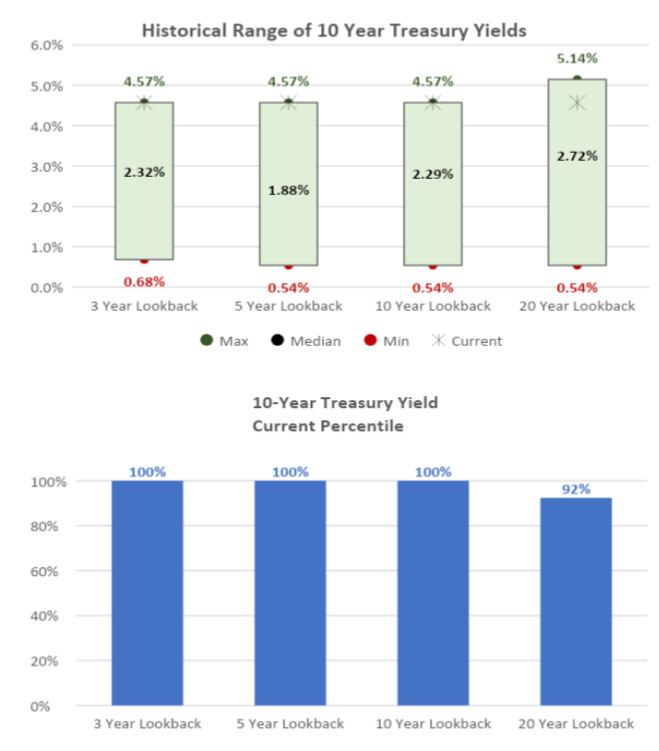
- Long-term treasury yields have increased dramatically over the past two years.
- Longer-dated U.S. Treasury yields surged in the third quarter of 2023.
- The 10-year Treasury yield, for example, is at its highest point in more than 15 years.
- The 10-year Treasury yield is less than 0.5% from its 20-year high.
- Longer-dated U.S. Treasury yields surged in the third quarter of 2023.
- Supply and demand for long-term interest rates is primarily driven by the market’s expectations for economic growth and inflation.
- Expectations for declining inflation and declining economic growth typically push longer-term yields lower.
- Scenarios:
- Soft landing
- Long-term Treasury yields move meaningfully higher as markets price in expectations for higher inflation and better-than-expected economic growth.
- Moderate landing
- Long-term Treasury yields fall slightly as markets price in slightly lower inflation and economic growth.
- Hard landing
- Long-term Treasury yields fall meaningfully as inflation and economic growth expectations decline materially.
- Soft landing
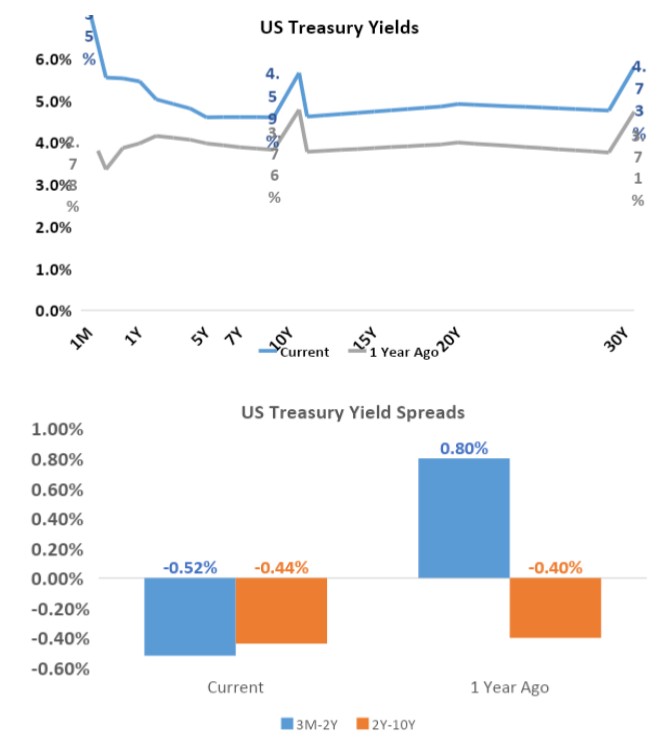
- Key sections of the U.S. Treasury yield curve have been inverted since mid-summer of 2022.
- Yield curve inversion occurs when short-term rates are higher than long-term rates.
- Yield curve inversion has historically led to disruptions in borrowing and lending activity that result in meaningful declines in economic activity.
- The longer a yield curve inversion persists (and the larger the inversion), the more likely lending and borrowing activity will decline meaningfully.
- Scenarios:
- Soft landing
- Yield curve inversion persists into 2025.
- Short-duration, high-quality fixed income outperforms long-duration, high-quality fixed income.
- Moderate landing
- Yield curve inversion continues into mid/late 2024.
- Long-duration, high-quality fixed income outperforms short-duration, high-quality fixed income at the margin.
- Hard landing
- Yield curve inversion is no longer present by the middle of 2024.
- Long-duration, high-quality fixed income materially outperforms short-duration, high-quality fixed income.
- Soft landing
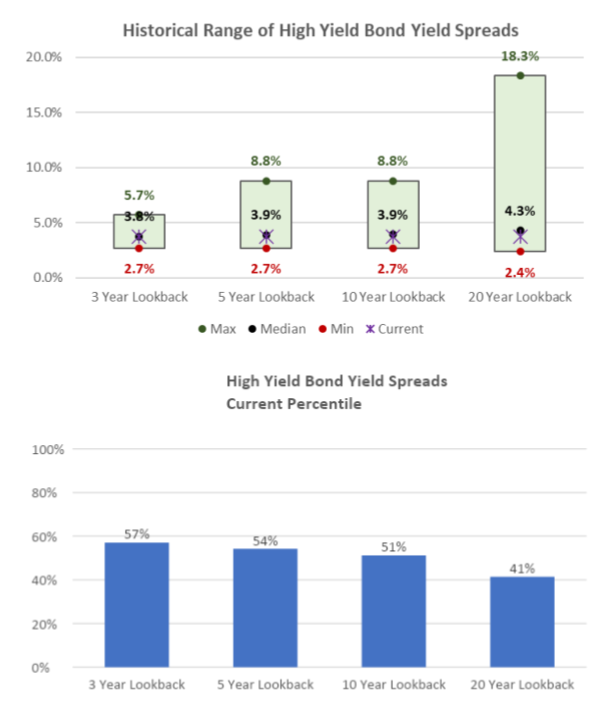
- The difference between corporate bond yields and Treasury yields (credit spreads) remains near long-term averages.
- High Yield credit is neither “cheap” nor “expensive” on a fundamental basis.
- That said, credit spreads are not yet pricing in a slowdown in economic growth and could increase substantially should the U.S. enter a period of economic contraction.
- Scenarios:
- Soft landing
- Credit spreads remain very low as expectations for economic growth improve.
- Low-quality credit outperforms high-quality credit as investor willingness to take risk remains high.
- Moderate landing
- Credit spreads increase moderately as economic growth slows.
- Higher-quality credit outperforms lower-quality credit at the margin.
- Hard landing
- Credit spreads increase substantially as expectations for economic growth decline materially.
- Higher-quality credit outperforms lower-quality credit by a wide margin.
- Soft landing
A Note About Equity Market Selloffs
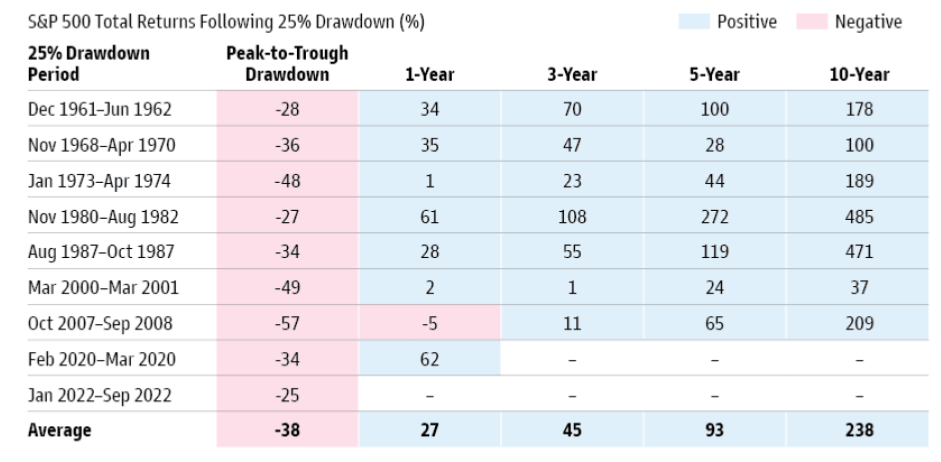
- Long-term investors should remember that equity market selloffs are often followed by periods of above-normal returns.
- Investors that try to “time” market selloffs (i.e., sell stocks ahead of a market decline) usually fail to reinvest prior to the subsequent stock market recovery.
- Takeaways:
- Long-term investors should never attempt to time the market.
- Riding out market volatility is the best way to build wealth over the long term.
2023 Playbook Summary
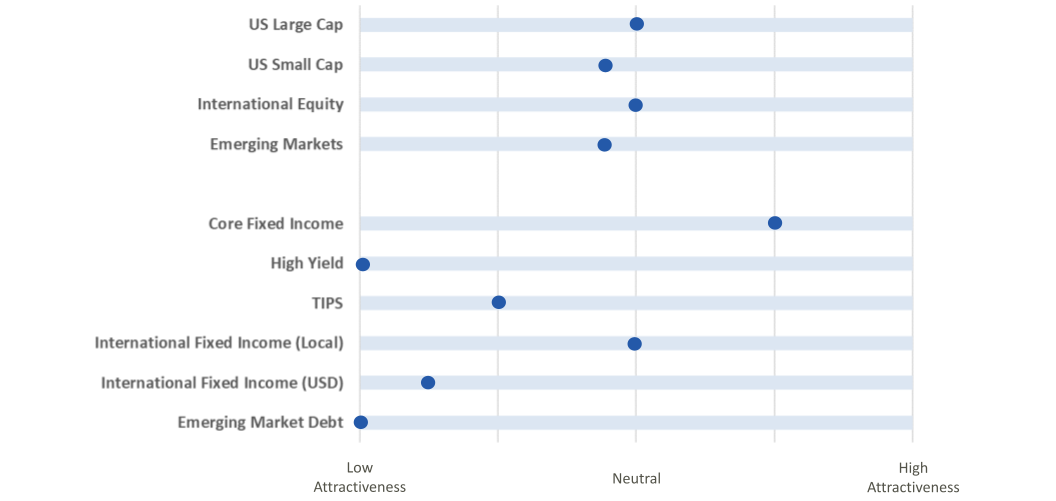
- The above table indicates where each major investment asset class falls on the distribution of attractiveness (from low to high). This table is meant to provide a standardized and comparable view of the level of opportunity in each asset class category.
- In subsequent quarters, we will discuss any movement along the scale for each asset class and the driving forces behind the change in outlook.

