Inflation Update | June 2021
2021 Theme: Above Trend Economic Growth
- Due to the progress of vaccinations and the potential release of pent-up demand, a surge of economic activity is expected in the second half of 2021.
- In 2021, the US is likely to have its highest level of economic activity in decades.
- Improvements in growth expectations, unprecedented levels of fiscal and monetary stimulus, and supply chain shortages have created price pressures that have accelerated in 2021.
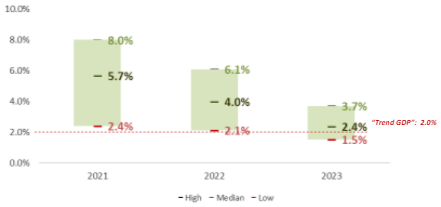
US GDP Growth Projections
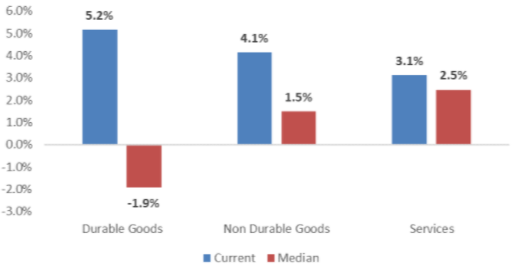
Service Inflation and Goods Inflation
- Reasons for price inflation:
- “Base Effects”: Recent inflation readings incorporate depressed price levels from the economic shutdown in Spring 2020.
- Strong demand for goods as a result of monetary and fiscal stimulus.
- Short supply due to labor and production shortages that resulted from shutdowns and government policy.
- Prices for goods, which tend to be more volatile than services, have increased substantially over the past year.
- Durable goods prices (automobiles, appliances, etc.) have increased by more than 5% over the past year.
- Non-durable goods inflation (clothing, household products) have increased by more than 4% over the past year.
- Prices for services have increased over the past year as well, but not to the same extent as prices for goods.
- In the months ahead, goods inflation is likely to soften while services inflation is likely to accelerate.
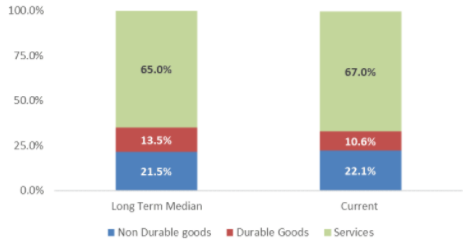
Consumption on Goods and Services
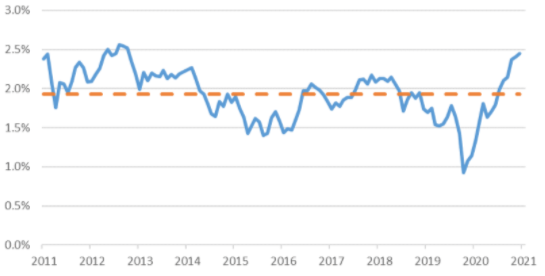
Current Inflation vs. Long-Term Trend
The Federal Reserve’s Dual Mandate
- The Fed uses its monetary policies to achieve its dual mandate of:
- Full employment
- Price stability
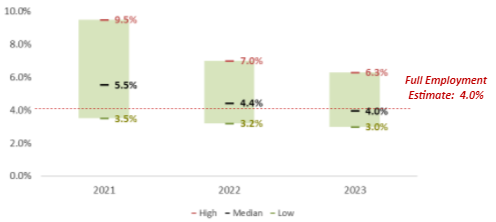
- Monetary policy is likely to remain very accommodative until unemployment reaches 4% and long-term inflation trends near 2%.
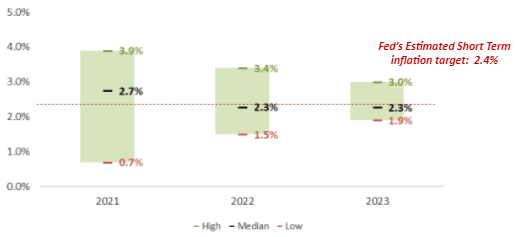
- Over the short term, the Fed’s target for inflation will be closer to 2.5% to make up for low inflation that occurred since the financial crisis.
Takeaways:
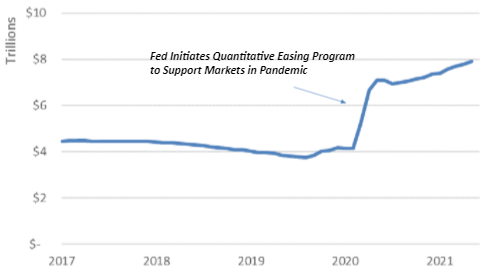
- The Fed may begin to unwind its quantitative easing program as inflation ticks higher and unemployment improves.
- The Fed is unlikely to increase its policy rate until inflation and unemployment levels reach the Fed’s target.
US Unemployment Rate Projections
Range of US Inflation Projections
The Federal Reserve’s Order of Operations
- To reduce inflationary pressures in the economy, the Fed will begin to tighten its monetary policy.
- The first step the Fed will take to tighten monetary policy will be to “unwind” its quantitative easing program.
- The Fed may discuss its plans during the Jackson Hole Conference in August 2021.
- If current trends in unemployment and inflation continue, it is likely that bond purchases begin to slow in late 2021 or early 2022.
- The second step in tightening monetary policy will be for the Fed to raise its short-term policy rate.
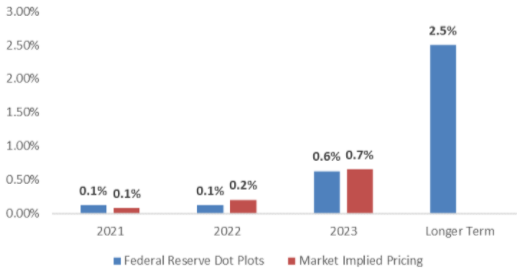
- The Fed announced plans to begin raising short-term interest rates in 2023.
- This announcement was an acceleration of the Fed’s original plan to begin raising interest rates in 2024.
- The Fed announced plans to begin raising short-term interest rates in 2023.
Projected Fed Funds Rate Target
Federal Reserve Assets
The Base Case: "Transitory" Inflation
- The “Base Case” for inflation:
- Price pressures will likely be “transitory,” or short term, in nature.
- Recent trends that are disinflationary in nature:
- Consumers are beginning to delay purchases due to recent price increases.
- Commodity markets are pricing in “disinflation” over the next twelve months.
- Treasury yields suggest that inflationary pressure will not be a long-term phenomenon.
- Tax reform is likely to lead to higher corporate income taxes (and higher income and capital gains taxes for individuals earning more than $1M a year).
- Most US states plan to let emergency unemployment benefits expire before September 2021.
- What to look for in the months ahead:
- Goods should experience disinflation in the months ahead as supply catches up with demand.
- The price of many services will likely increase in the months ahead as the economy begins to “normalize.”
- The longer wage inflation increases, the more likely inflationary pressure will persist.
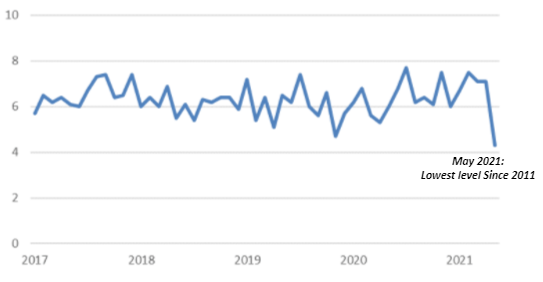
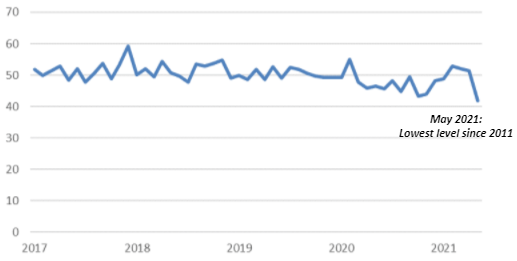
Consumers Are Beginning to Change Spending Plans
Plans to Buy a Home Index
Plans to Buy Appliances Index
Plans to Buy a Car Index
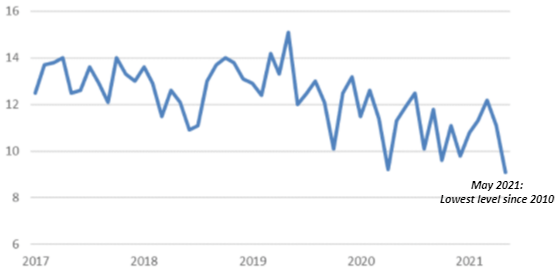
- The results of recent surveys imply that consumers are beginning to delay their plans to purchase large ticket items.
- Plans to buy a car, a home or appliances have fallen to levels not seen in more than a decade.
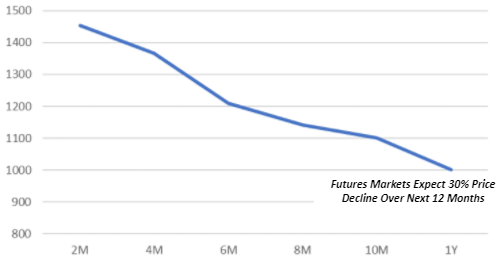
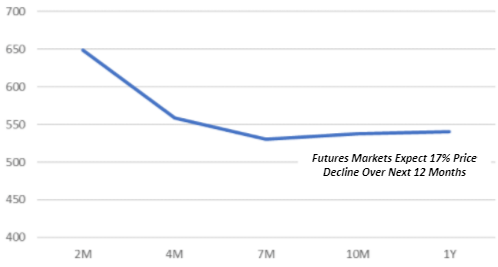
Commodity Markets Expect Supply Shortages to Abate
Lumber Futures
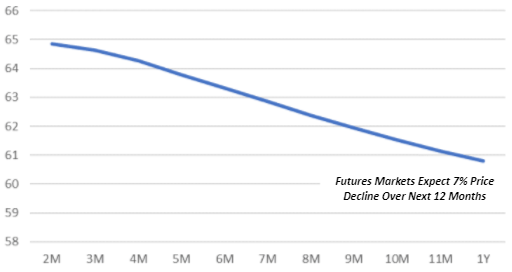
Corn Futures
Crude Oil Futures
Steel Futures
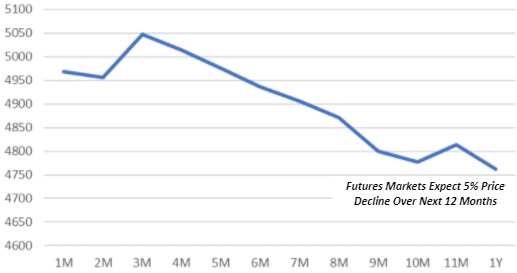
Most commodities are in “backwardation,” a scenario whereby future prices are expected to be lower than current prices.
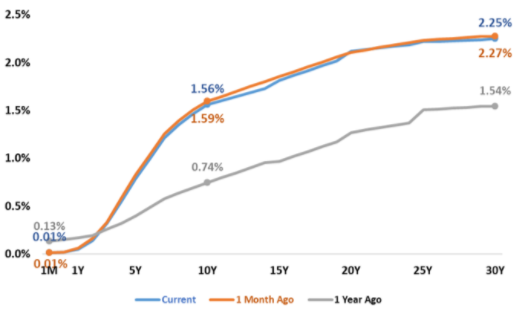
Bond Markets Are Expecting “Transitory” Inflation
- The Treasury yield curve has steepened since the beginning of the year, which would suggest that investors anticipate higher growth and inflation in the years ahead.
- Despite the steepening curve, however, Treasury yields have fallen in recent weeks—even as high inflation measures have been published.
- Treasury markets are currently pricing in moderate inflation over the next 5-10 years.
- 5-year inflation breakeven: 2.5%
- 10-year inflation breakeven: 2.4%
US Treasury Yields
10 Year Inflation Breakevens