
Capital Markets Playbook | Q3 2025

2025 Q2 Summary
- Despite poor performance in Q1, and a volatile start to Q2, global equity markets posted strong gains for the first half of 2025.
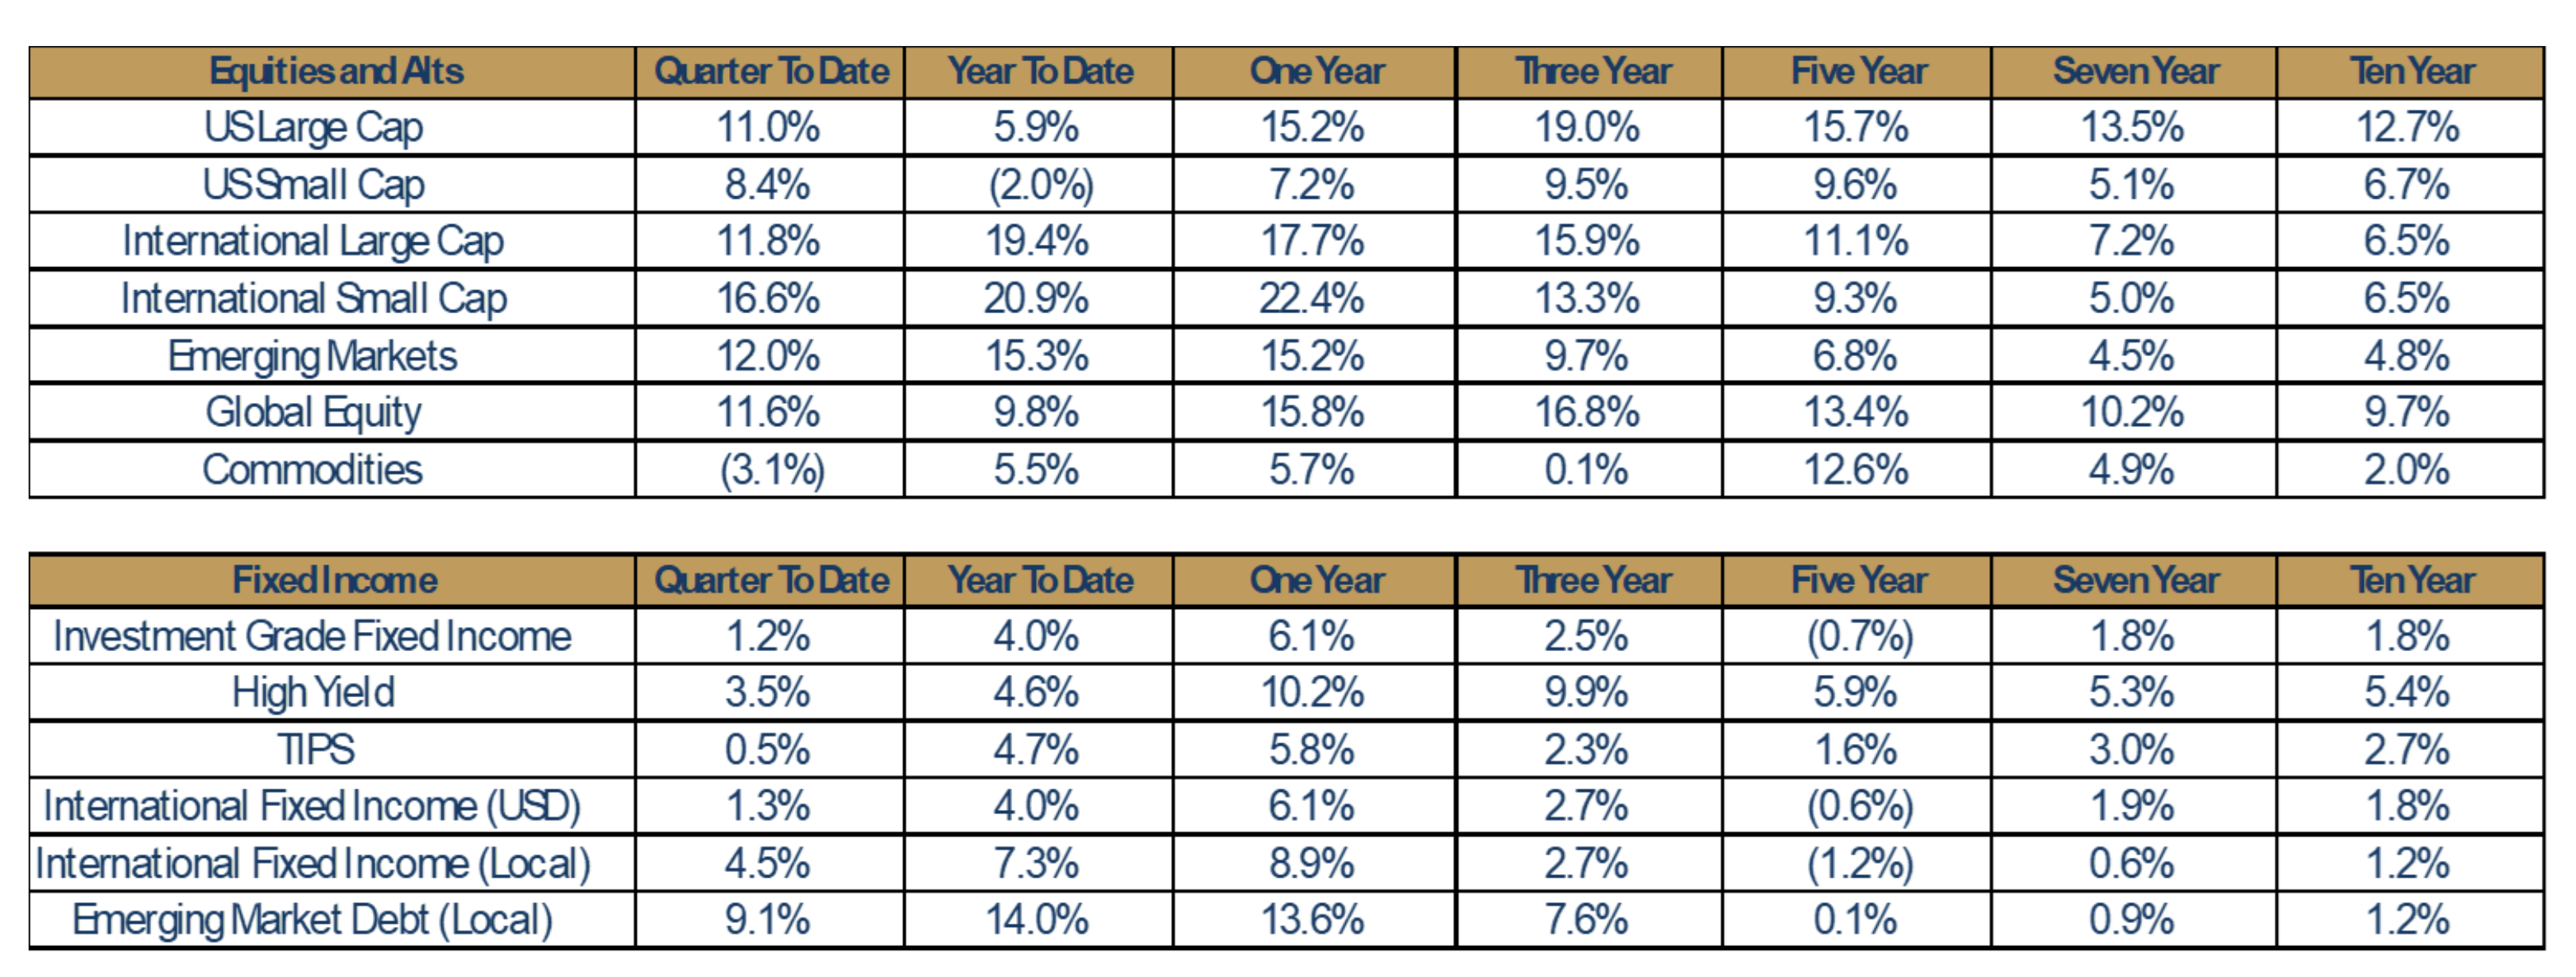
- Major U.S. Large Cap stock indices posted double digit gains in Q2 (+11.0%) and finished at, or near, all-time highs. Despite the strong Q2 performance, however, U.S. Large Cap stocks underperformed Global Equities by about 4% in the first half of 2025.
- U.S. Small Cap stocks also posted strong gains in Q2 (+8.4%). Despite the recent strength, however, U.S. Small Cap stocks underperformed Global Equities by about 12% in the first half of the year.
- International and emerging market equities (EMs) outperformed U.S. stocks for the second consecutive quarter in Q2. International stocks have outperformed global equities by about 10% year-to-date, while EMs outperformed by about 5%.
- Broad based fixed income markets were positive in the second quarter of 2025.
- High Yield was the best performing fixed income asset class in Q2 and has outperformed Investment Grade Fixed Income year-to-date.
- U.S. dollar weakness led to outperformance in local currency fixed income asset classes.
2025 Q2: In Review
Update on Tariffs and Trade Deals
- The July 9 deadline for the 90-day pause on reciprocal tariffs was recently moved back to August 1. In early July, the Trump Administration announced higher tariffs on several countries, some at Liberation Day levels.
- Elsewhere, ongoing negotiations with the likes of Canada, Mexico, the European Union and India, among others, are said to be progressing, although how far along trade talks stand and degree of tension vary considerably among each relationship. The market, however, is expecting the vast majority of deals to be in place, in some form, ahead of the new August 1 deadline.
- The UK was the first country to agree in principle to a deal with the U.S. for lower tariffs, and while the deal has yet to be finalized, it is rumored to be completed “very soon.” Under terms of the “Economic Prosperity Deal,” the U.S. removes 25% steel and aluminum tariffs for the UK and reduces car import duties from 25% to 10% on the first 100,000 units imported annually. The UK in return removes tariffs on U.S. agriculture items, including beef and ethanol, but more than 2,000 products are included in tariff reductions, which is said to have bilateral benefits in trading volume.
- Probably the largest and most important trade talks have centered around China. In early June, the U.S. and China agreed to the “framework” of a deal, with a target deadline of mid-August. The details are still being ironed out, but preliminary reports indicate the deal has significant emphasis on the U.S. receiving rare-earth minerals from China, which are critical for U.S. electronics and defense industries, in return for the U.S. easing export restrictions on semiconductor chips and access to Chinese student visas. The U.S. will maintain 55% total tariffs on Chinese imports (30% baseline + 25% Section 301/ fentanyl-related measures), while China will enforce a 10% tariff on U.S. goods.
- Vietnam and U.S. struck a deal on July 2, opening up Vietnam’s market completely to U.S. goods with 0% tariffs. The parties agreed to 20% tariffs on Vietnamese goods shipped directly to the U.S. and 40% on any “transshipping” goods, or those re-routed through Vietnam (mostly from China), lower than the 46% original tariff proposed on Trump’s Liberation Day.
- Takeaways
- The fact of the matter remains that the magnitude and timing of any final trade agreements remain to be seen, and volatility may increase as deadlines draw near.
- The impact of tariffs on U.S. consumer prices has been muted to this point. Assuming a major escalation in trade protectionism does not occur, inflationary impacts from tariffs are expected to be short term and moderate in nature.
2025 Q2 Macroeconomic Review
- Economic Growth
- Following a GDP print of (-0.5%) in Q1, economic growth in Q2 is expected to be around 2.5-3.0%. Significant changes in GDP growth over such a short time frame is not normal. In this case, much of the economic weakness reported for Q1 was due to “tariff frontrunning” that largely reversed in Q2 once baseline tariffs were implemented.
- Consumer Spending
- Consumer spending growth has held up so far in 2025, but the growth rate has been decelerating.
- Data is not yet available, but most expect U.S. consumer spending growth for the second quarter to fall below the longer-term trend growth rate of about 2.5%.
- Continued lack of clarity around tariffs and trade policy could cause consumer spending to contract in future quarters.
- Unemployment
- Unemployment, currently at 4.1%, remains at levels well below the long-term average as the labor market continues to be more resilient than many had feared a few months ago.
- Cuts to federal workers and immigration reform have not yet resulted in an uptick in unemployment levels.
- Inflation
- The inflationary impact of tariffs has yet to be fully reflected across the aggregate U.S. economy. In fact, Core CPI has declined by 0.4% in 2025 (annualized Core CPI was 2.8% in the month of May).
- Most economists expect a moderate, temporary uptick in inflation in the months ahead as tariffs continue to filter into the aggregate economy. That said, assuming that new trade deals are announced soon, the prospects of a significant increase in inflation is rather remote.
- Interest Rates and Monetary Policy
- The Federal Reserve kept interest rates steady at 4.25-4.50%, citing a strong economy and low unemployment.
- Markets currently expect that the Fed may cut short-term interest rates by 25 to 50 bps by the end of 2025. That said, if the labor market continues to show strength in the months ahead (and inflation does not decline), it is possible that the Fed decides to keep rates as they are for the full calendar year.
- Geopolitical Risk
- The recent escalation of conflict between Israel and Iran has had limited impact on energy markets so far. Although this dynamic may change, markets believe that any energy shortages that result from future escalations would be made up from other energy producing countries (including the U.S.).
- 2025 Q2 Equity Market Review
- Markets took investors on an up-and-down ride, with notable swings coming amid uncertainty about the impact of tariffs on the U.S. and global economy.
- Broad-based U.S. equity markets briefly tested bear market territory early in the quarter, only to regain and end the quarter near all-time highs.
- While domestic and international equities initially tracked one another, a steep dollar decline beginning in February amplified returns for international equities. International equities now sit near the top percentile of rolling six-month returns over the last 30 years, highlighting the historical magnitude of this divergence.
- Emerging market equities were up double digits during the quarter, also benefiting from the weak dollar.
- 2025 Q2 Fixed Income Market Review
- Despite pockets of policy driven volatility, domestic fixed income has fared well year-to-date, buoyed by stable rates and a relatively unchanged short-term inflation outlook.
- High Yield outperformed Investment Grade Fixed Income in Q2 by more than 2%. In Q2, High Yield benefited from the same “risk on” sentiment seen in Global Equity markets.
- Thanks to meaningful weakening of the U.S. dollar this year, international fixed income (local currency) has posted very strong returns in the first two quarters of 2025. The first six months of returns (+7.3%) is one of the highest six-month returns for the asset class in nearly three decades.

- The weakening U.S. dollar has provided a significant tailwind for domestic investors, amplifying their returns in international markets.
- The U.S. Dollar Index (DXY) has recorded its sharpest first half decline in nearly 40 years, contributing to a notable divergence in year-to-date asset class performance.
- International equities and bonds each notched returns in the top decile of rolling three-month returns over the past 30 years, largely due to declines in the U.S. dollar. Stripping out the effect of dollar weakening, international equity returns on a year-to-date basis would be nearly 10% lower.
- While interest rate differentials and inflation typically influence currency movements, recent dollar weakness appears more closely tied to concerns over U.S. fiscal sustainability and growing uncertainty around trade policy. Heavy deficit spending, debt overhang and geopolitical friction may have obscured traditional currency supports, weakening demand for the dollar and amplifying foreign asset returns through currency translation.
Israel & Iran Conflict – Economic Impacts
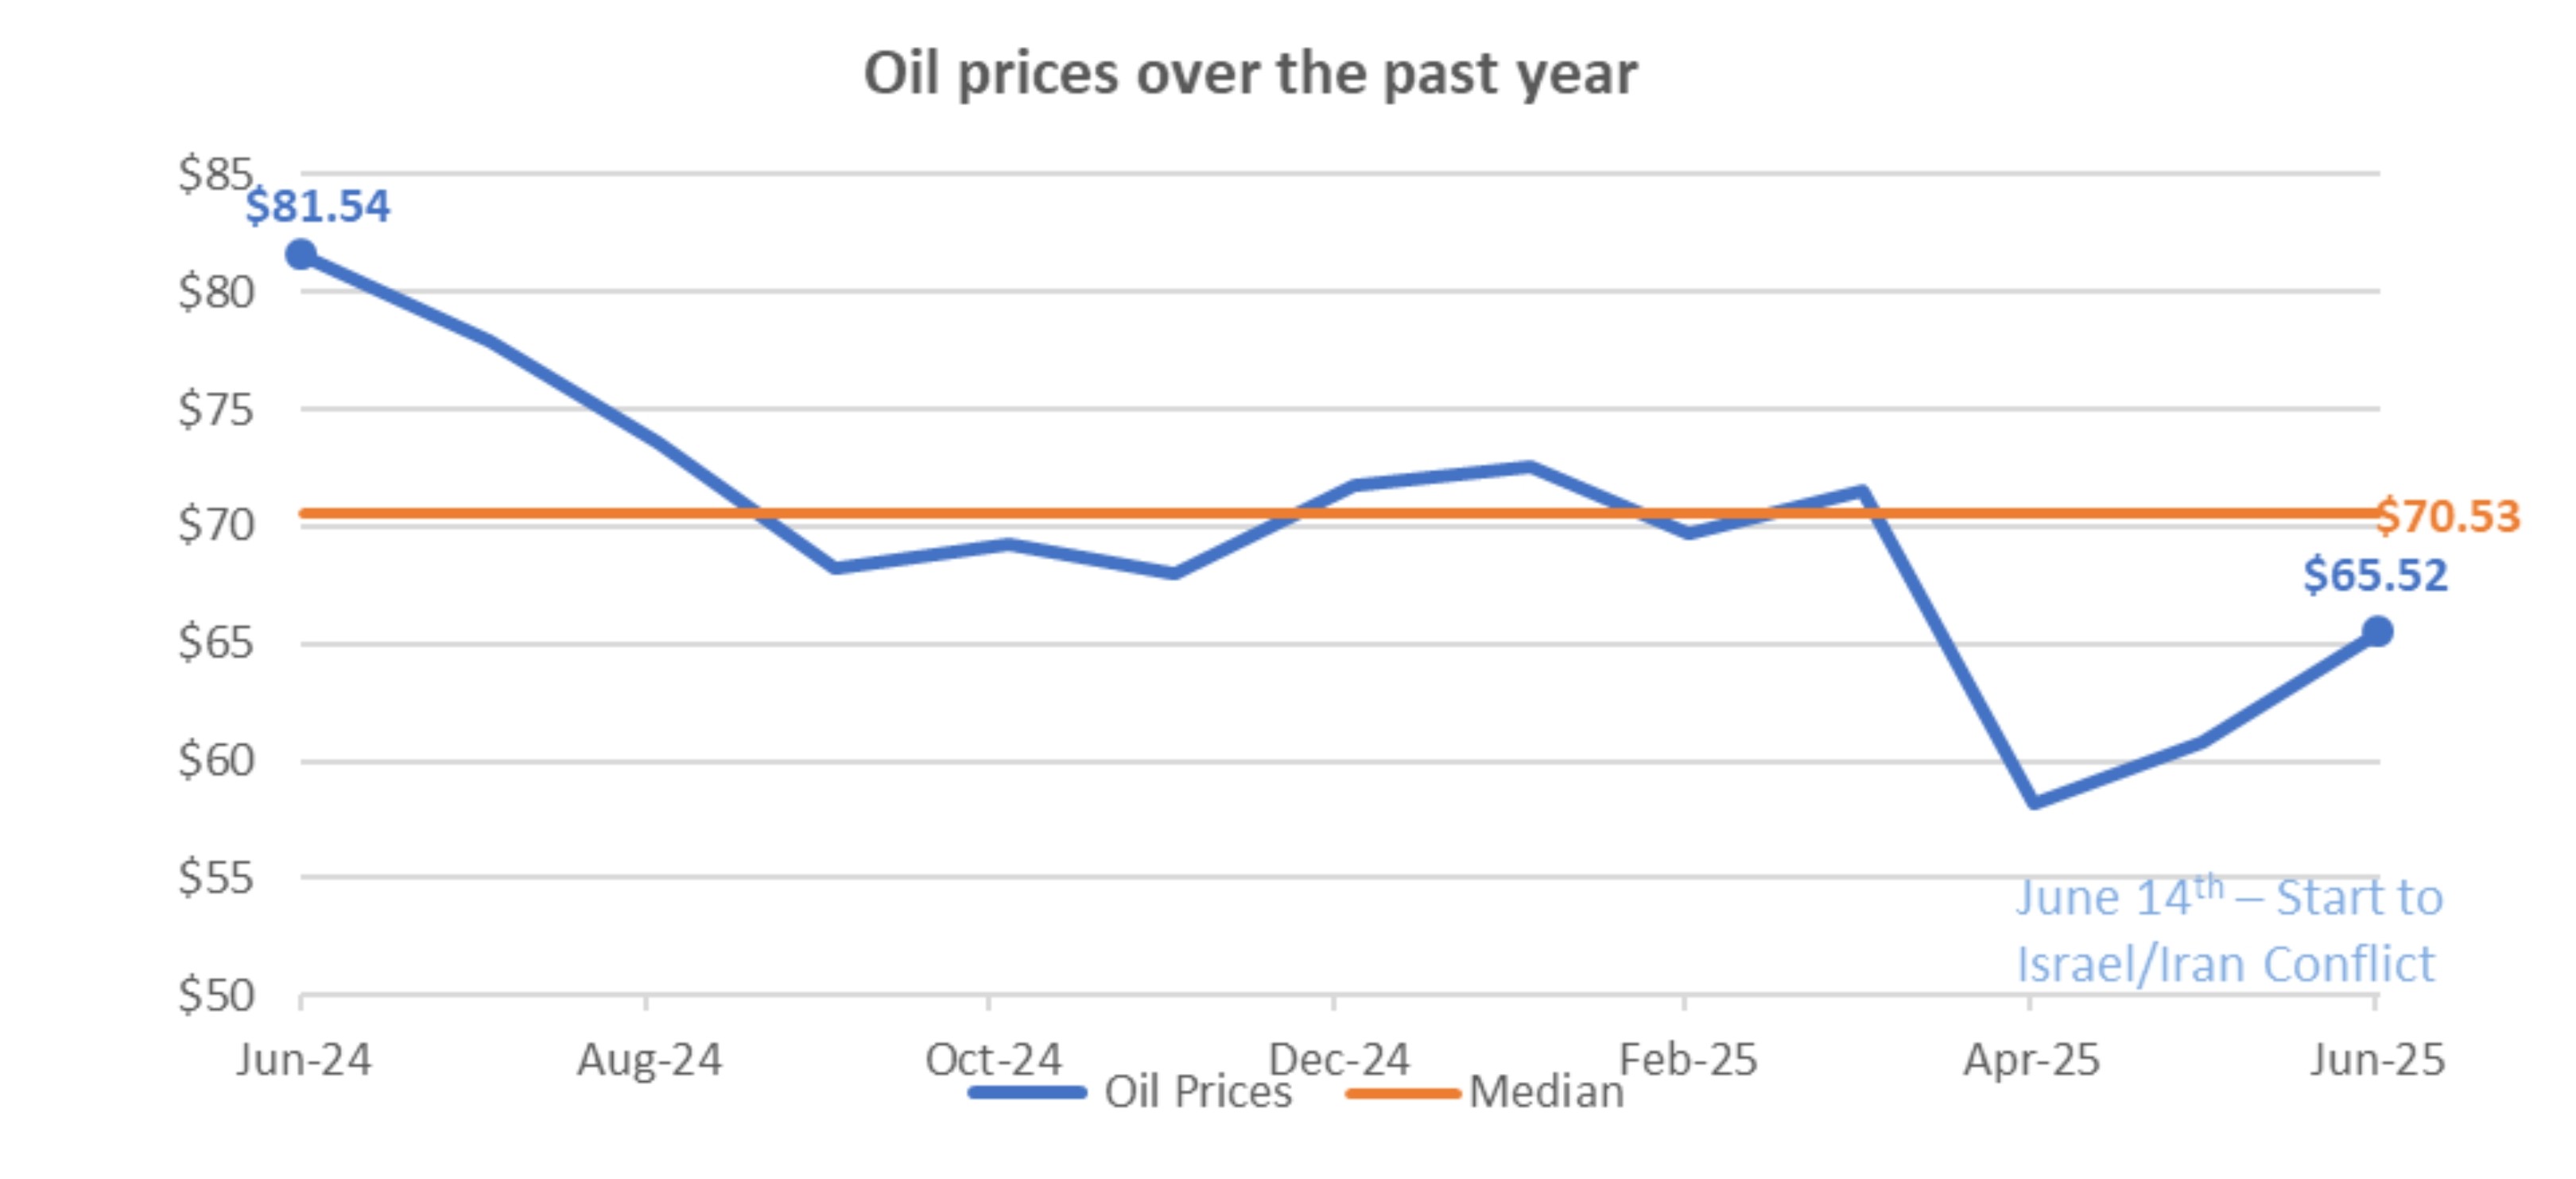
- The current conflict between Israel and Iran does not appear to be having an outsized impact on equity markets or energy prices.
- Oil prices are down almost 20% from one year ago despite the ongoing conflict.
- Futures markets show that market participants expect oil prices to decline over the next couple of quarters.
- If an oil supply shock results from the conflict, other oil producing nations will bring more production online and supply will return to equilibrium rather quickly.
- Takeaway
- The conflict between Israel and Iran is not expected to create oil supply shortages that lead to materially higher energy prices.
2025: Macroeconomic Expectations
- Unemployment “Base Case”
- Unemployment is expected to tick slightly higher over the next six months but remain relatively low by the end of the year.
- Unemployment, currently at 4.1%, may increase to around 4.3% by the end of 2025.
- Unemployment is expected to tick slightly higher over the next six months but remain relatively low by the end of the year.
- Inflation “Base Case”
- Inflation is expected to increase slightly as impacts from tariffs flow through the economy, keeping inflation levels above the Fed’s 2% target in 2025.
- Personal Consumption Expenditure (PCE) inflation – the Fed’s preferred measure of inflation – is expected to increase from 2.8% to about 3.1% by the end of 2025.
- Inflation is expected to increase slightly as impacts from tariffs flow through the economy, keeping inflation levels above the Fed’s 2% target in 2025.
- Interest Rates “Base Case”
- The slope of the U.S. Treasury yield curve may steepen in the second half of 2025.
- Short-term interest rates may be cut by 25 to 50 bps before the end of 2025 as the Fed restarts its monetary policy normalization effort.
- Intermediate and long-term interest rates may move higher in 2025 as markets weigh concerns over U.S. debt and deficits.
- The slope of the U.S. Treasury yield curve may steepen in the second half of 2025.
- Risks to “Base Case” Expectations
- Unemployment risks
- Businesses that have avoided job cuts in 2025 due to a “wait and see” approach to policy matters may determine that they cannot wait any longer to cut costs.
- Immigration reform could create a significant increase in unemployment across selected industries and push the aggregate unemployment rate near 5%.
- Inflation risks
- Tariffs on imported goods could push inflation higher, particularly if there are “tit-for-tat” tariffs between the U.S. and its trading partners.
- Interest rate risks
- Mounting concerns over U.S. debt and deficits could lead investors to demand higher yields (even if inflation is moving lower).
- Unemployment risks
- Takeaway
- Slightly higher unemployment, sticky inflation and restrictive short-term interest rates will make it challenging for the U.S. economy to grow at (or above) its long-term trend rate in 2025.
2025 Expectations: Economic Growth
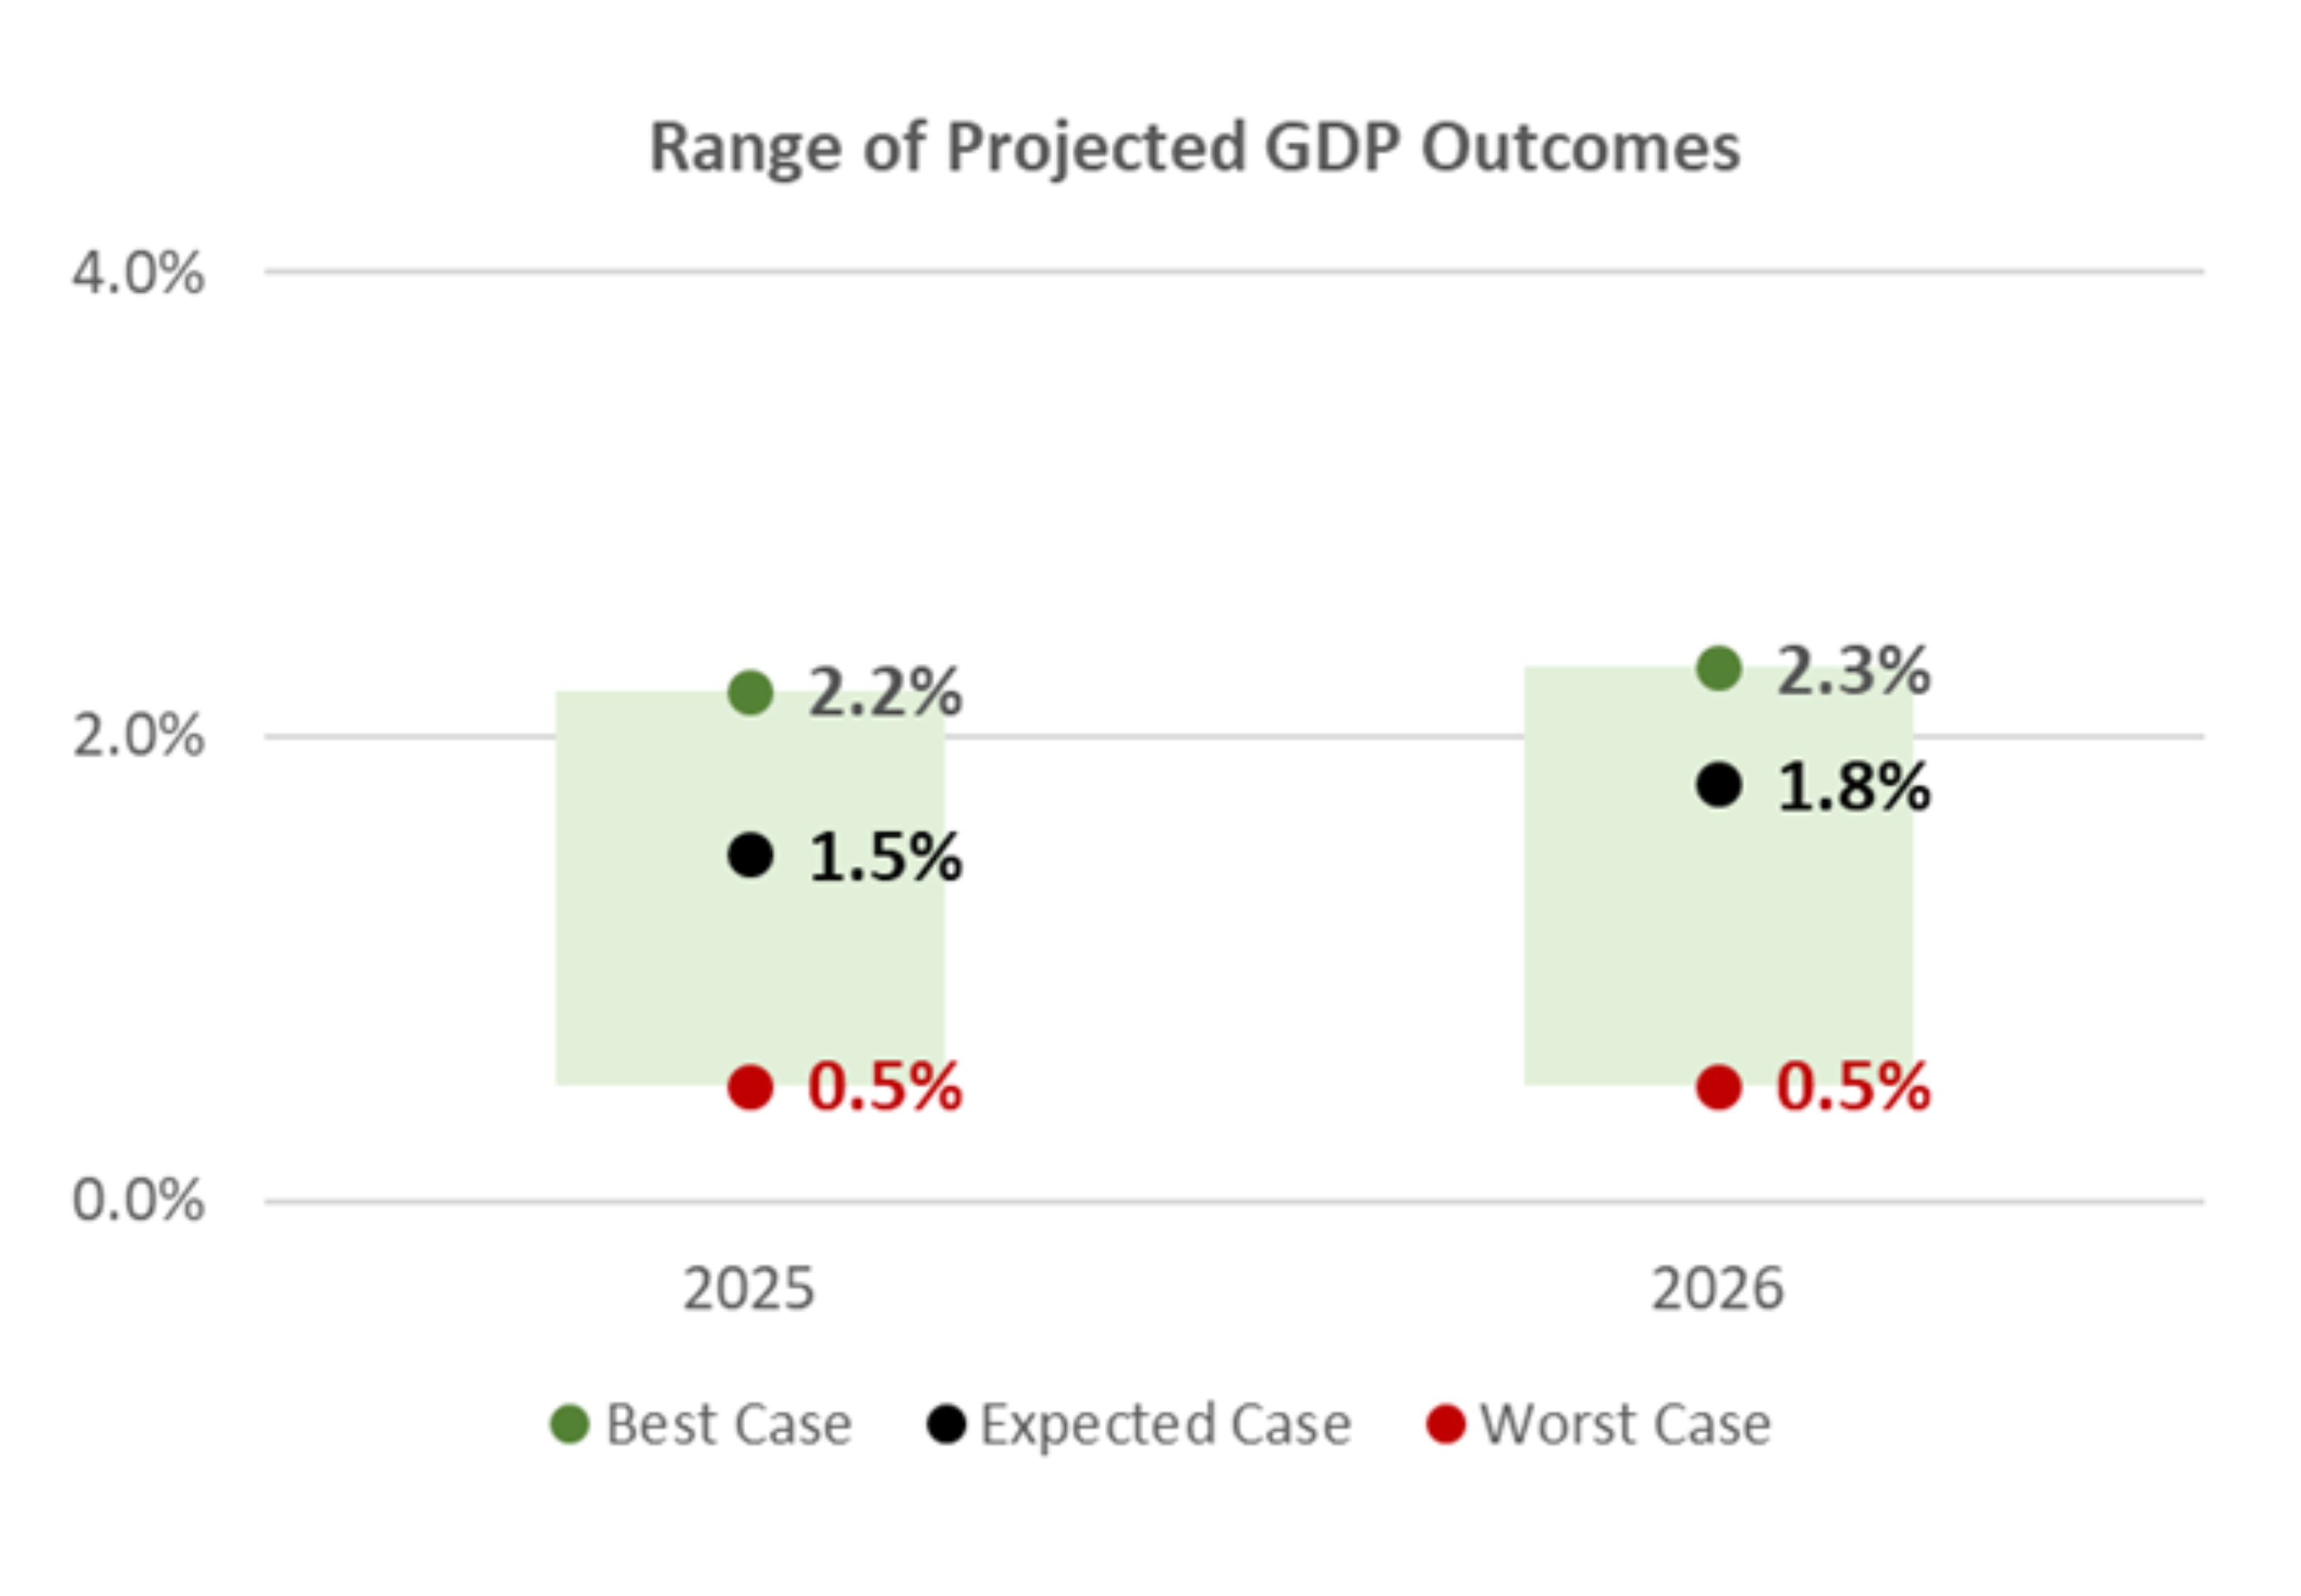
- 2025 U.S. economic growth is expected to slow throughout the remainder of 2025. A small improvement to U.S. economic growth is expected in 2026.
- GDP growth for 2025 and 2026 is expected to come in below the long-term GDP trend rate of 2.1%.
- While a small improvement to economic growth is expected in 2026, most expect GDP to fall short of its long-term trend growth rate.
- Despite expectations for slower economic growth, however, few expect an economic recession before the end of 2026.
- Scenarios
- Best Case
- Economic activity in the U.S. is slightly above its long-term trend rate over the next two years.
- Expected Case
- Economic activity in the U.S. is about 0.5% below its long-term growth rate over the next two years.
- Worst Case
- Economic activity is about 1.5% below its long-term trend rate over the next two years.
- Best Case
2025 Expectations: Unemployment
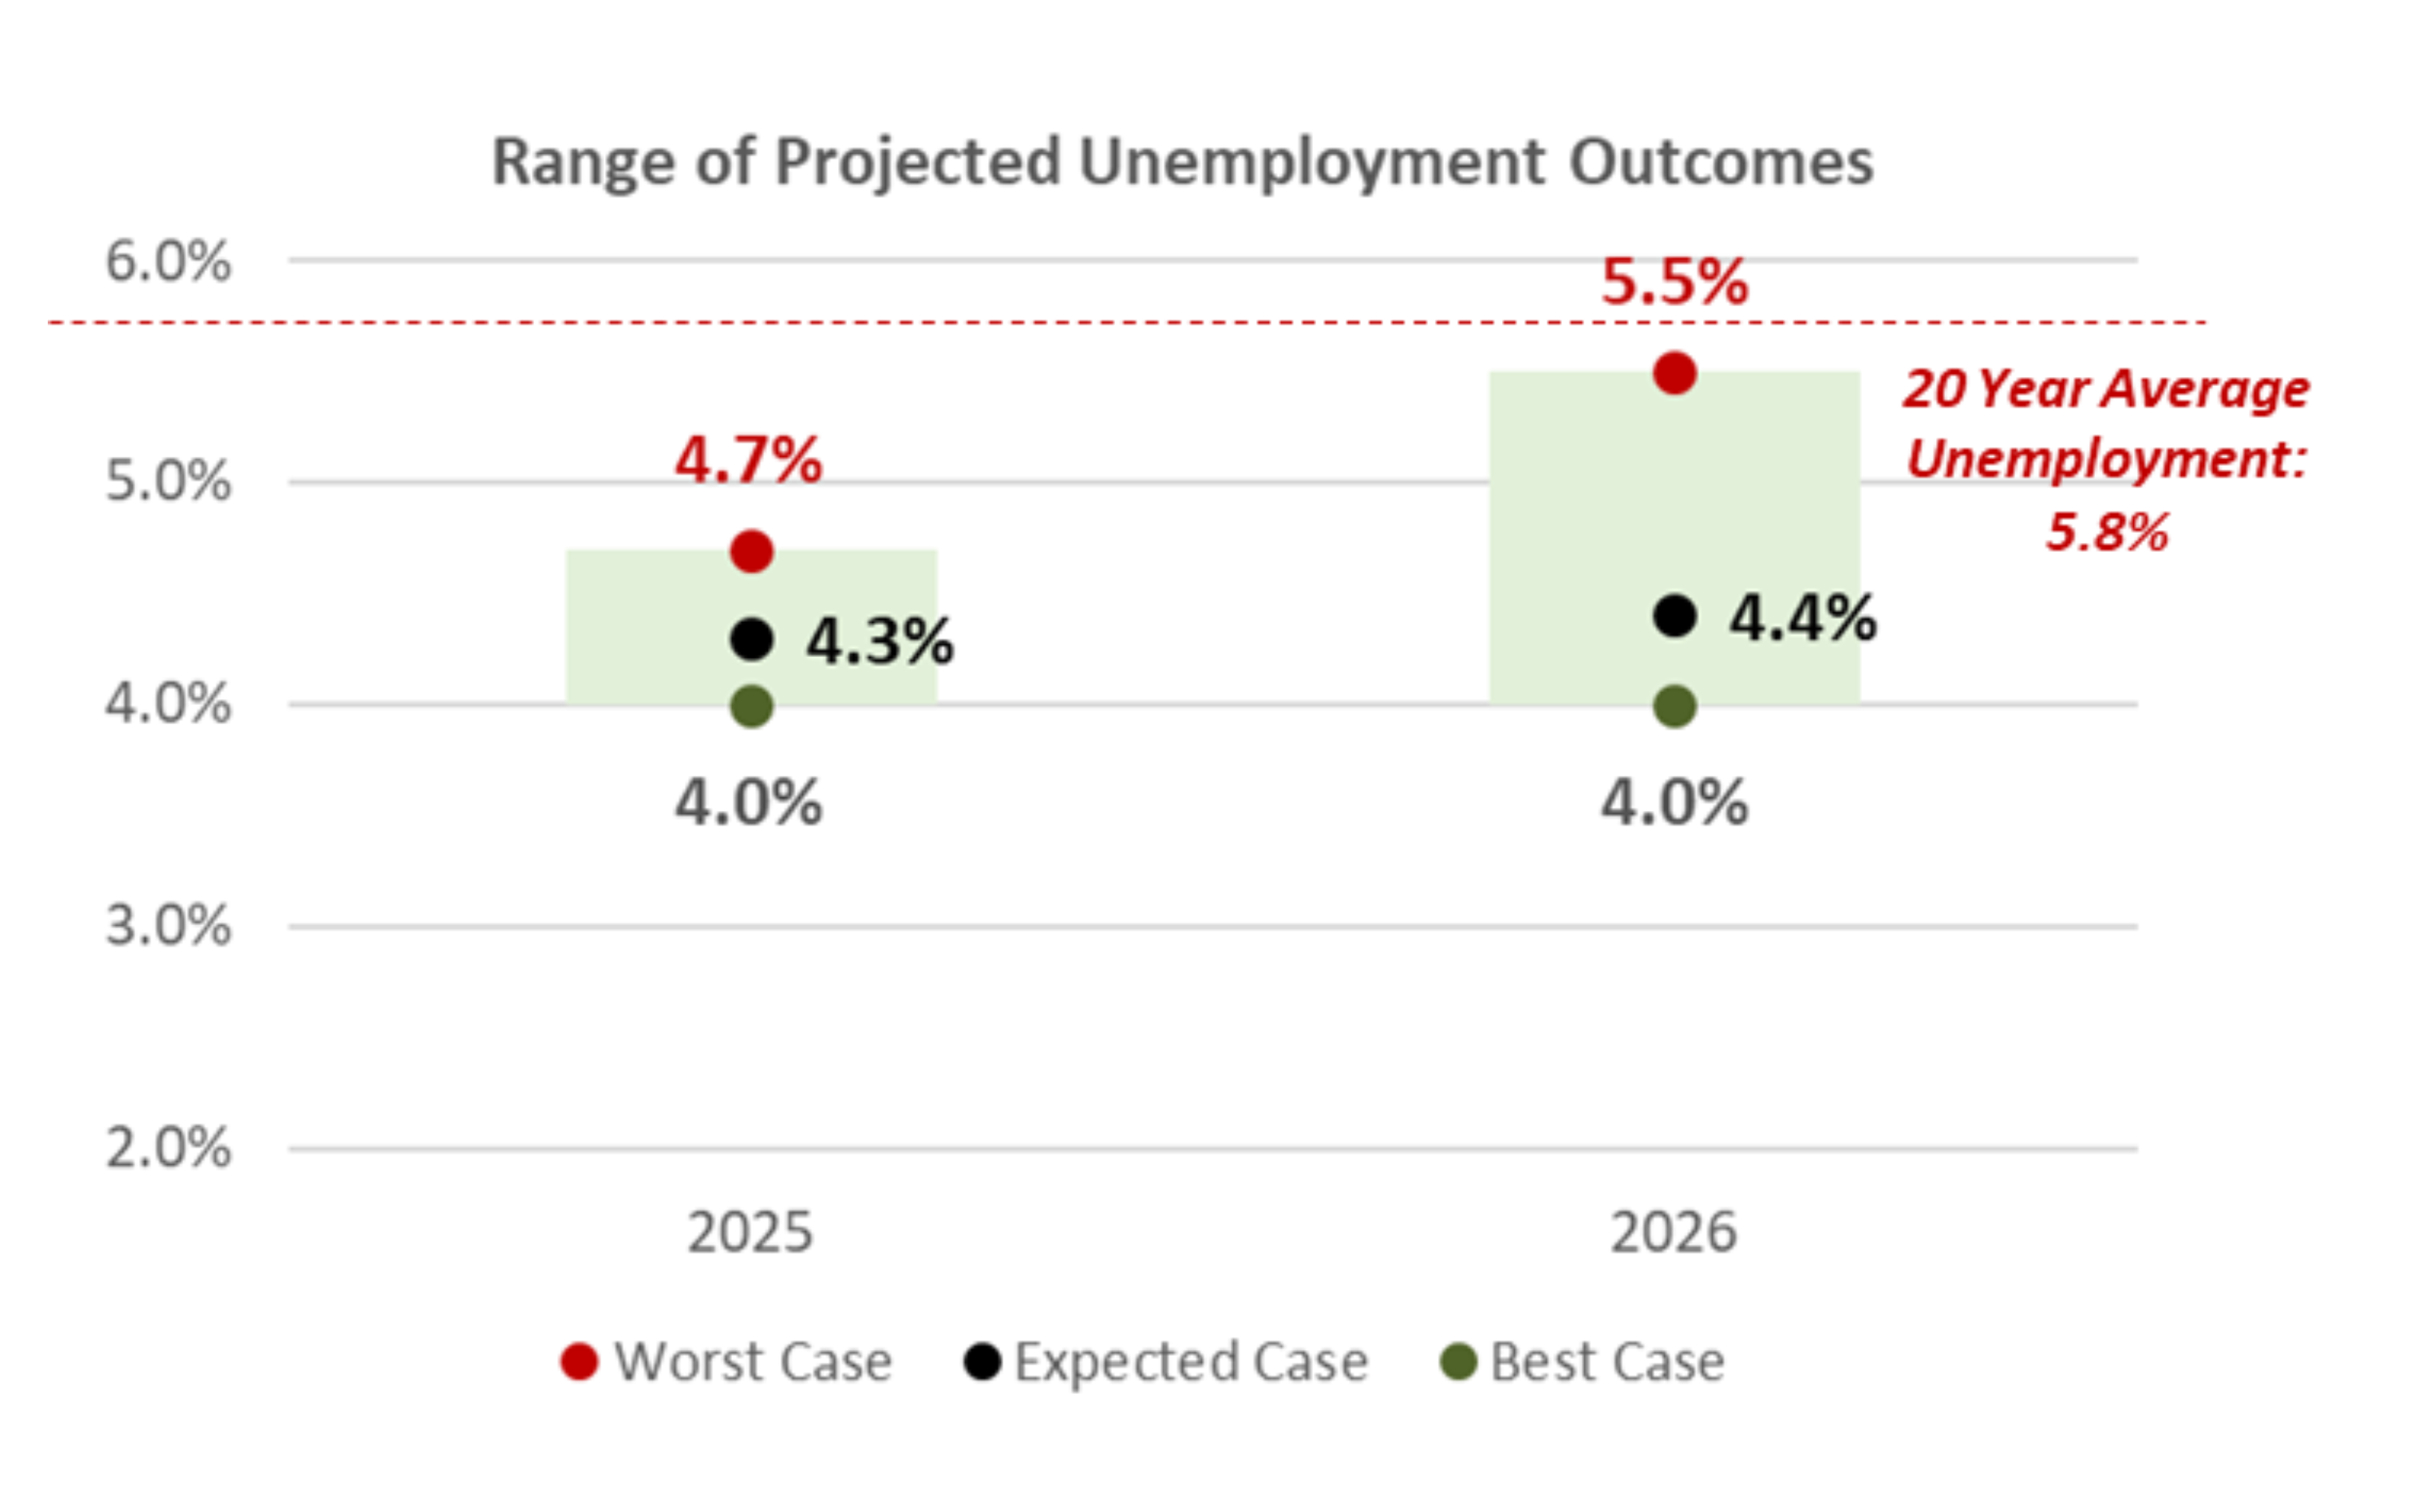
- Unemployment in the U.S., currently at 4.1%, is expected to remain well below its long-term average through the end of 2026.
- Unemployment is expected to tick higher in the second half of 2025 but remain low by historical standards.
- And while few expect unemployment to increase meaningfully in 2026, the risk of a meaningful spike in unemployment cannot be ruled out.
- Scenarios
- Best Case
- Unemployment declines slightly from its current level and remains near historical lows over the next two years.
- Expected Case
- Unemployment remains largely unchanged as the U.S. economy grows, slightly below its longer-term trend rate.
- Worst Case
- Unemployment approaches 5.5% by the end of 2026 as a result of meaningfully slower economic growth.
- Best Case
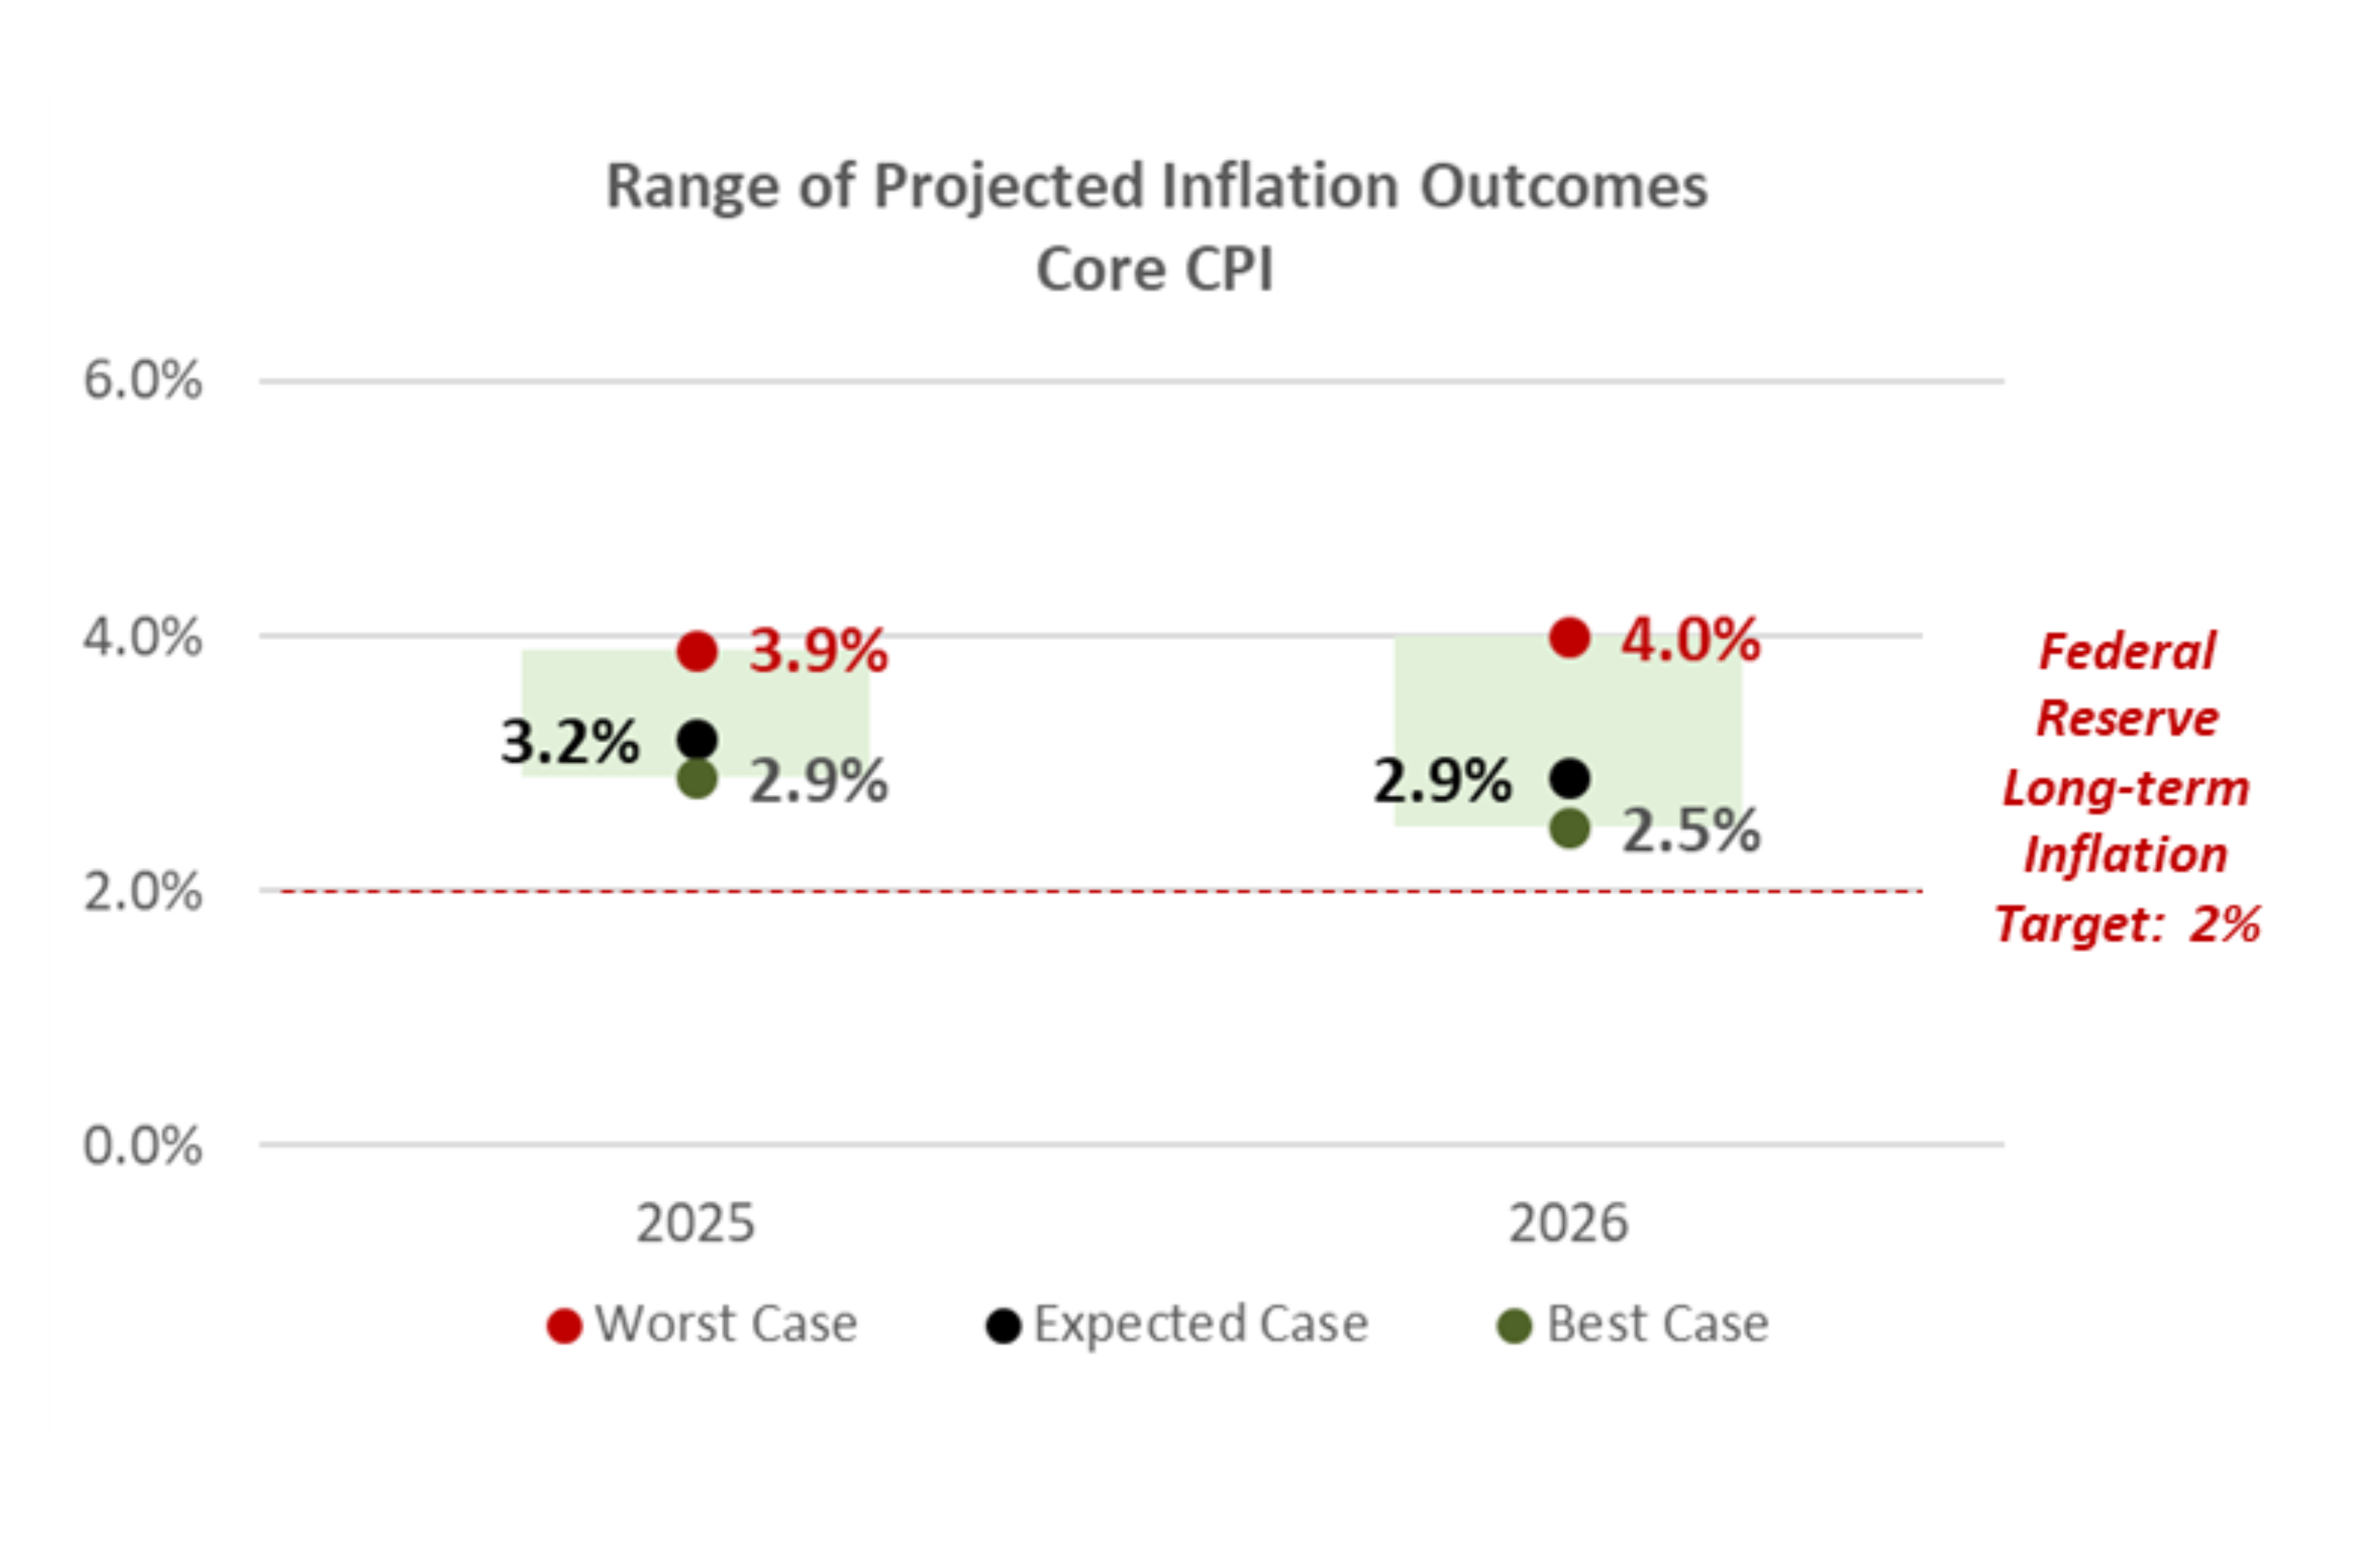
2025 Expectations: Inflation
- Inflation has softened so far in 2025 but is expected to increase marginally in the second half of the year as tariffs begin to filter into the aggregate U.S. economy.
- Policy changes that may be inflationary in nature (ex: tariffs), may keep inflation stubbornly above the Fed’s inflation target in 2025.
- Assuming a major escalation in trade protectionism does not occur, inflationary impacts from tariffs are expected to be “short term” and “moderate” in nature.
- Inflation is expected to decline in 2026 but remain above the Fed’s 2% inflation target throughout the calendar year.
- Scenarios
- Best Case
- Inflation declines but remains about 0.5% higher than the Fed’s long-term inflation target by the end of 2026.
- Expected Case
- Inflation continues to moderate slowly and is about 1.0% higher than the Fed’s long-term inflation target by the end of 2026.
- Worst Case
- Inflation continues to be sticky throughout the aggregate economy and is close to 2% higher than the Fed’s long-term inflation target through the end of 2026.
- Best Case
2025 Potential Policy Changes: Corporate Income Tax Reform
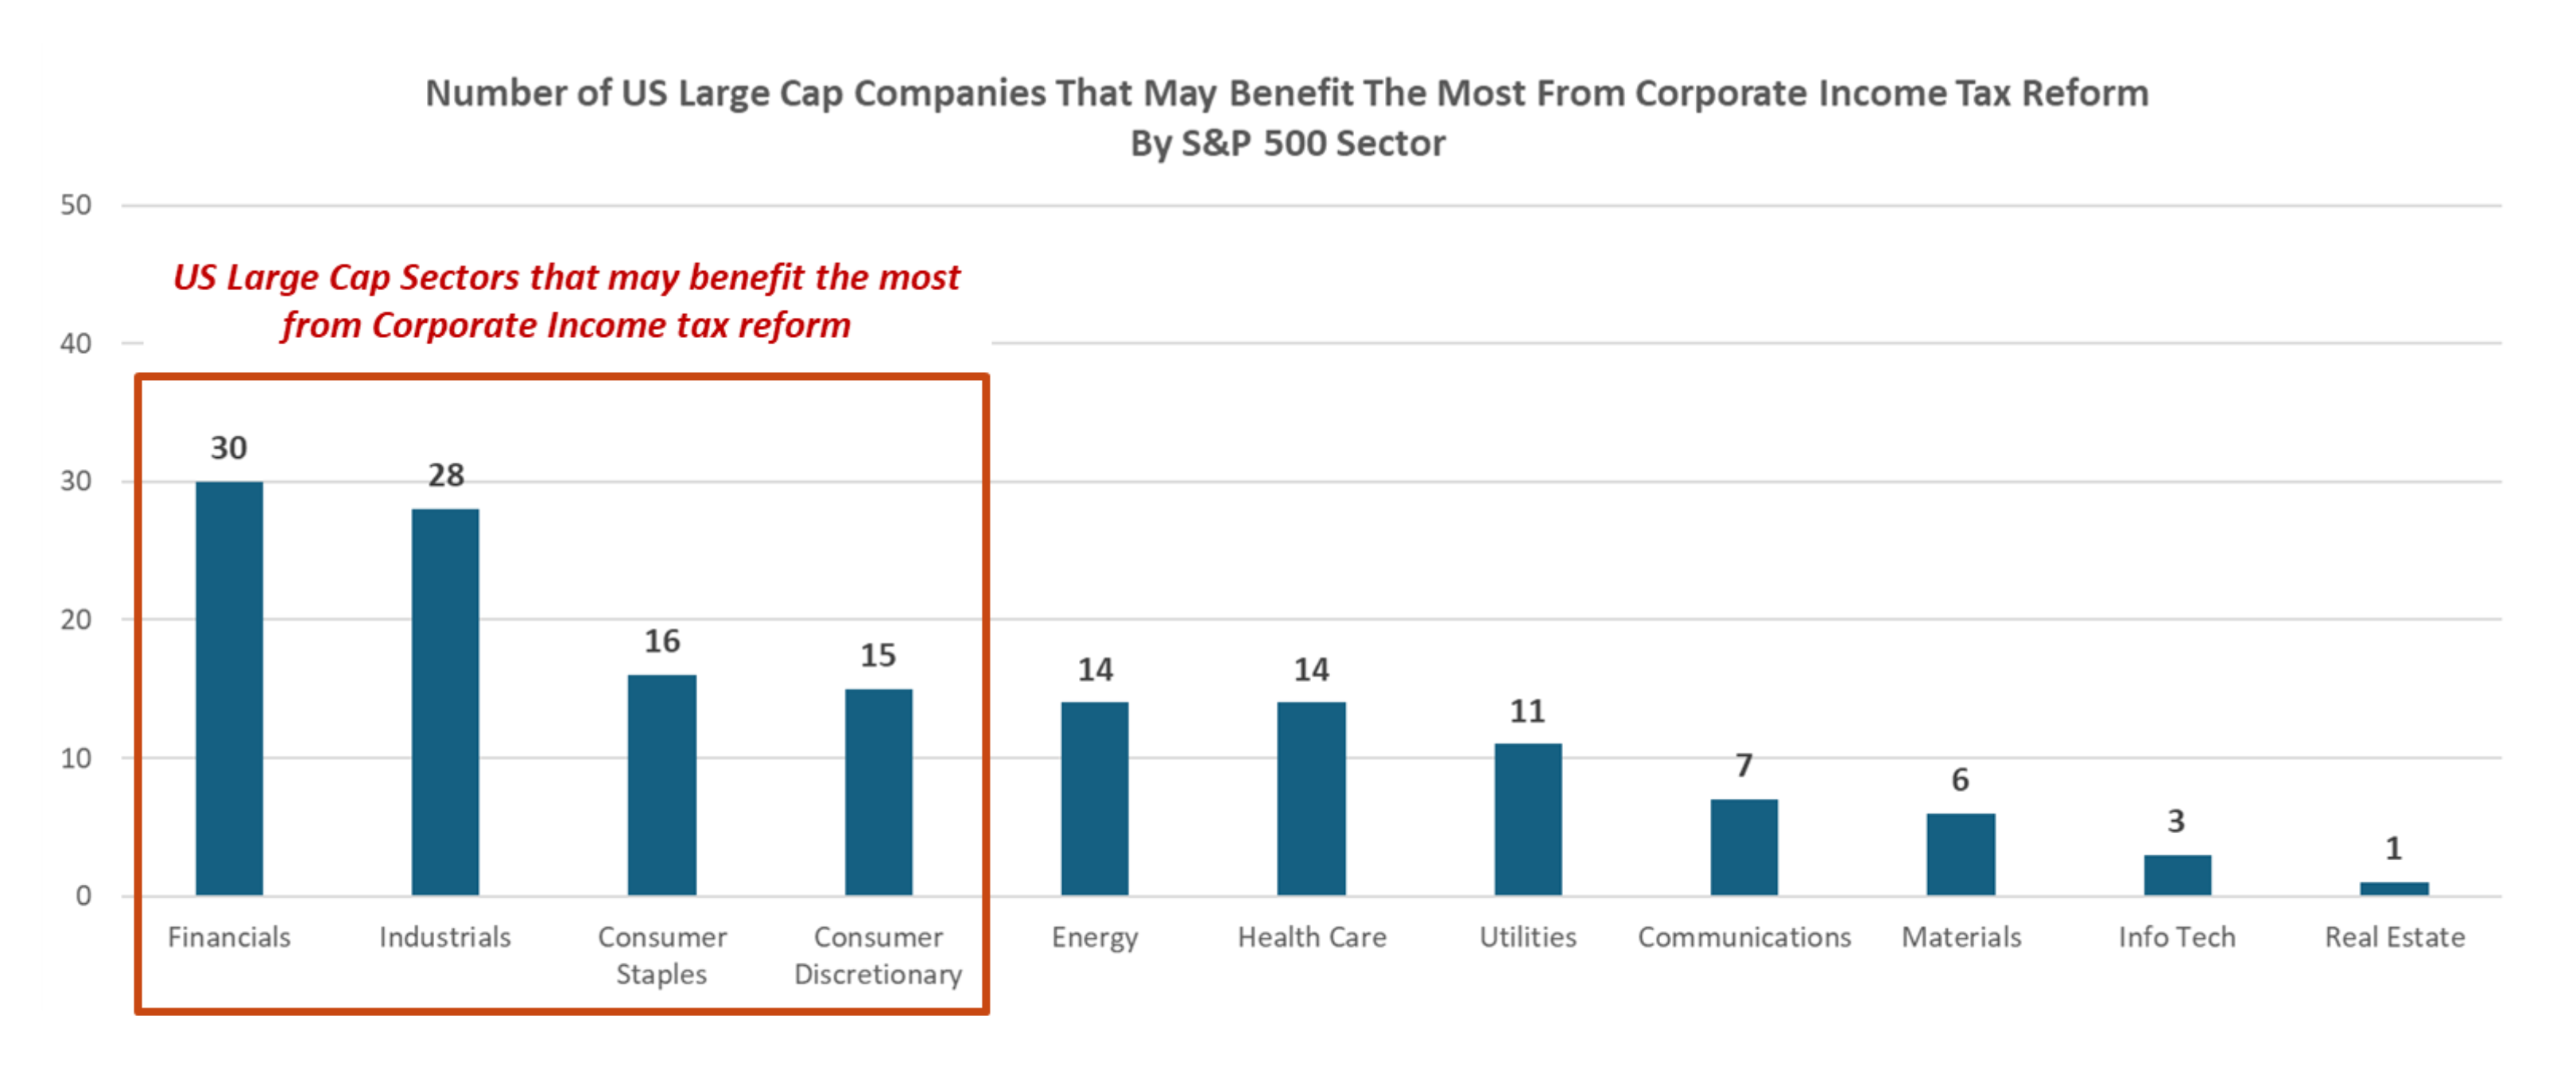
- U.S. corporate income tax reform could help boost corporate earnings over the short term, but the impact of the proposed tax cuts would be rather limited compared to the tax cuts enacted in 2018, when corporate income tax rates were cut from 35% to 21%.
- Current proposed changes to corporate income tax code include lowering income tax rates from 21% to 15%, but the benefit may only apply to firms that produce U.S. goods.
- Firms that pay higher effective income tax rates (ex: above 15%) and produce more than 80% of annual revenue in the U.S. stand to benefit the most. Firms that generate more revenue overseas (or already have low effective tax rates) may not benefit.
- Takeaway
- Firms within Financials, Industrials, Consumer Staples and Consumer Discretionary may benefit the most from corporate income tax reform.
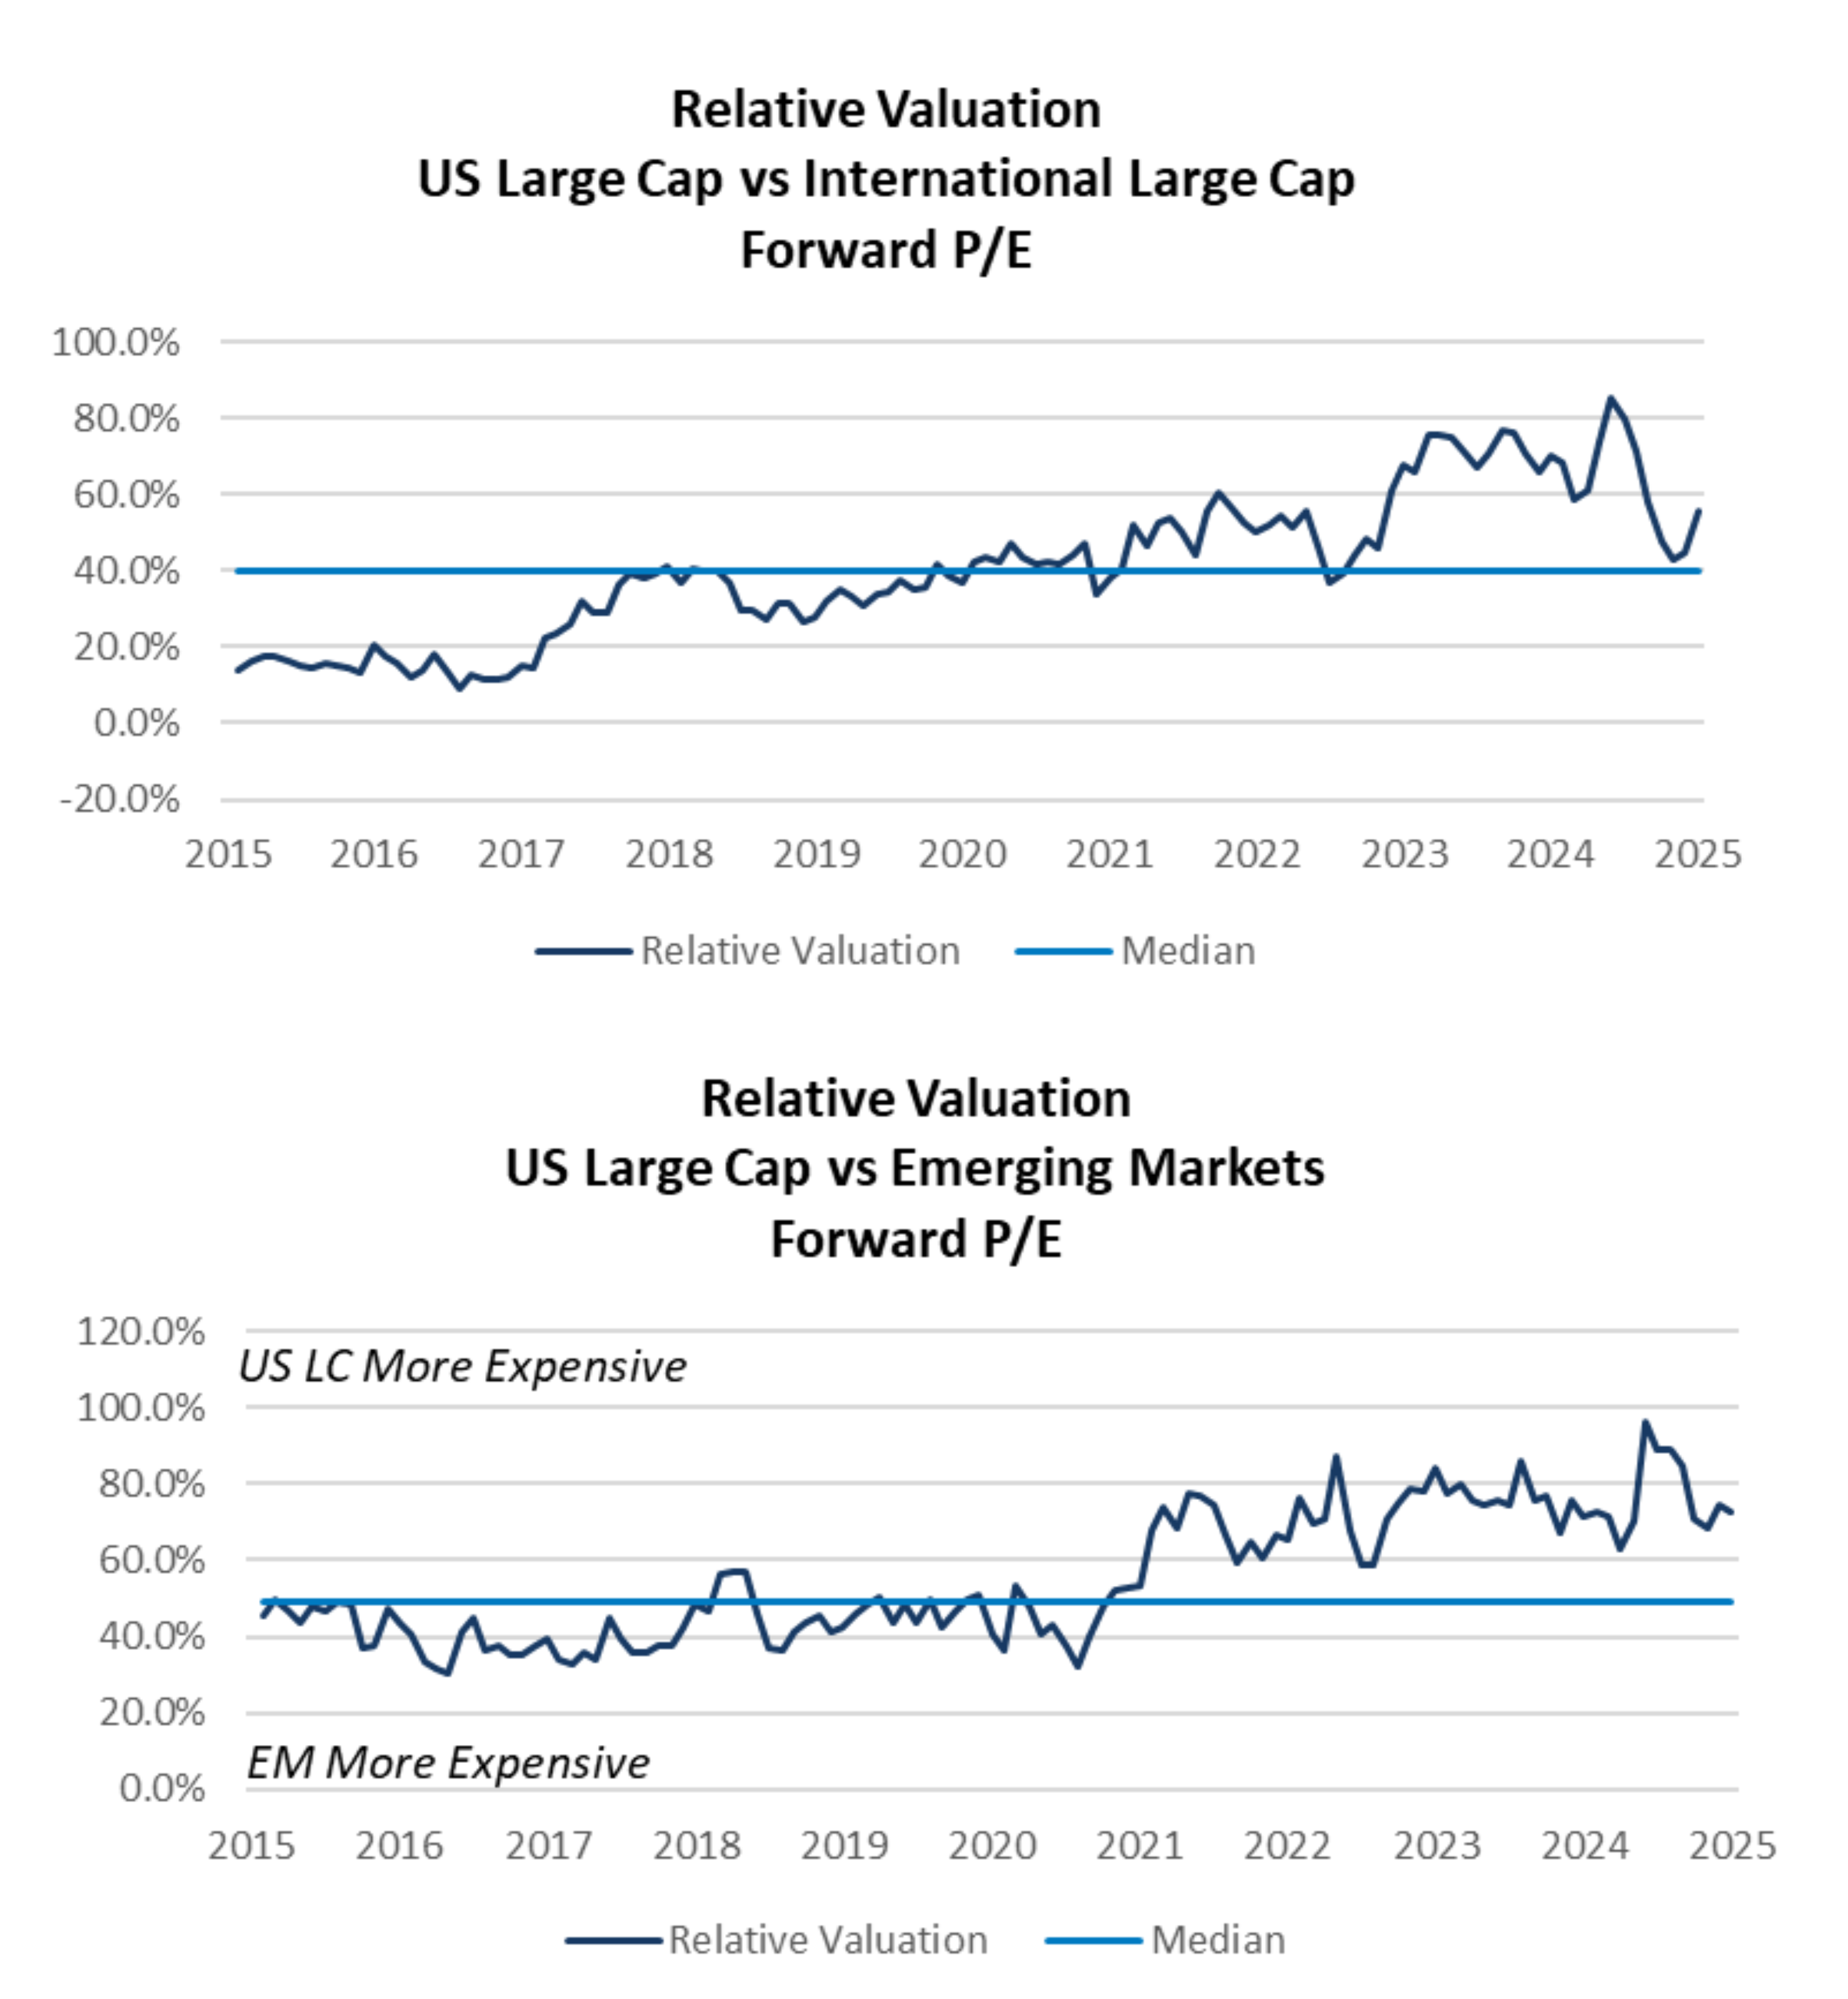
Relative Valuations: U.S. Large Cap Comparison
- Despite recent outperformance by equities outside the U.S., fundamental valuation metrics suggest that U.S. equities are still “expensive” on a relative basis.
- Relative valuations for U.S. Large Cap stocks have come down of late but remain above their 10-year average.
- International and emerging market equities rallied to start the year, while U.S. Large Caps have not kept up, helping to close the valuation gap.
- Economic consideration
- Amidst widespread uncertainty, international markets are expected to face a harsher impact from tariffs and trade wars than U.S. stocks.
- Takeaway
- A slight underweight to international equity and emerging market equity is recommended, given the potential for trade related volatility is expected to continue in 2025.
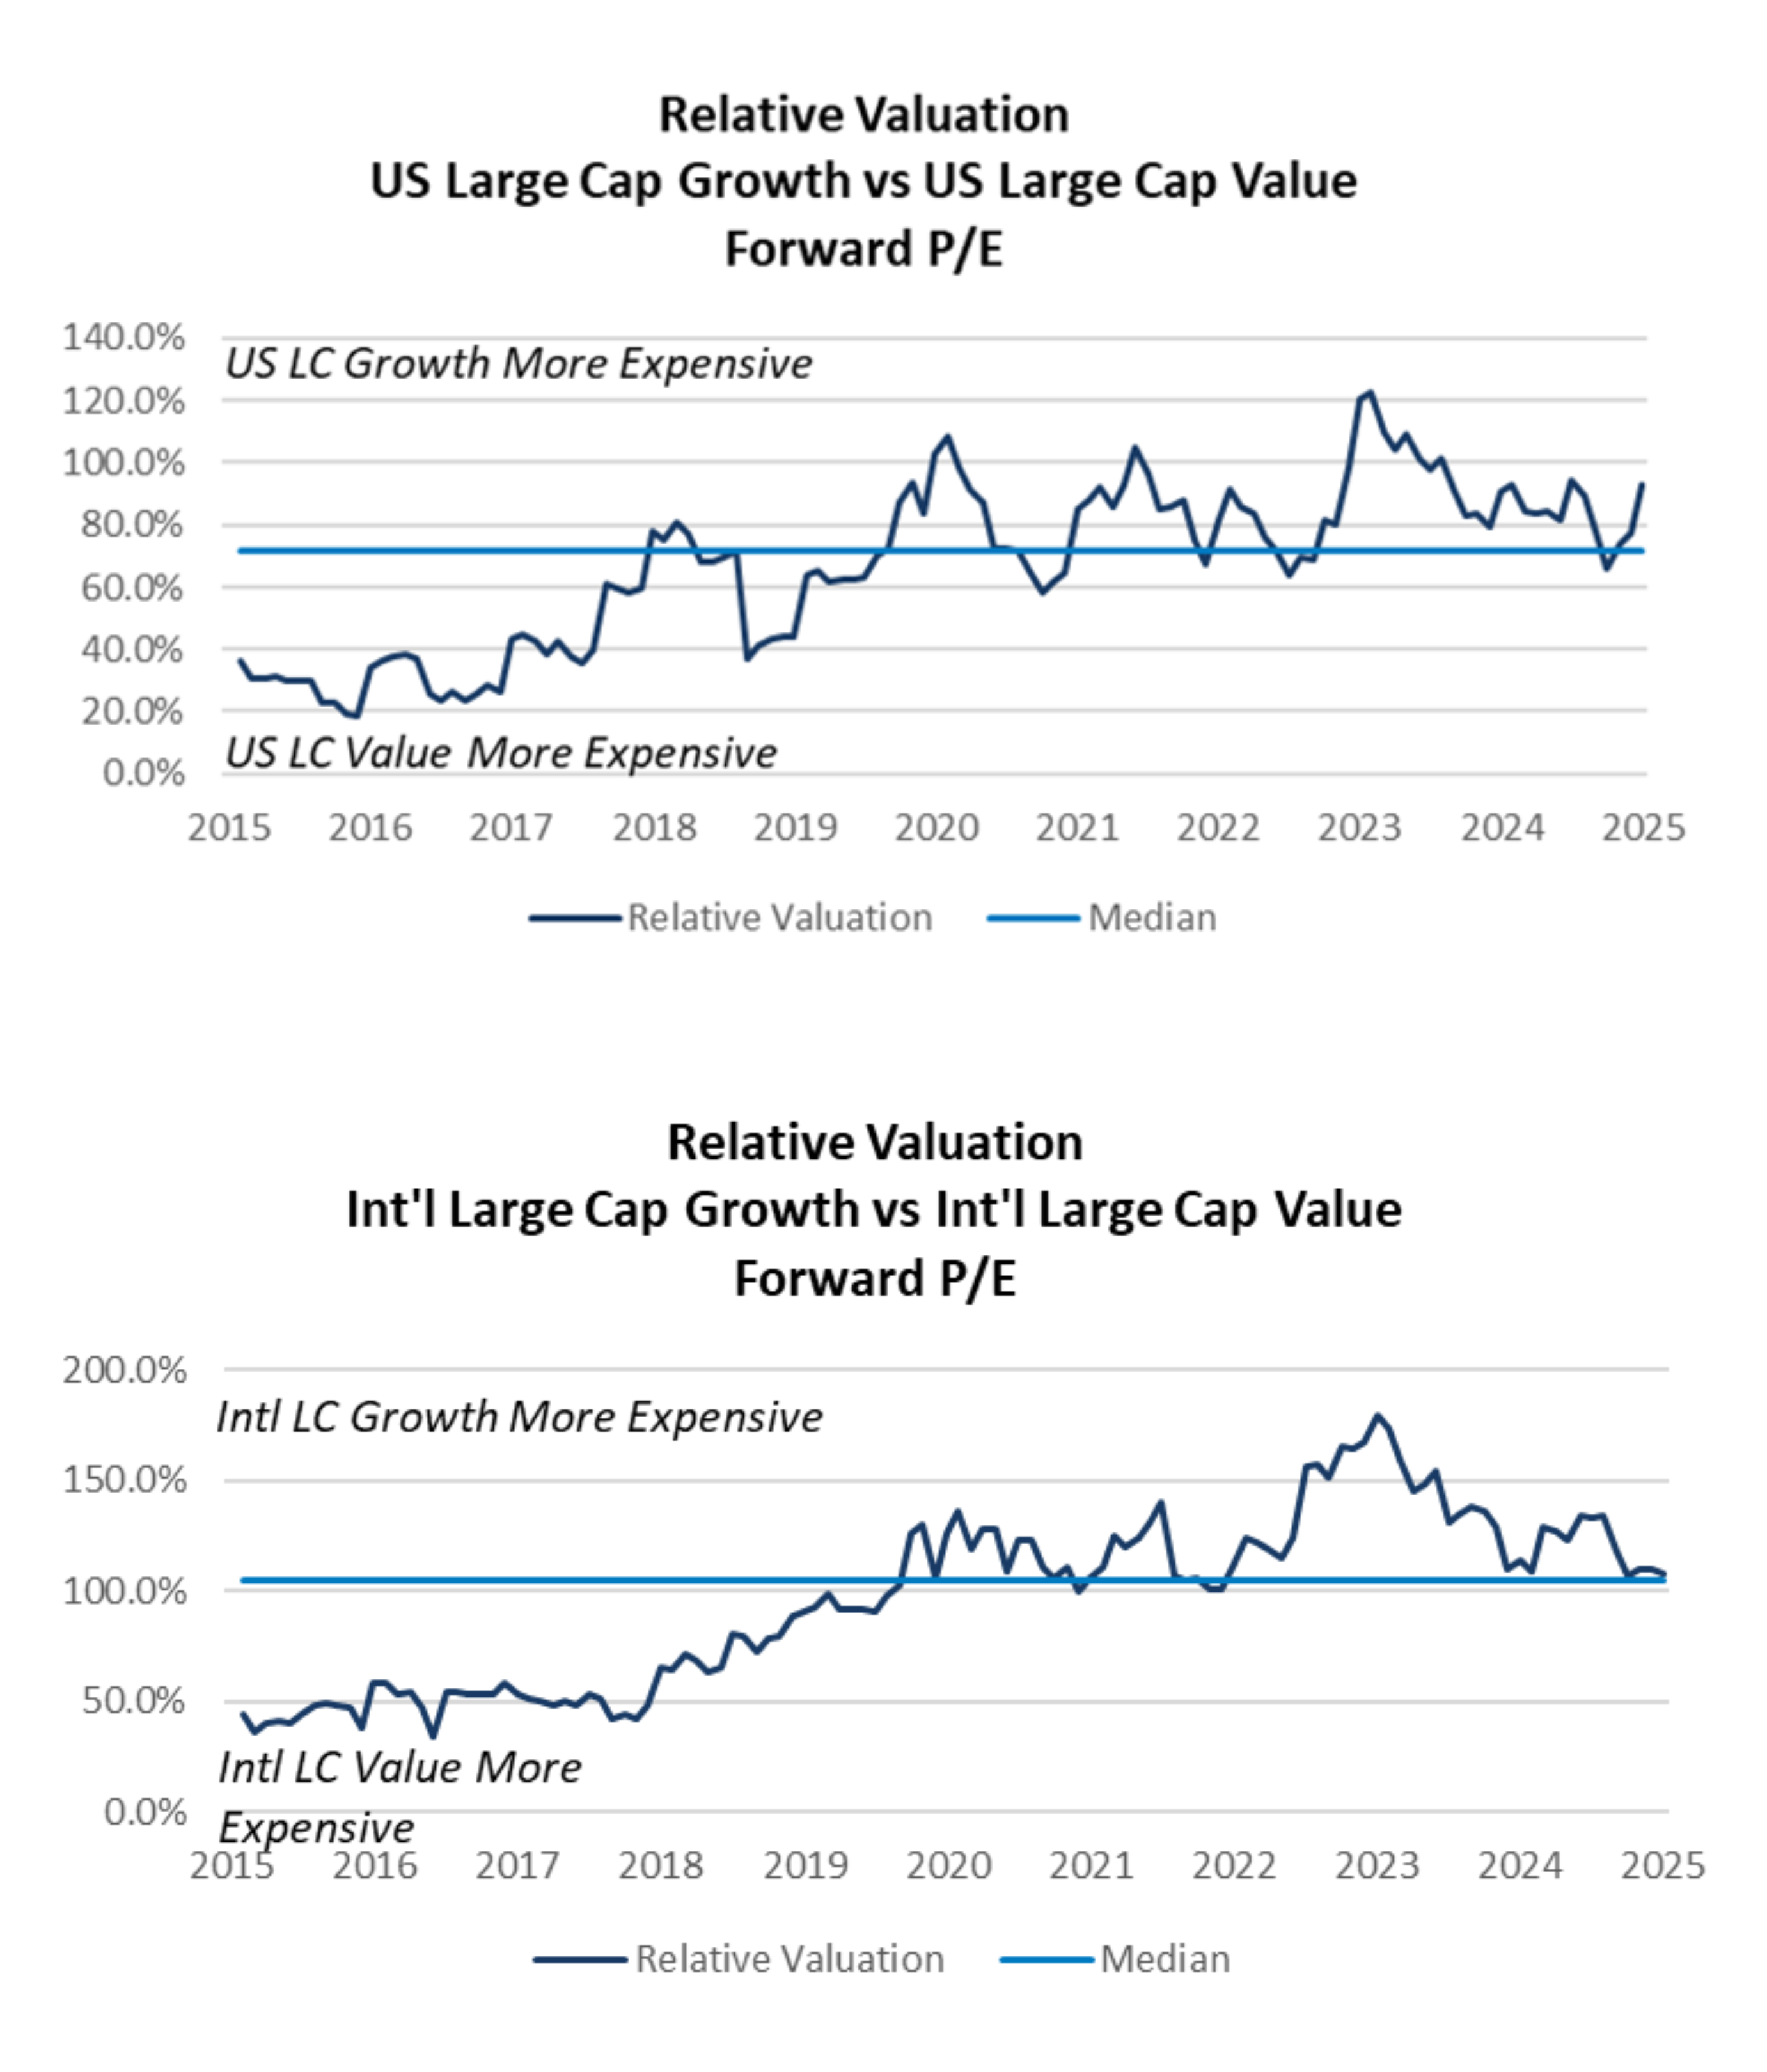
Relative Valuations: Growth vs. Value Comparison
- “Growth” stocks in the U.S. rebounded in the second quarter after a brief selloff during the first quarter. Relative fundamental valuation metrics suggest Growth equities are more expensive than Value equities.
- Internationally, Value stocks have outperformed their Growth counterparts, helping to reduce the valuation disparity between these two styles.
- Economic considerations:
- Value equities carry less risk than Growth equities and have less downside exposure, should market volatility increase.
- Value stocks also tend to have less downside exposure to trade and tariff related volatility than Growth stocks.
- Takeaway
- A slight overweight to Value relative to Growth is recommended given current fundamental valuations and the potential for trade related volatility to continue.
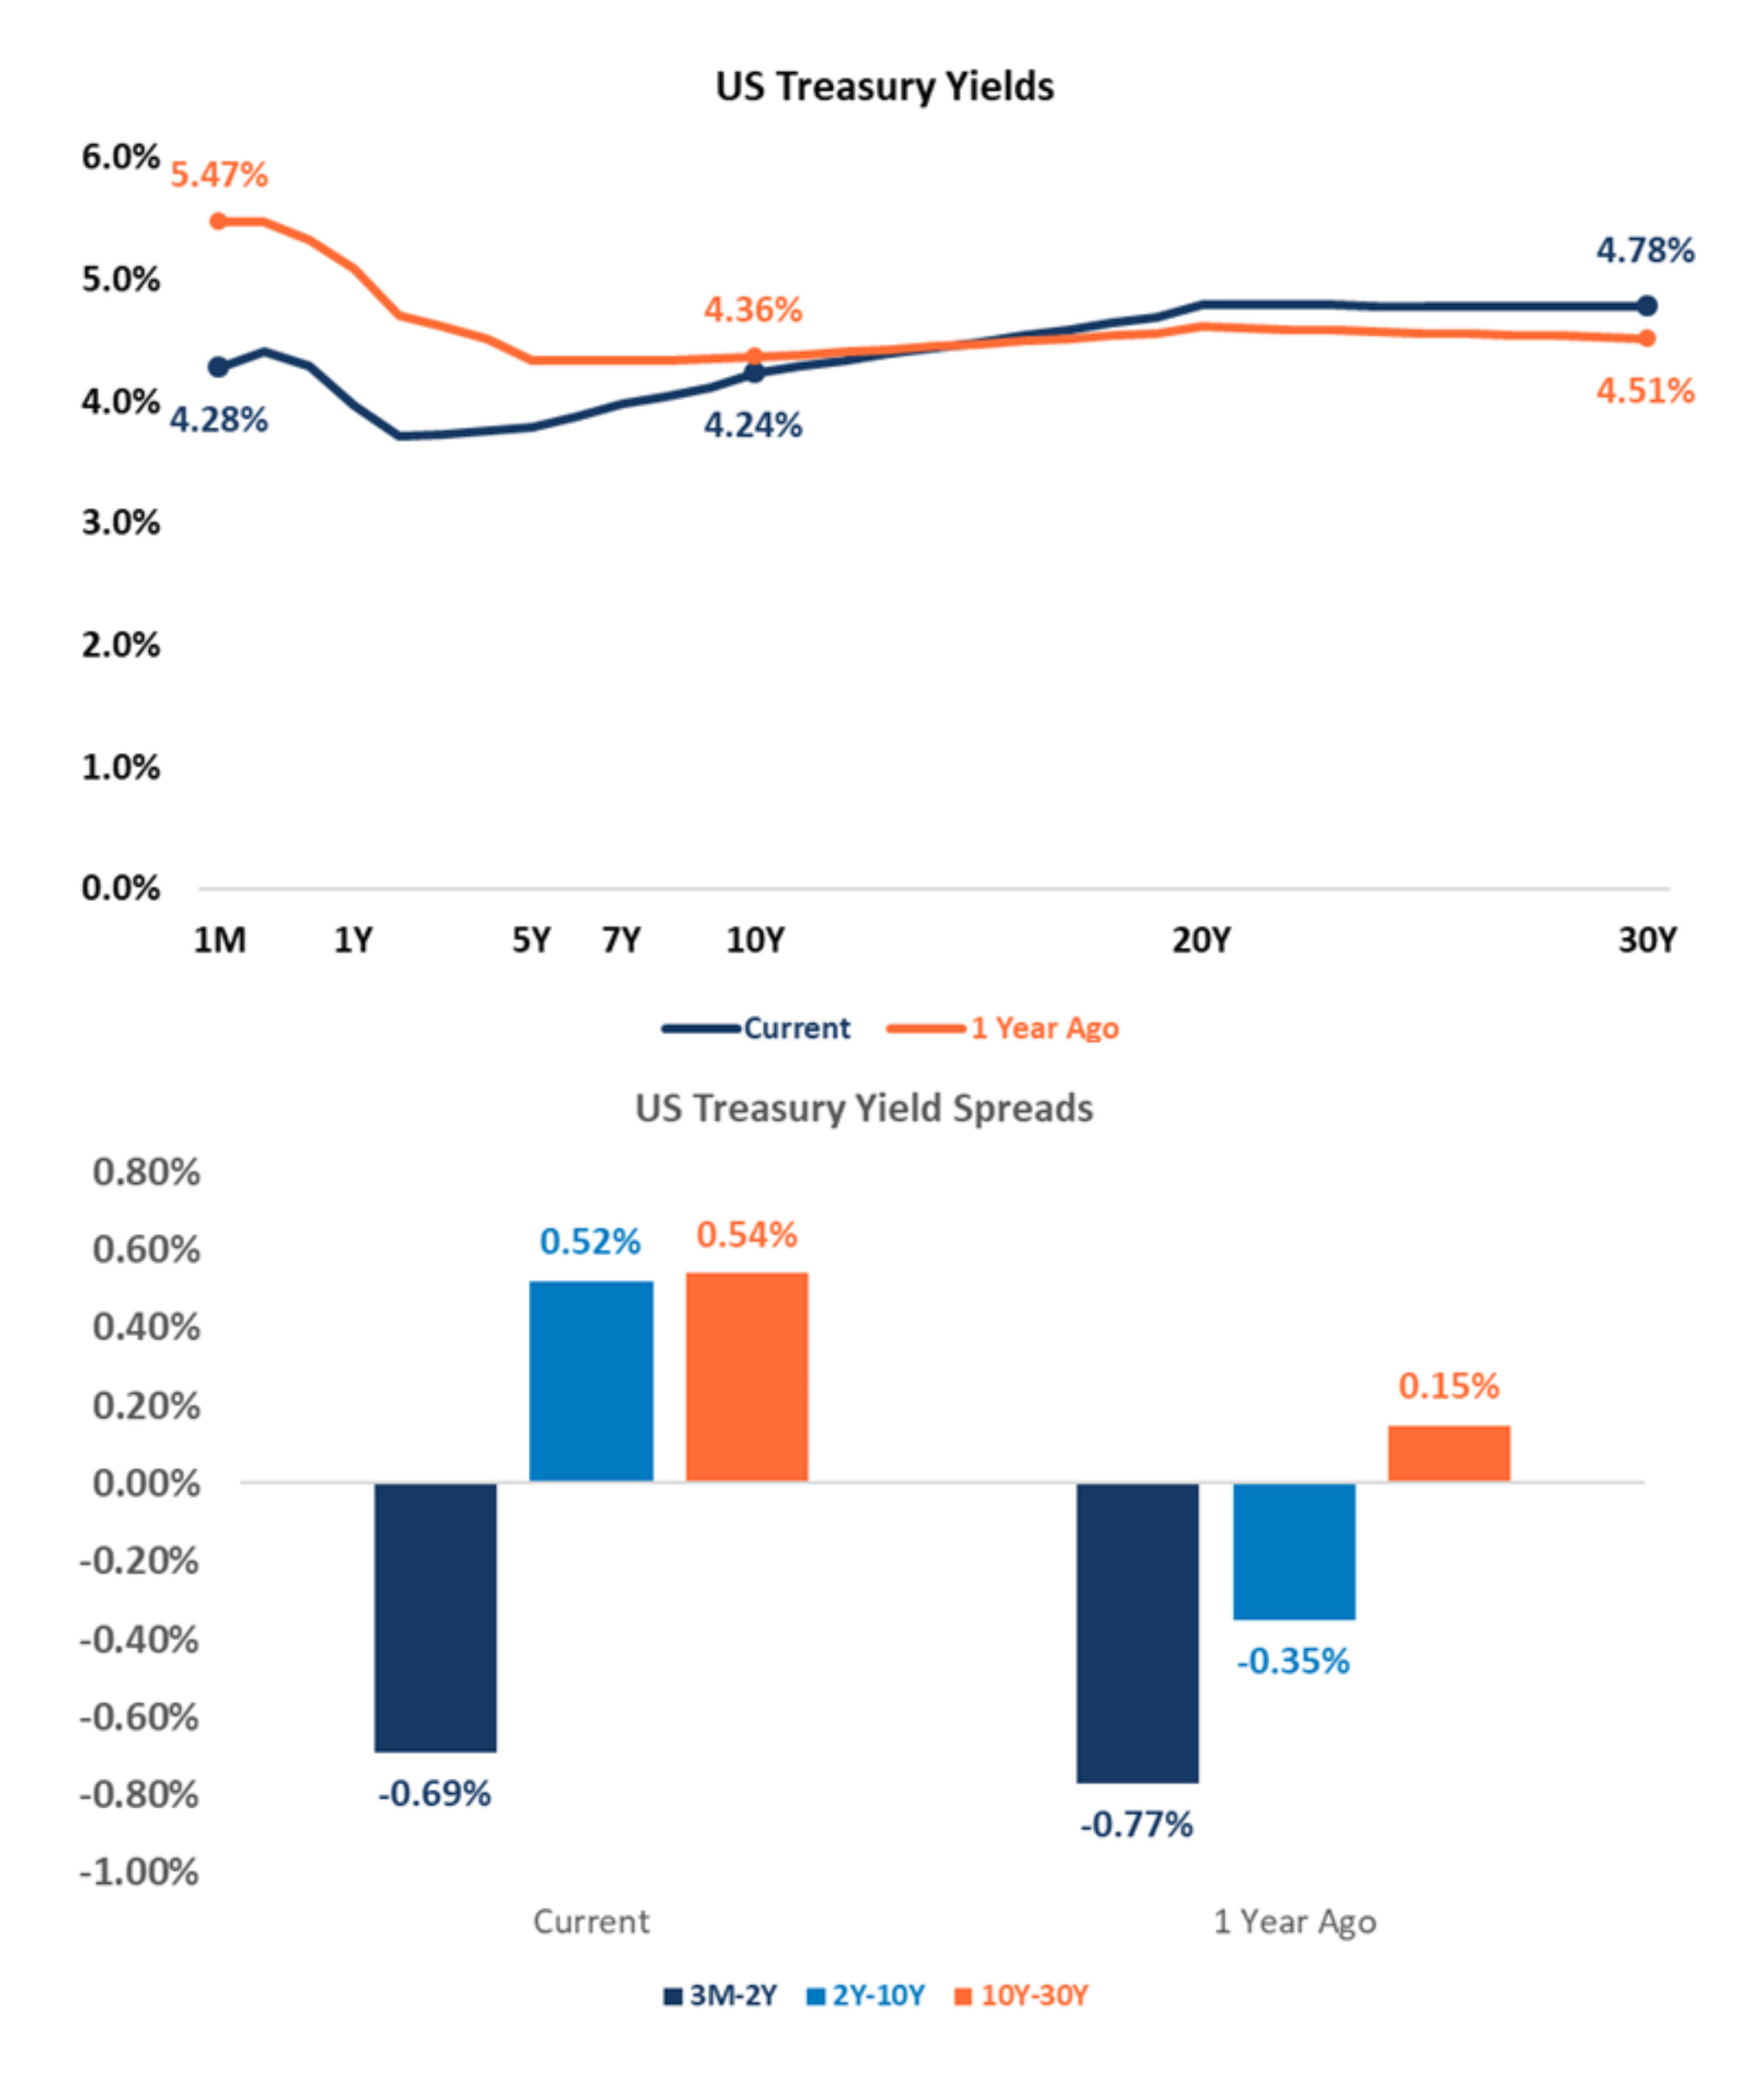
Fixed Income: Treasuries
- The U.S. Treasury Yield curve has changed materially over the past year.
- The yield curve remains inverted only at the very short end of the curve, but longer-dated term rates are no longer inverted.
- Short-term yields declined by more than 1% because of Fed interest rate cuts over the past year.
- Longer-term yields moved higher on concerns of economic uncertainty, including inflation, growing U.S. deficits and trade wars.
- The yield curve remains inverted only at the very short end of the curve, but longer-dated term rates are no longer inverted.
- The yield curve should continue to steepen over the rest of 2025 as the Fed is expected to cut short-term rates by 25 to 50 bps during the year.
- Note: The Fed could elect to keep short-term rates unchanged should inflation remain stickier than expected (and unemployment does not increase materially).
- Takeaway
- Investors should consider maintaining a short duration posture in their fixed income portfolios until the U.S. Treasury curve steepens more meaningfully.
Long-Term Investors Should Stay Invested
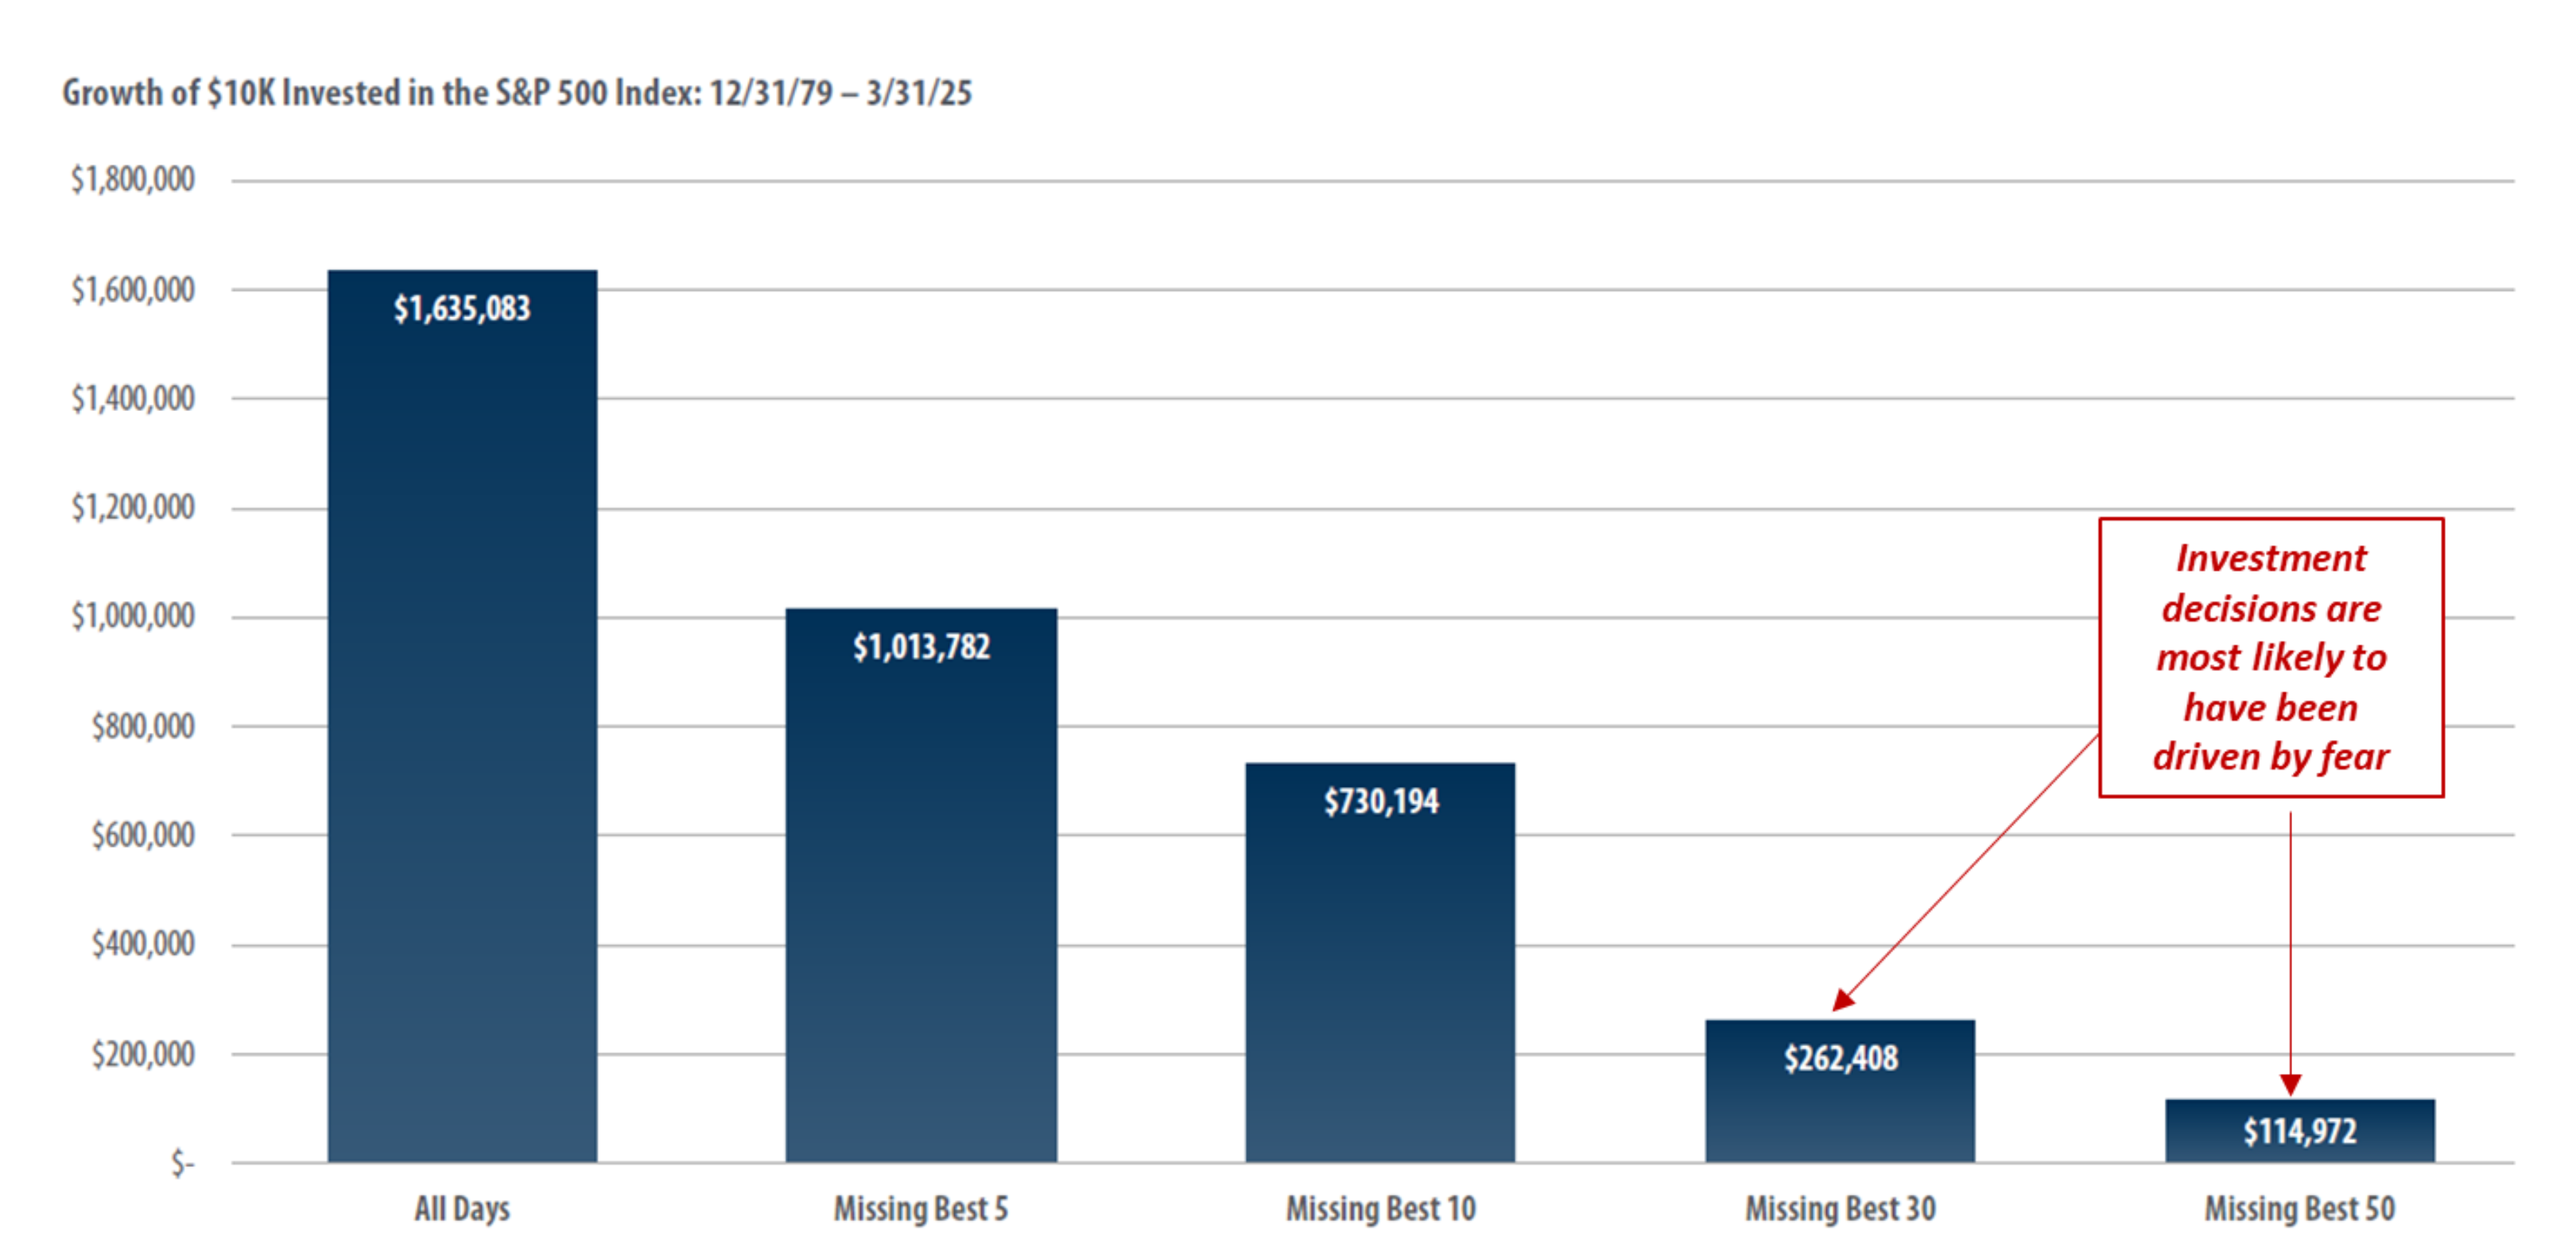
- The chart highlights how a $10k investment in the S&P 500 would have grown over the past 45 years.
- If the investor missed the best 30 days of market performance, the investment portfolio would be worth more than $1.3M less than if the investor had stayed in the market.
- Takeaways
- The market’s best performance days typically occur during periods of elevated volatility.
- Regardless of what may be in store for the macroeconomy and capital markets, long-term investors should avoid the temptation to exit out of markets during periods of elevated uncertainty.
- Riding out market volatility is the best way to build wealth over the long term.
Equity Market Volatility
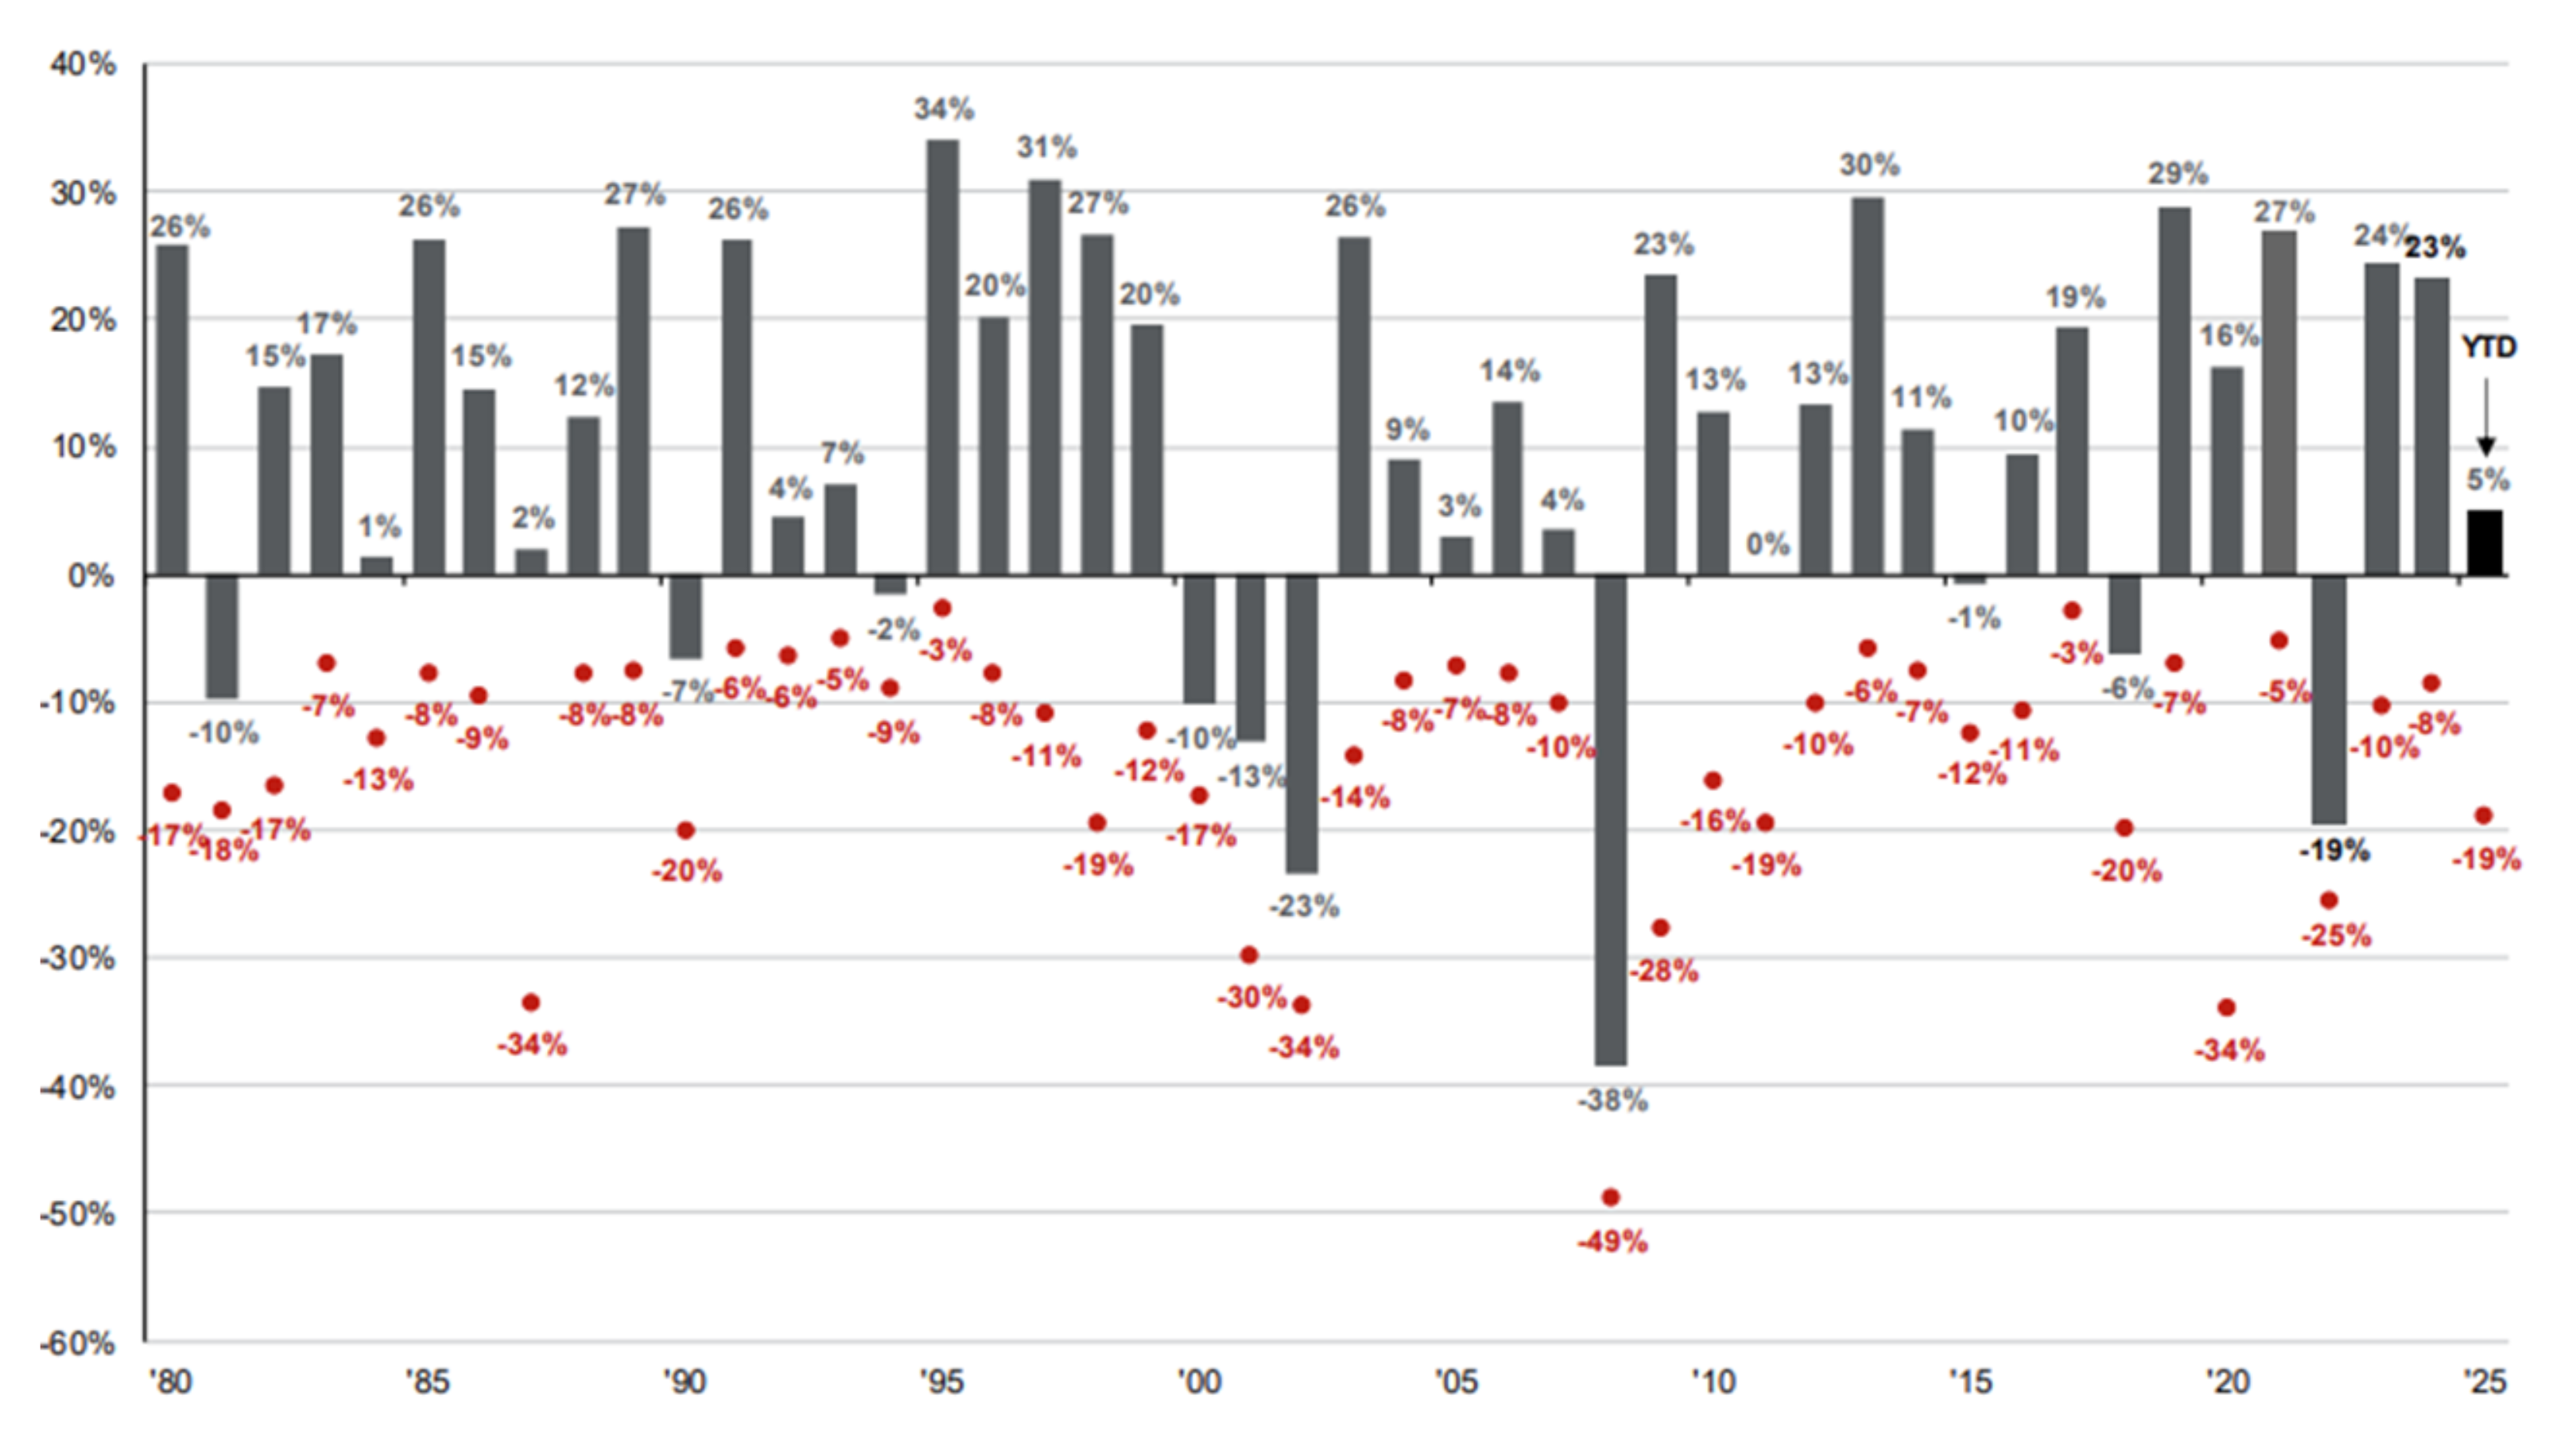
- The chart illustrates annual S&P 500 performance since 1980 (shown in columns above) and the intra-year declines during each year (shown by the red dots).
- Ex: In 2020, the S&P 500 experienced in intra-year decline of -34%, before finishing up 16% for the year.
- Over the past 45 years, the S&P 500 has experienced an average intra-year decline of 14%. Despite that, the S&P 500 had positive annual performance in 34 of the last 45 years.
- Takeaway
- As painful as market volatility can be, equity market selloffs are normal and investors are rewarded for patience.
Playbook Summary
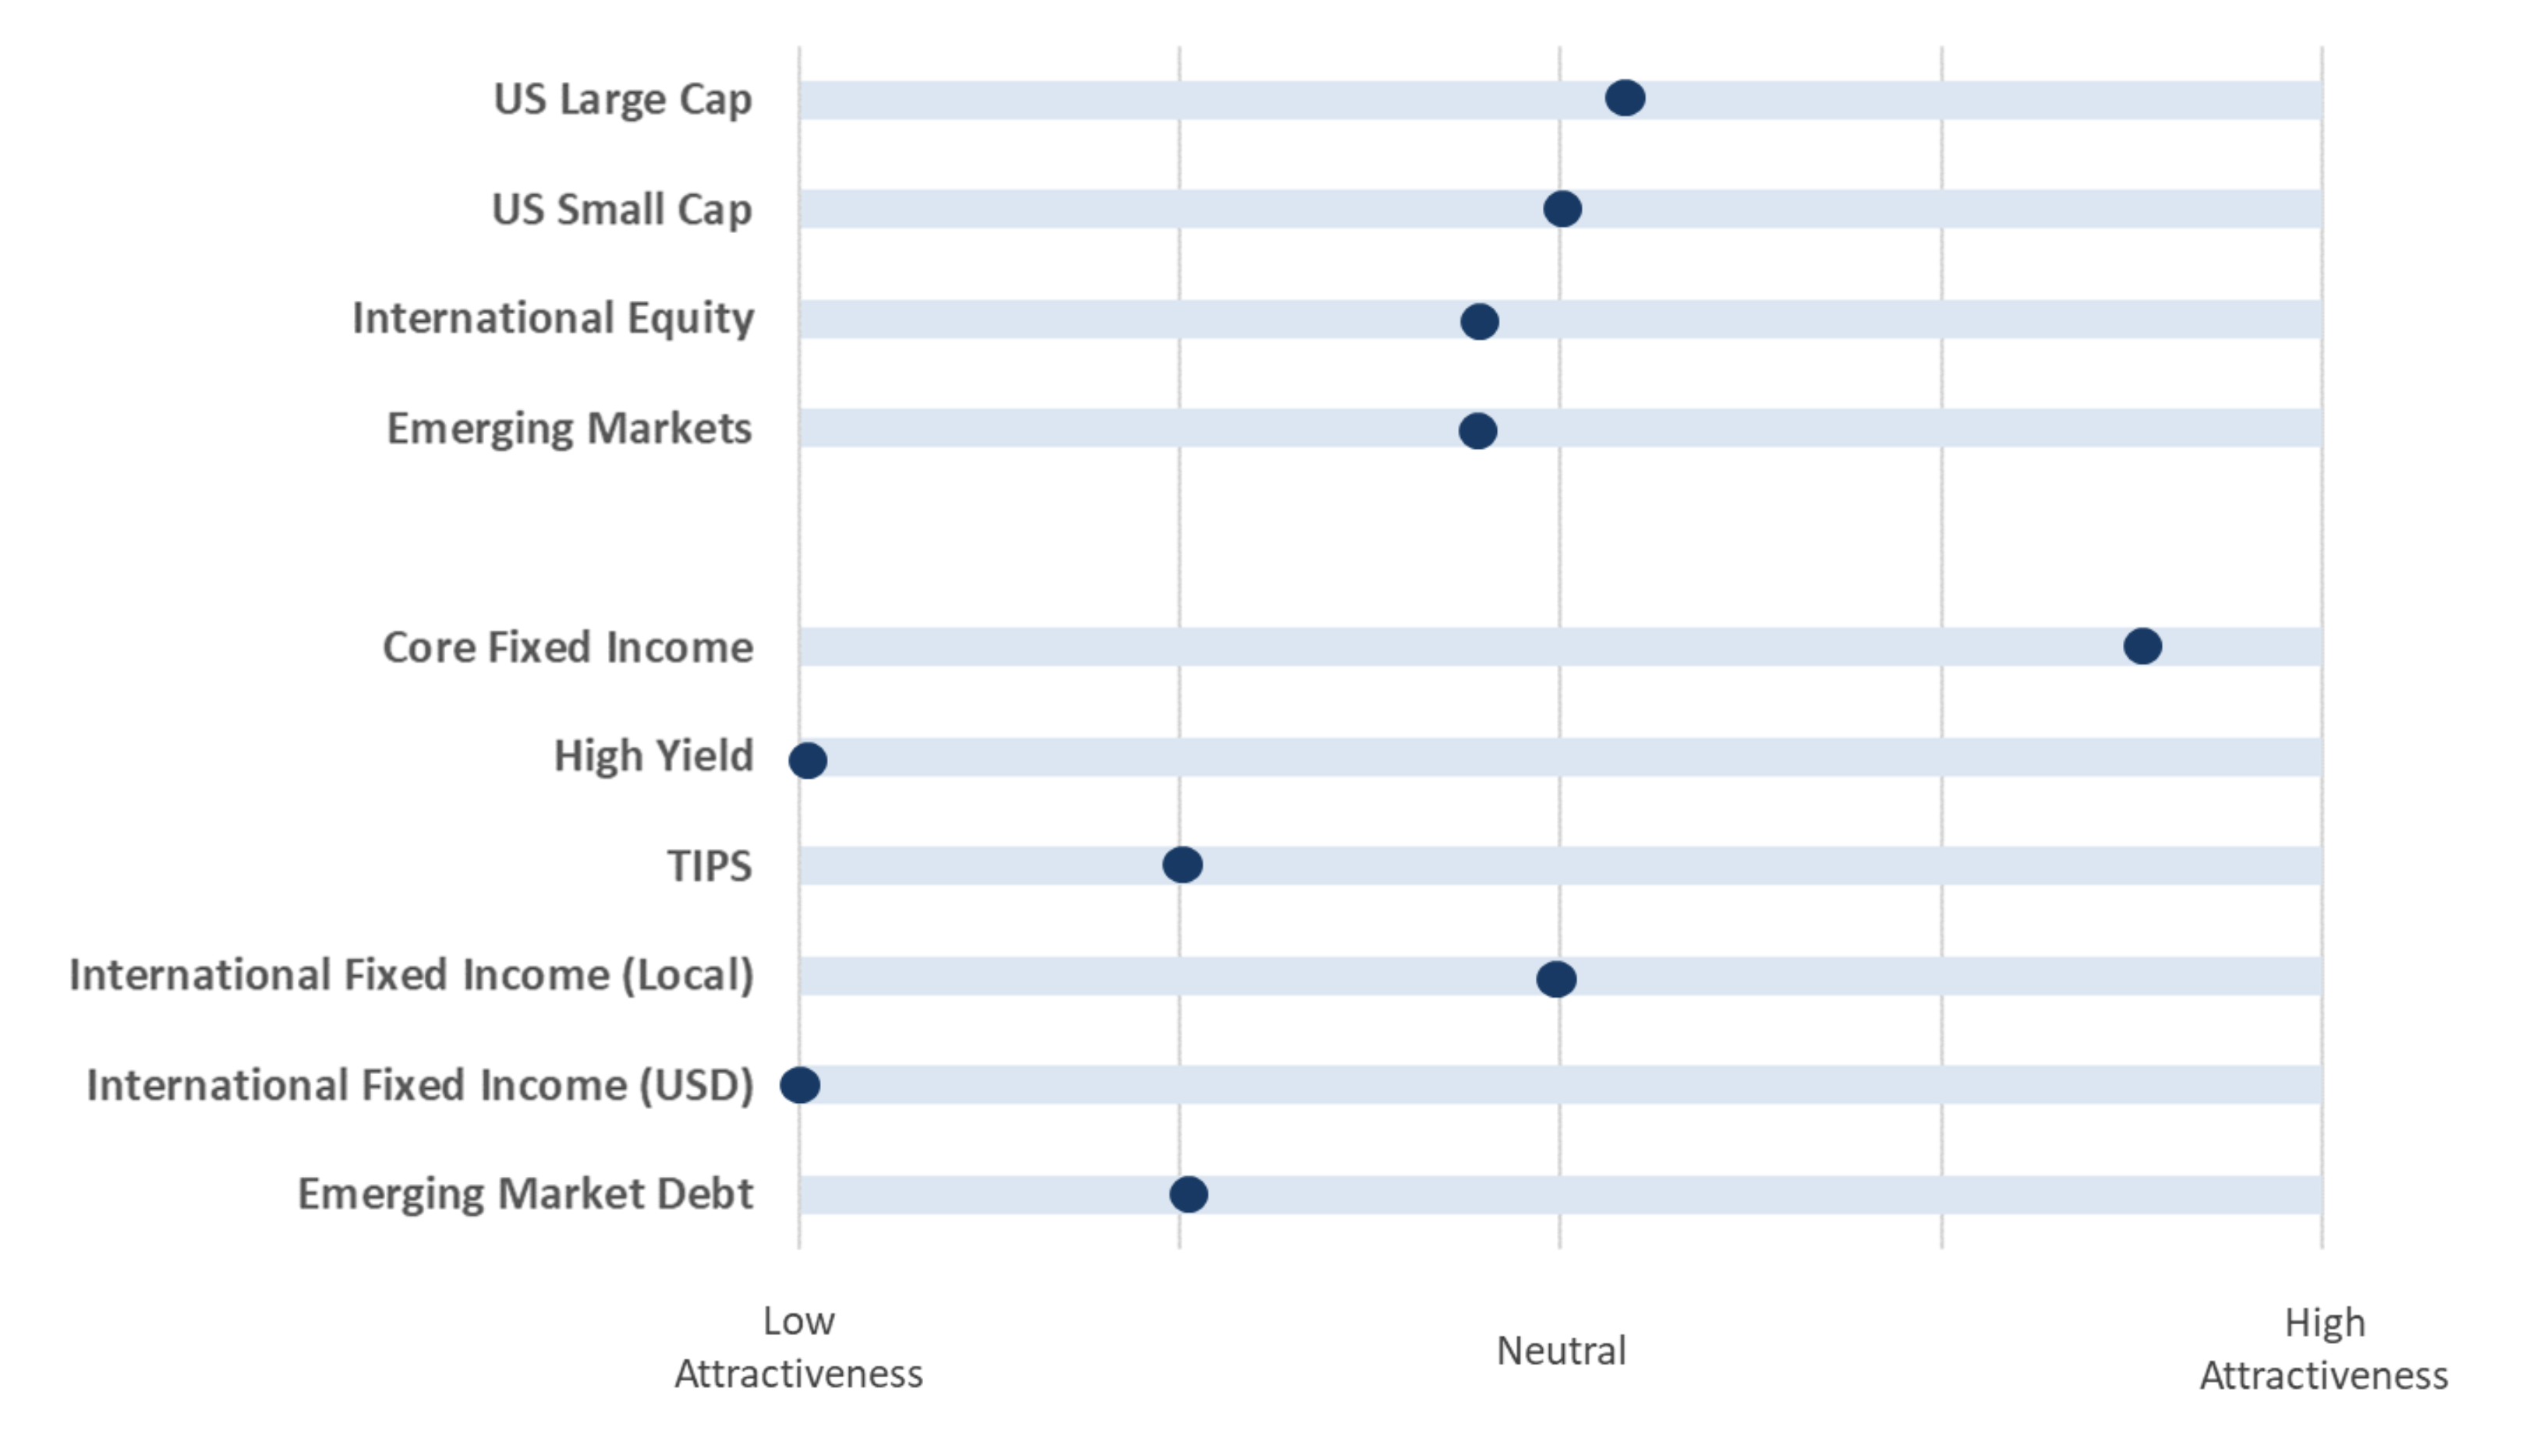
- The above table indicates where each major investment asset class falls on the distribution of attractiveness (from low to high). This table is meant to provide a standardized and comparable view of the level of opportunity in each asset class category.
- In subsequent quarters, we will discuss any movement along the scale for each asset class and the driving forces behind the change in outlook.

