
August 2026 Market Update

Economic Highlights
United States
- The U.S. economy unexpectedly lost 23,000 jobs in July, well below the 83,000 forecast. In addition to the weak numbers for June and July, the final count for May was revised down to 63,000, or 66,000 lower than the prior estimate. The revised numbers brought the 12-month average down to just 34,000. The unemployment rate slipped to 4.1% as the labor force participation rate fell further to 61.4%, its lowest in more than five years, another indication that fewer Americans were working or looking for jobs. The July decline was led by a 50,000 decrease in local government positions and a loss of 19,000 retail jobs. Average hourly earnings were weak last month, with the annual growth rate falling to 3.2%, the lowest reading since May 2021.
- Federal Reserve Chairman Kevin Warsh used his Jackson Hole keynote speech to hammer home a message that curbing inflation is the central bank’s highest priority. While Warsh doubled down on his commitment to avoid forward-looking guidance to financial markets, he did offer some clues into his economic views. He warned inflation isn’t meaningfully slowing and that policymakers must be confident it is before enacting any monetary easing. He also added that current financial conditions were not restraining the U.S. economy. After reiterating the Fed’s 2% PCE inflation target, markets priced in a higher probability for an interest rate hike in the near term.
- The July PCE report showed headline inflation rose 0.2% M/M or 3.7% Y/Y. Core PCE rose 0.2% M/M or 3.3% Y/Y. Although food and energy prices declined in July, most other key areas of inflation remained fairly sticky. Consumer spending was flat in July after increasing 0.4% in June. Consumer spending has remained fairly resilient this year in the face of headwinds, including a war-driven energy price spike, a tepid labor market and the compounding effects of five-plus years of higher-than-normal inflation.
- U.S. retail sales fell 0.6% M/M in July, sharply missing expectations for a gain of 0.1%. This marked the biggest decline since October 2025 and the worst print since May 2025. Part of the weakness likely came from Amazon moving its Prime Day event to June from July. Core retail sales, used to calculate consumer spending in the GDP report, shed 0.4%.
Non-U.S. Developed
- The eurozone flash composite PMI hit a 9-month high of 52.1 in August, up from 52.0 in the previous month. The pick-up in the rate of expansion reflected a solid and accelerated rise in manufacturing production, with the latest increase the fastest in four-and-a-half years. In fact, the headline manufacturing PMI, a weighted average of five key sub-indices, rose to 52.8, its highest since May 2022. The improved manufacturing growth picture was in large part centered on Germany, where production rose at the fastest pace since January 2022. Eurozone services activity, meanwhile, increased modestly, with the pace of expansion unchanged from that seen in July.
- Eurozone economic growth beat expectations in Q2, but growth by member countries was all over the map. Growth of 0.4% Q/Q was better than the 0.2% estimate and the flattish growth reported last quarter. Ireland reported the strongest level of growth at 3.9% Q/Q, while Germany and France both reported subdued growth of 0.2%. Germany’s growth slowed from Q1 and France remained weak overall.
Emerging Markets
- China’s manufacturing activity in August shrank for a second straight month, keeping the pressure on Beijing to support the economy as growth loses momentum. The official PMI reading came in at 49.8 in August, up slightly versus the 49.2 reported in July. Supply and demand both improved in August, with the sub-indices tracking production and new orders expanding to 50.4 and 50.6, respectively. The smaller company focused RatingDog Manufacturing PMI remained in expansion territory for the ninth straight month, with a reading of 51.5 in August.
- China's official Non-Manufacturing PMI held at 49.0 in August 2026, unchanged from July and below expectations of 49.5, pointing to a continued contraction in non-manufacturing activity.
- The economic malaise in China has deepened further in the second half of this year, as consumer spending stalled, urban investment contracted at a faster pace and unemployment ticked higher. Retail sales and industrial output both slowed in July while growth in industrial profits cooled to its weakest pace this year. Exports have been the one positive area of support for the struggling Chinese economy, largely due to the boom in artificial intelligence and digital infrastructure.
- India's economy expanded 7.8% Y/Y in Q2, blowing past forecasts as an investment boom and manufacturing strength added to already-solid consumer demand. Q2 growth beat the 7.1% estimate but was down sharply from the 8.6% growth clip registered in Q1. Growth is projected to be north of 7% for the full year, with the biggest risk to that forecast being the headwind from higher energy prices and persistent inflation.
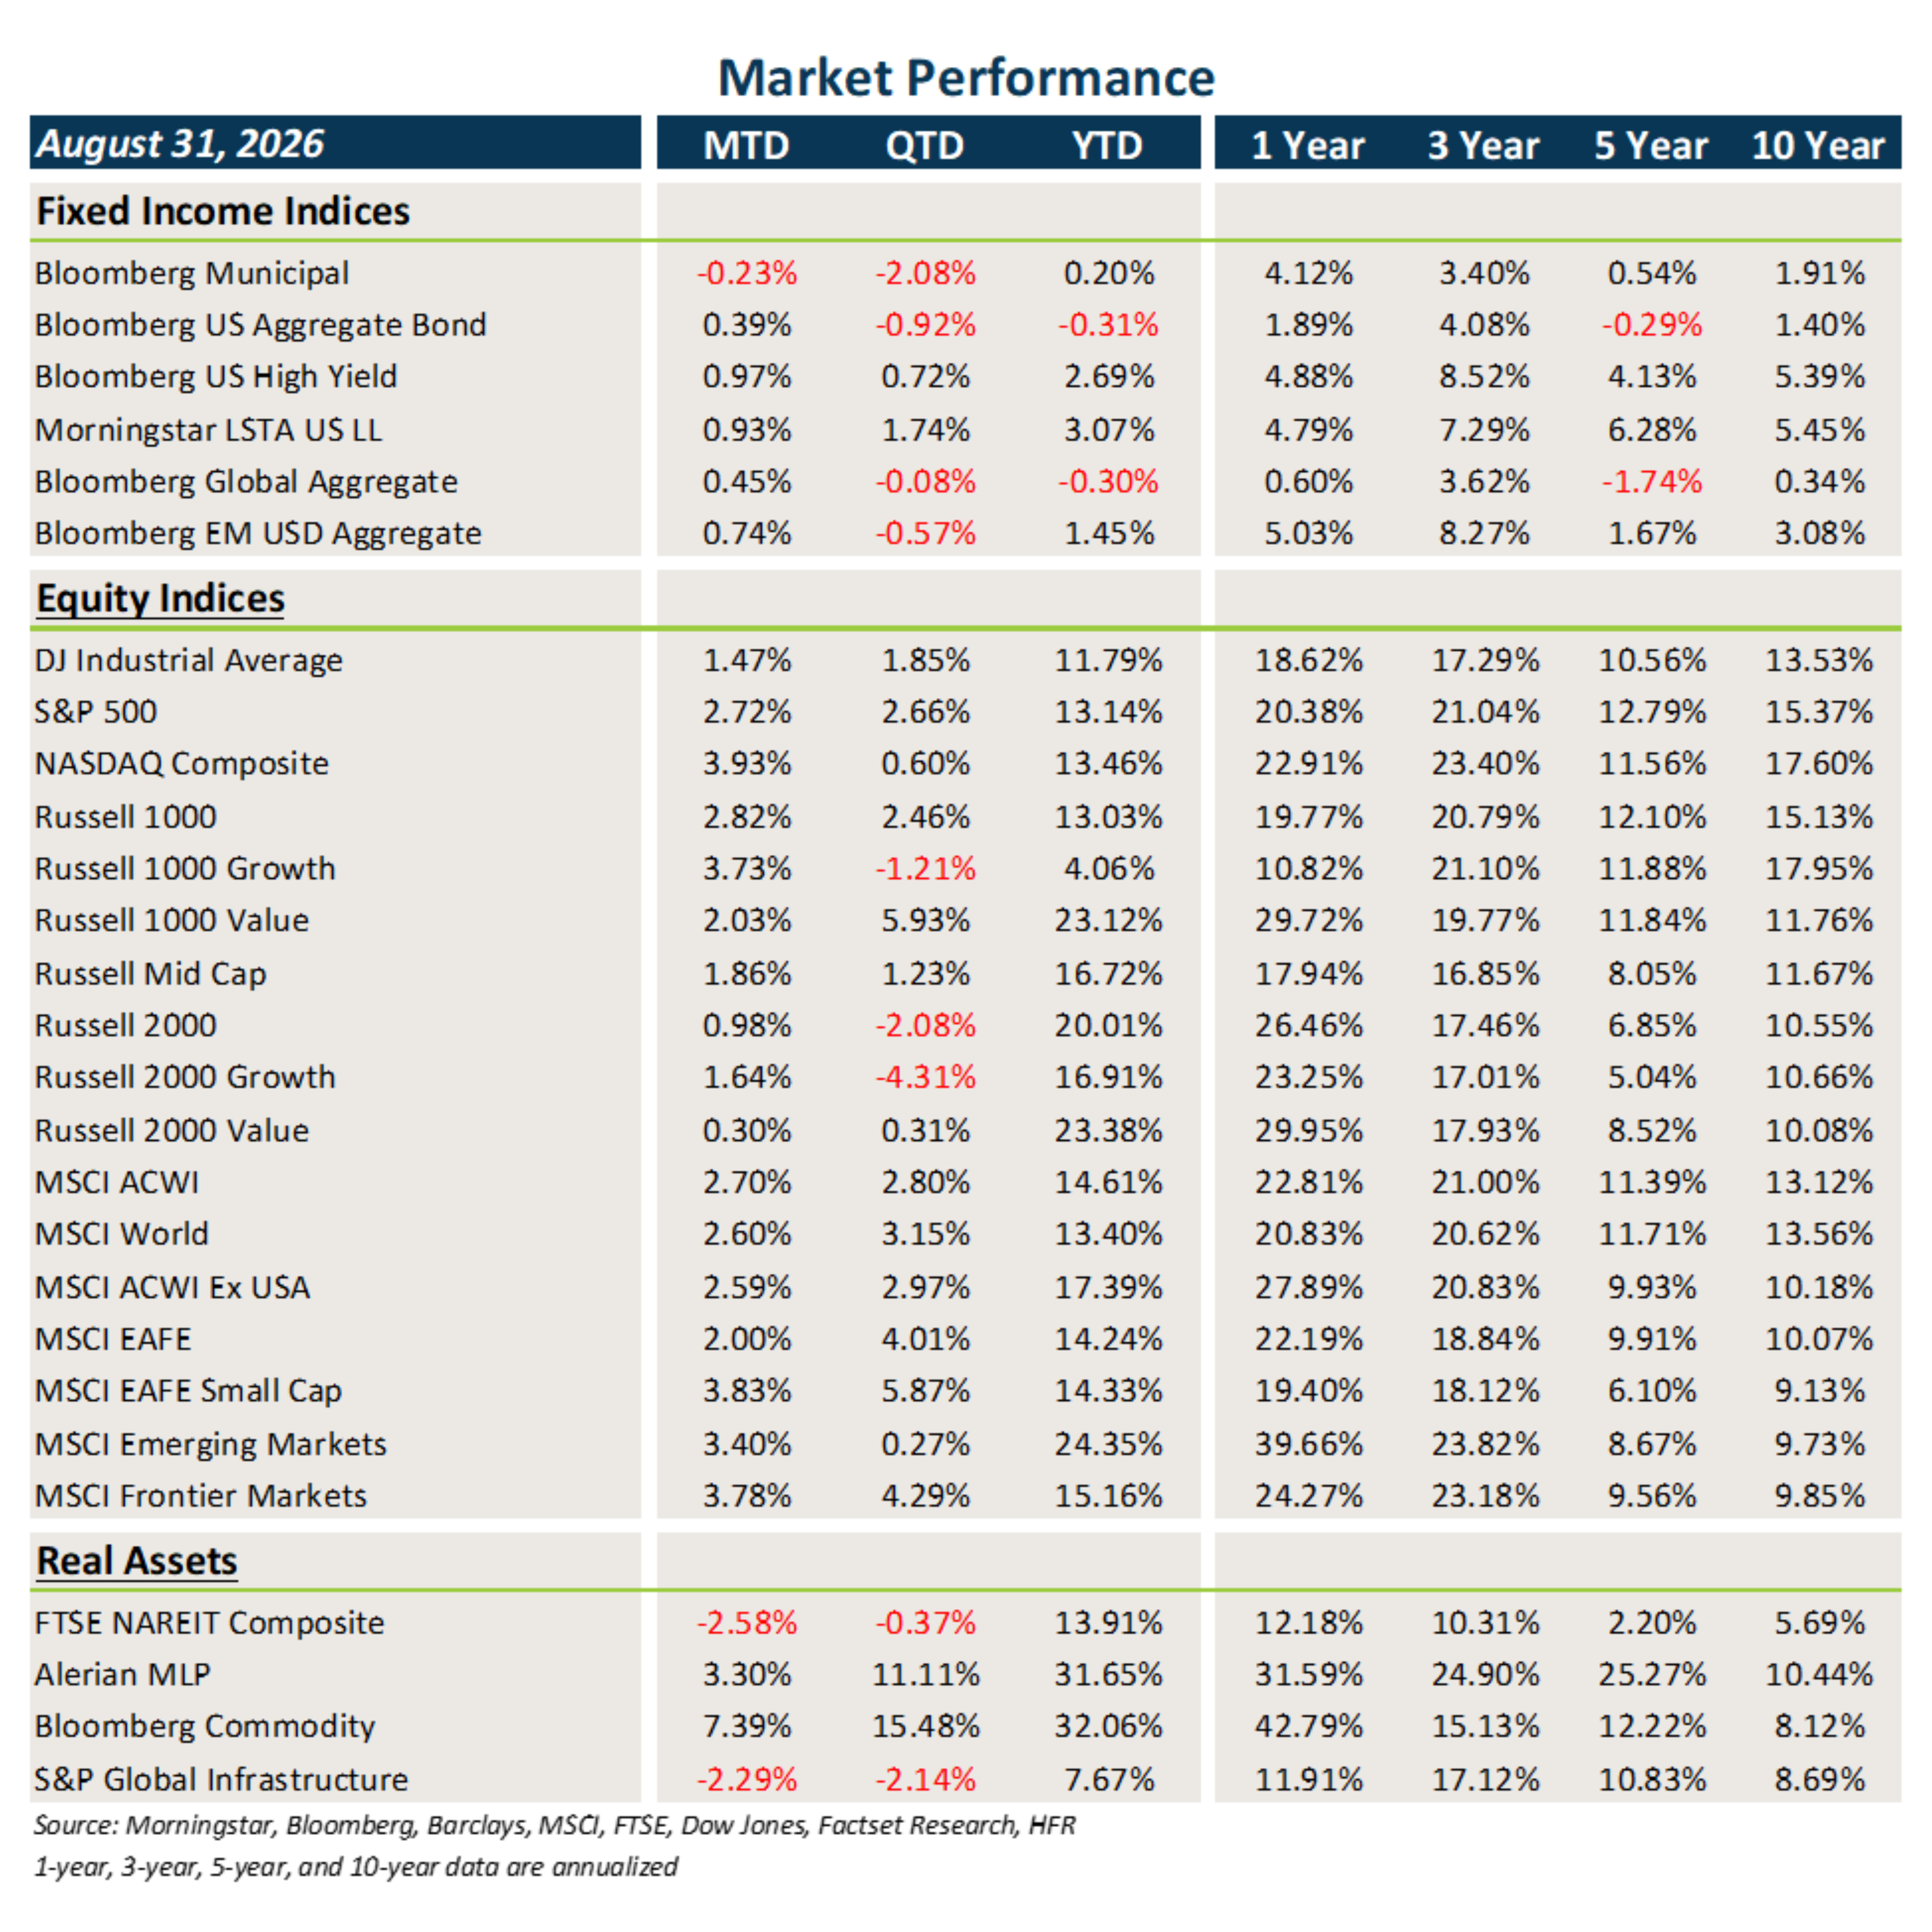
Market Performance (as of 8/31/26)
Fixed Income
- After surging higher in July, interest rates were generally rangebound in August.
- Core fixed income posted modest gains last month, but munis ended the month negative due to unfavorable technicals.
- Credit featured another month of largely clipping coupons while bonds outside the U.S. got an added boost from the weaker U.S. dollar.
U.S. Equities
- U.S. equities gained ground across the board in August, led by the rebound in growth/tech stocks.
- Large caps outpaced small caps, and growth beat value across all market caps.
- 2026 is the fourth straight year of strong equity market gains and a pullback seems long overdue. Ultimately much will depend on geopolitical developments and future earnings growth.
Non-U.S. Equities
- Equities outside the U.S. posted positive returns in August, driven by emerging markets and growth/tech stocks.
- Small caps beat large caps outside the U.S., and growth stocks outperformed value stocks.
- EMs were driven by Eastern Europe and Asia ex-China.
- The weaker USD added 57 bps to EAFE returns and 152 bps to EM returns.
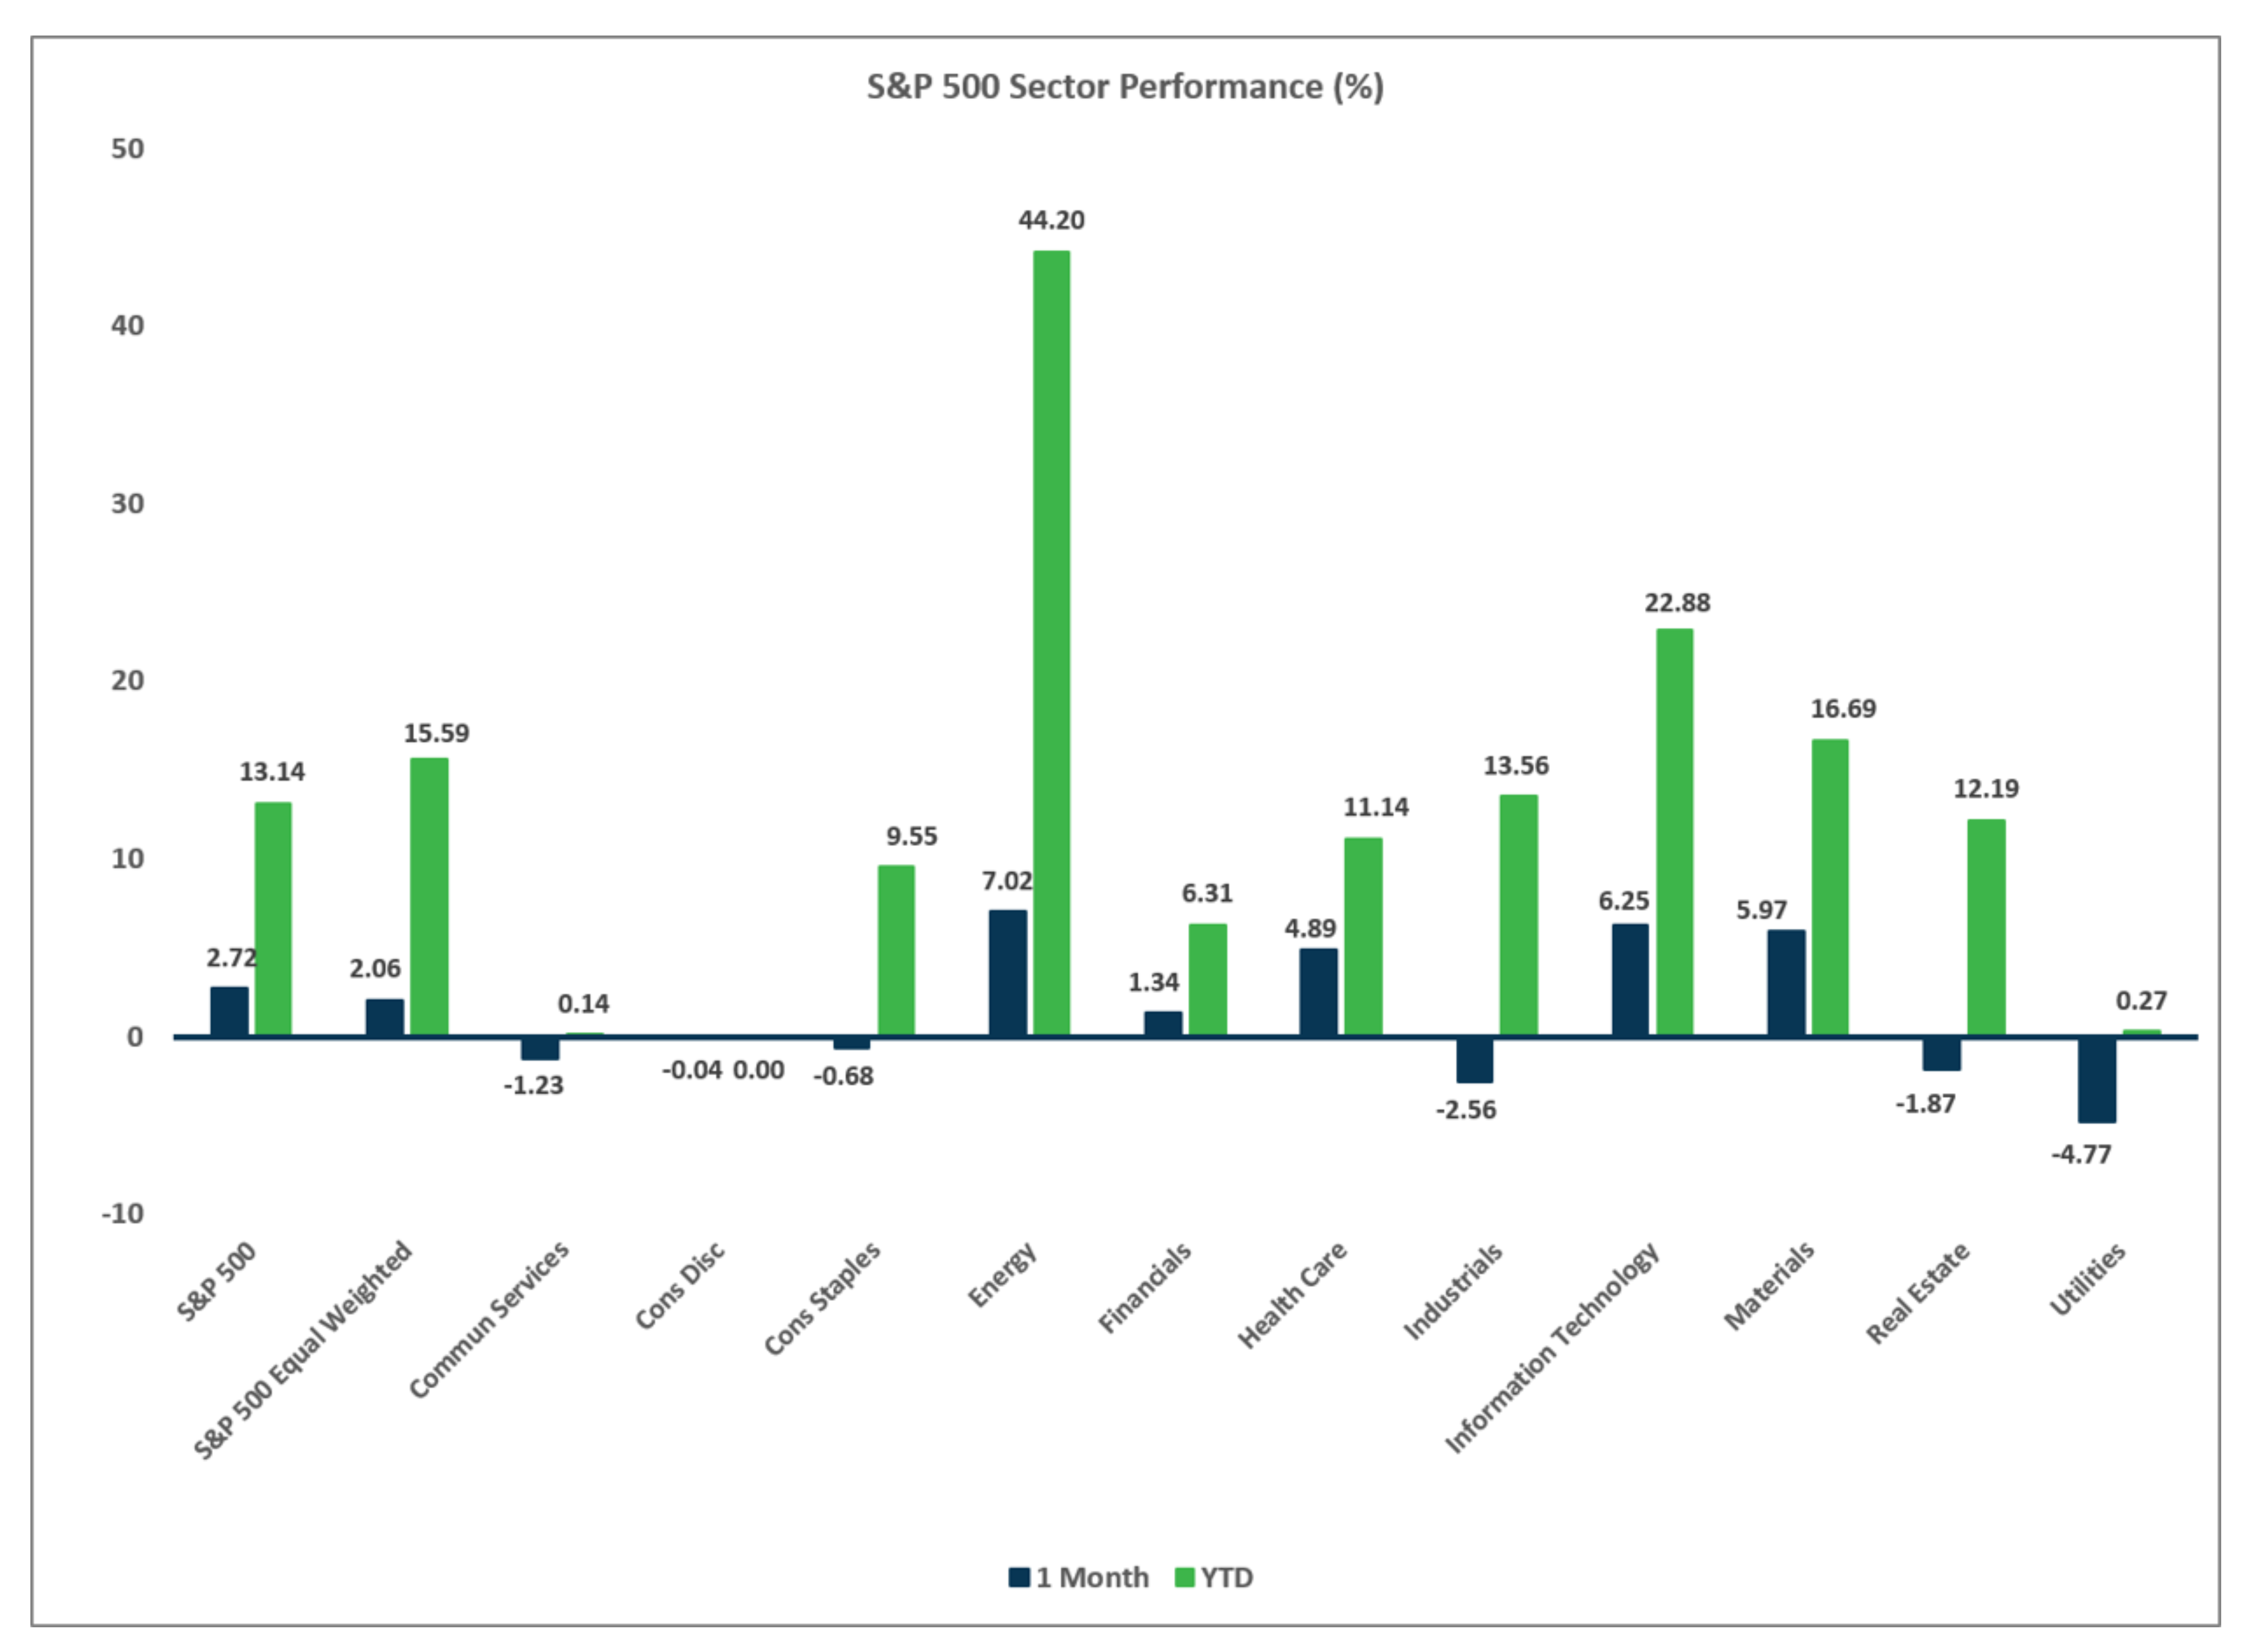
Sector Performance – S&P 500 (as of 8/31/26)
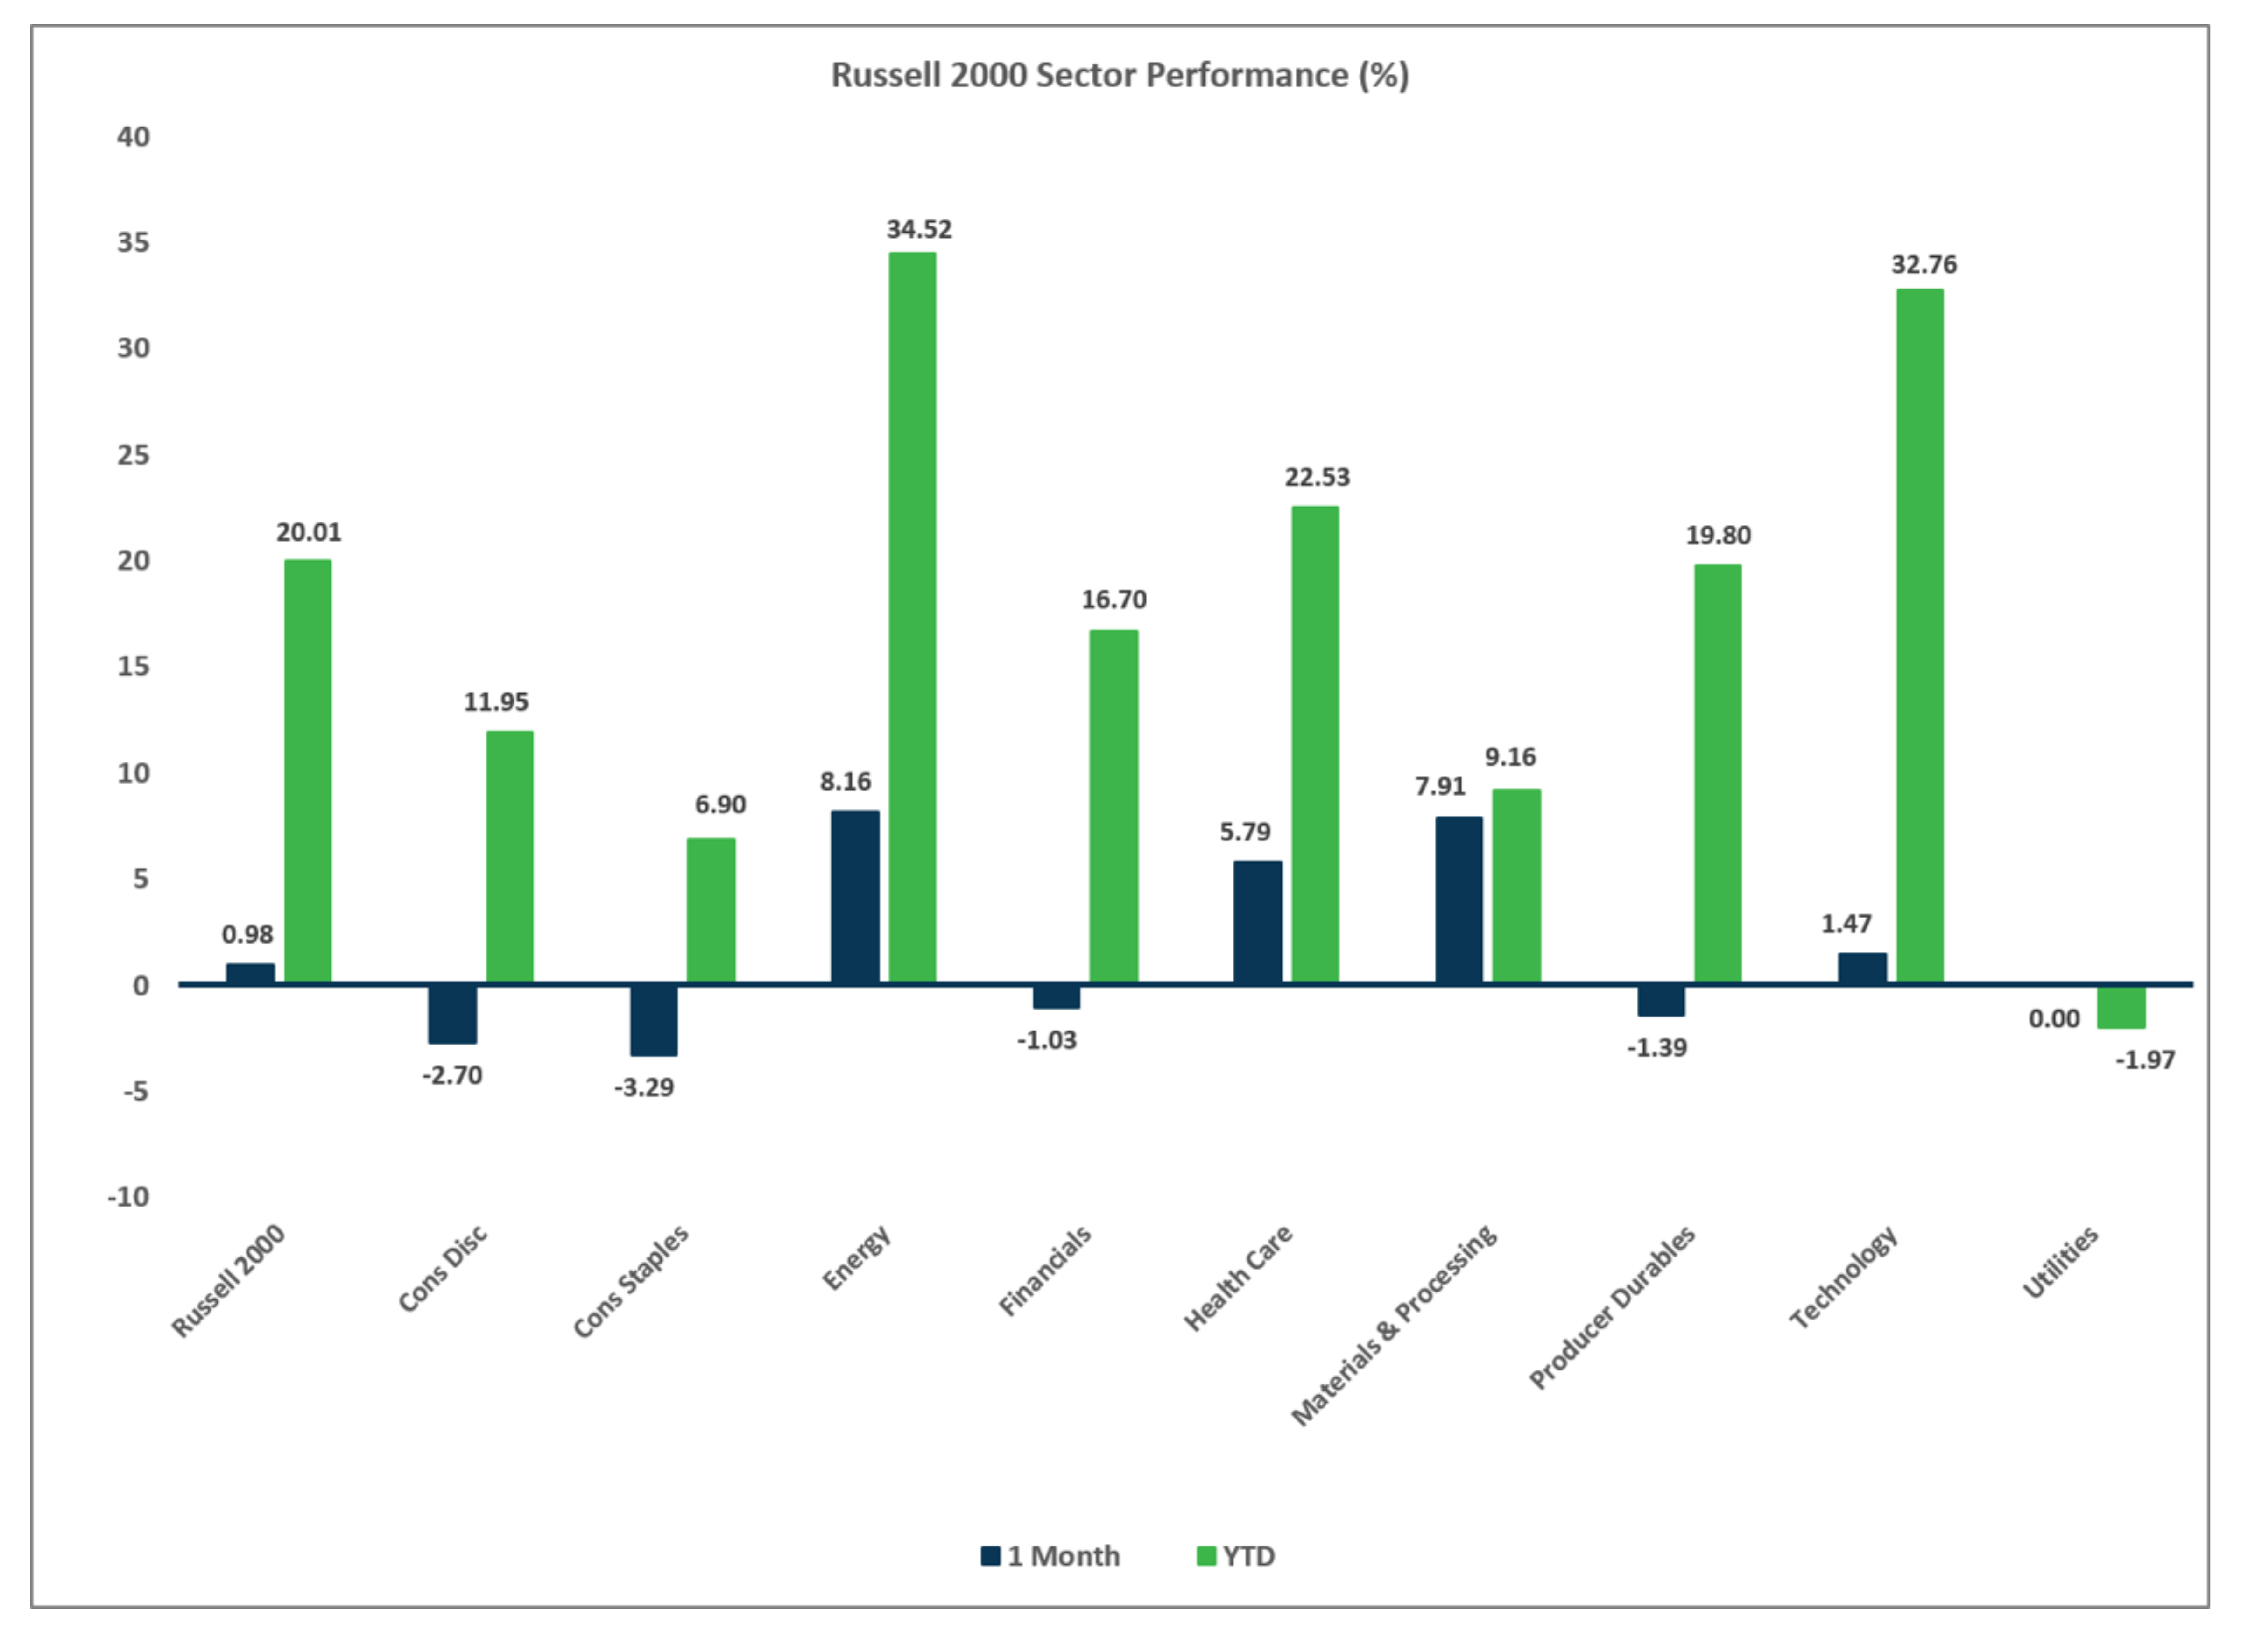
Sector Performance – Russell 2000 (as of 8/31/26)
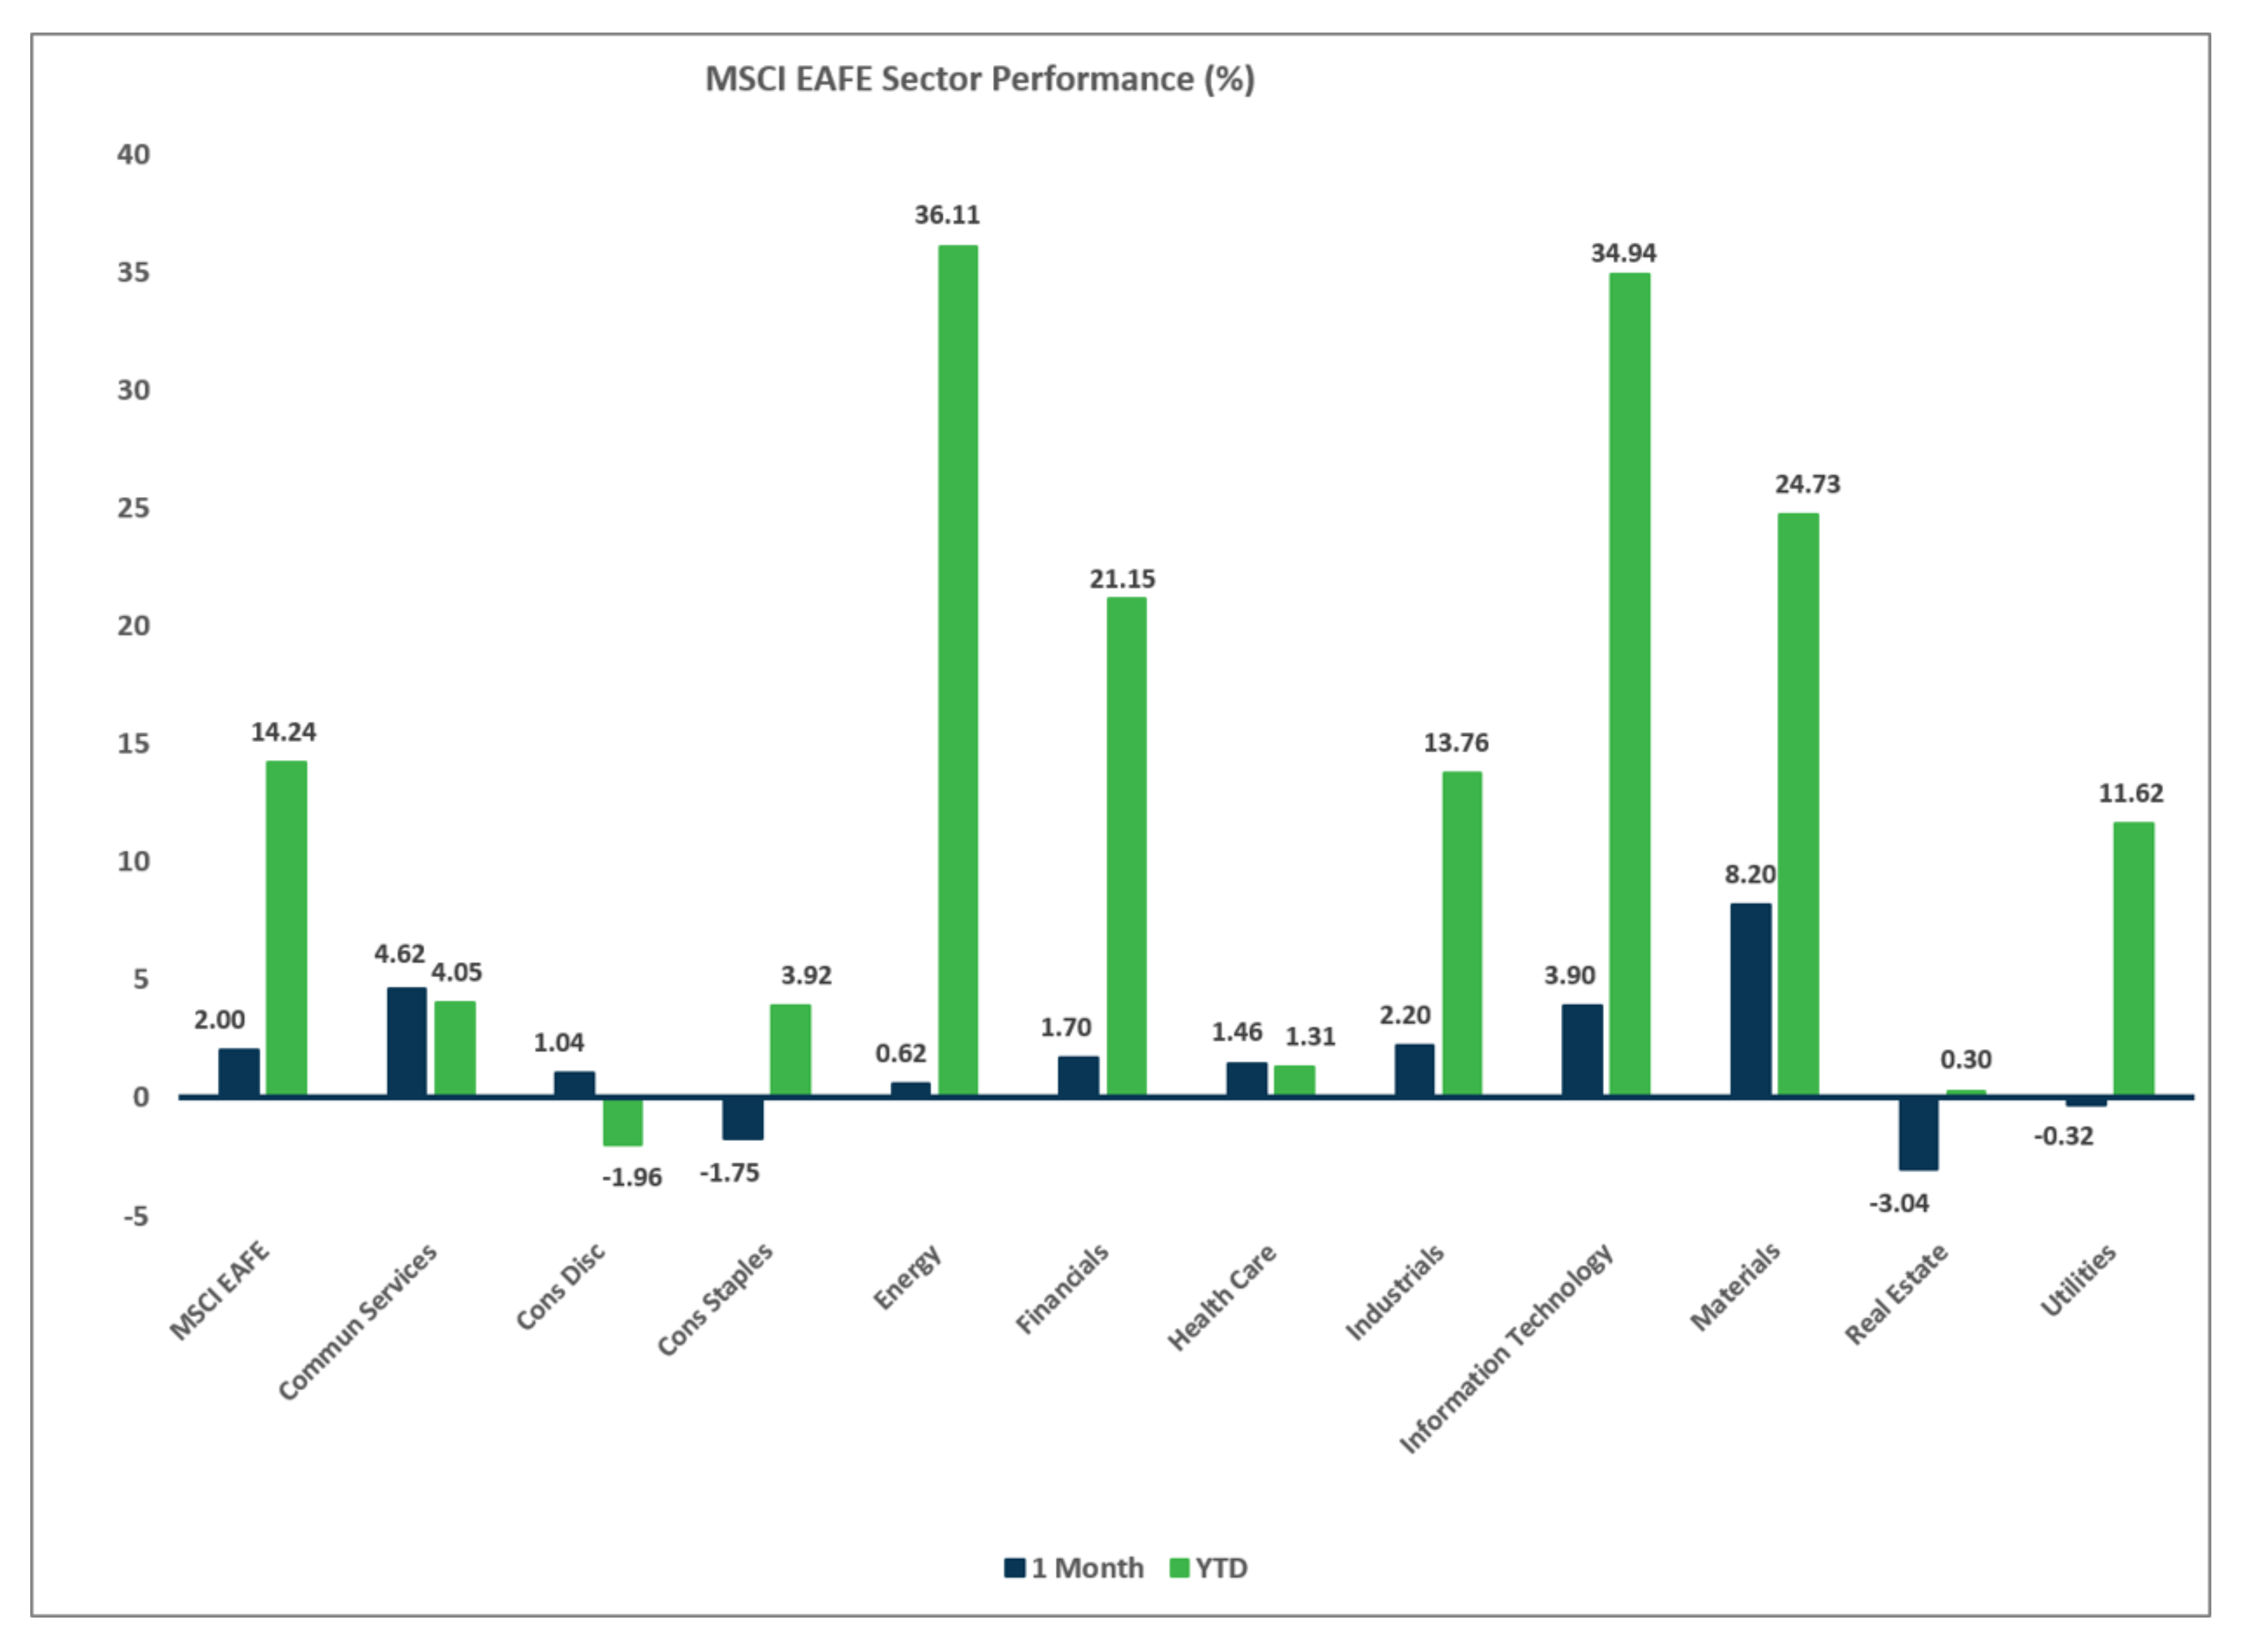
Sector Performance – MSCI EAFE (as of 8/31/26)
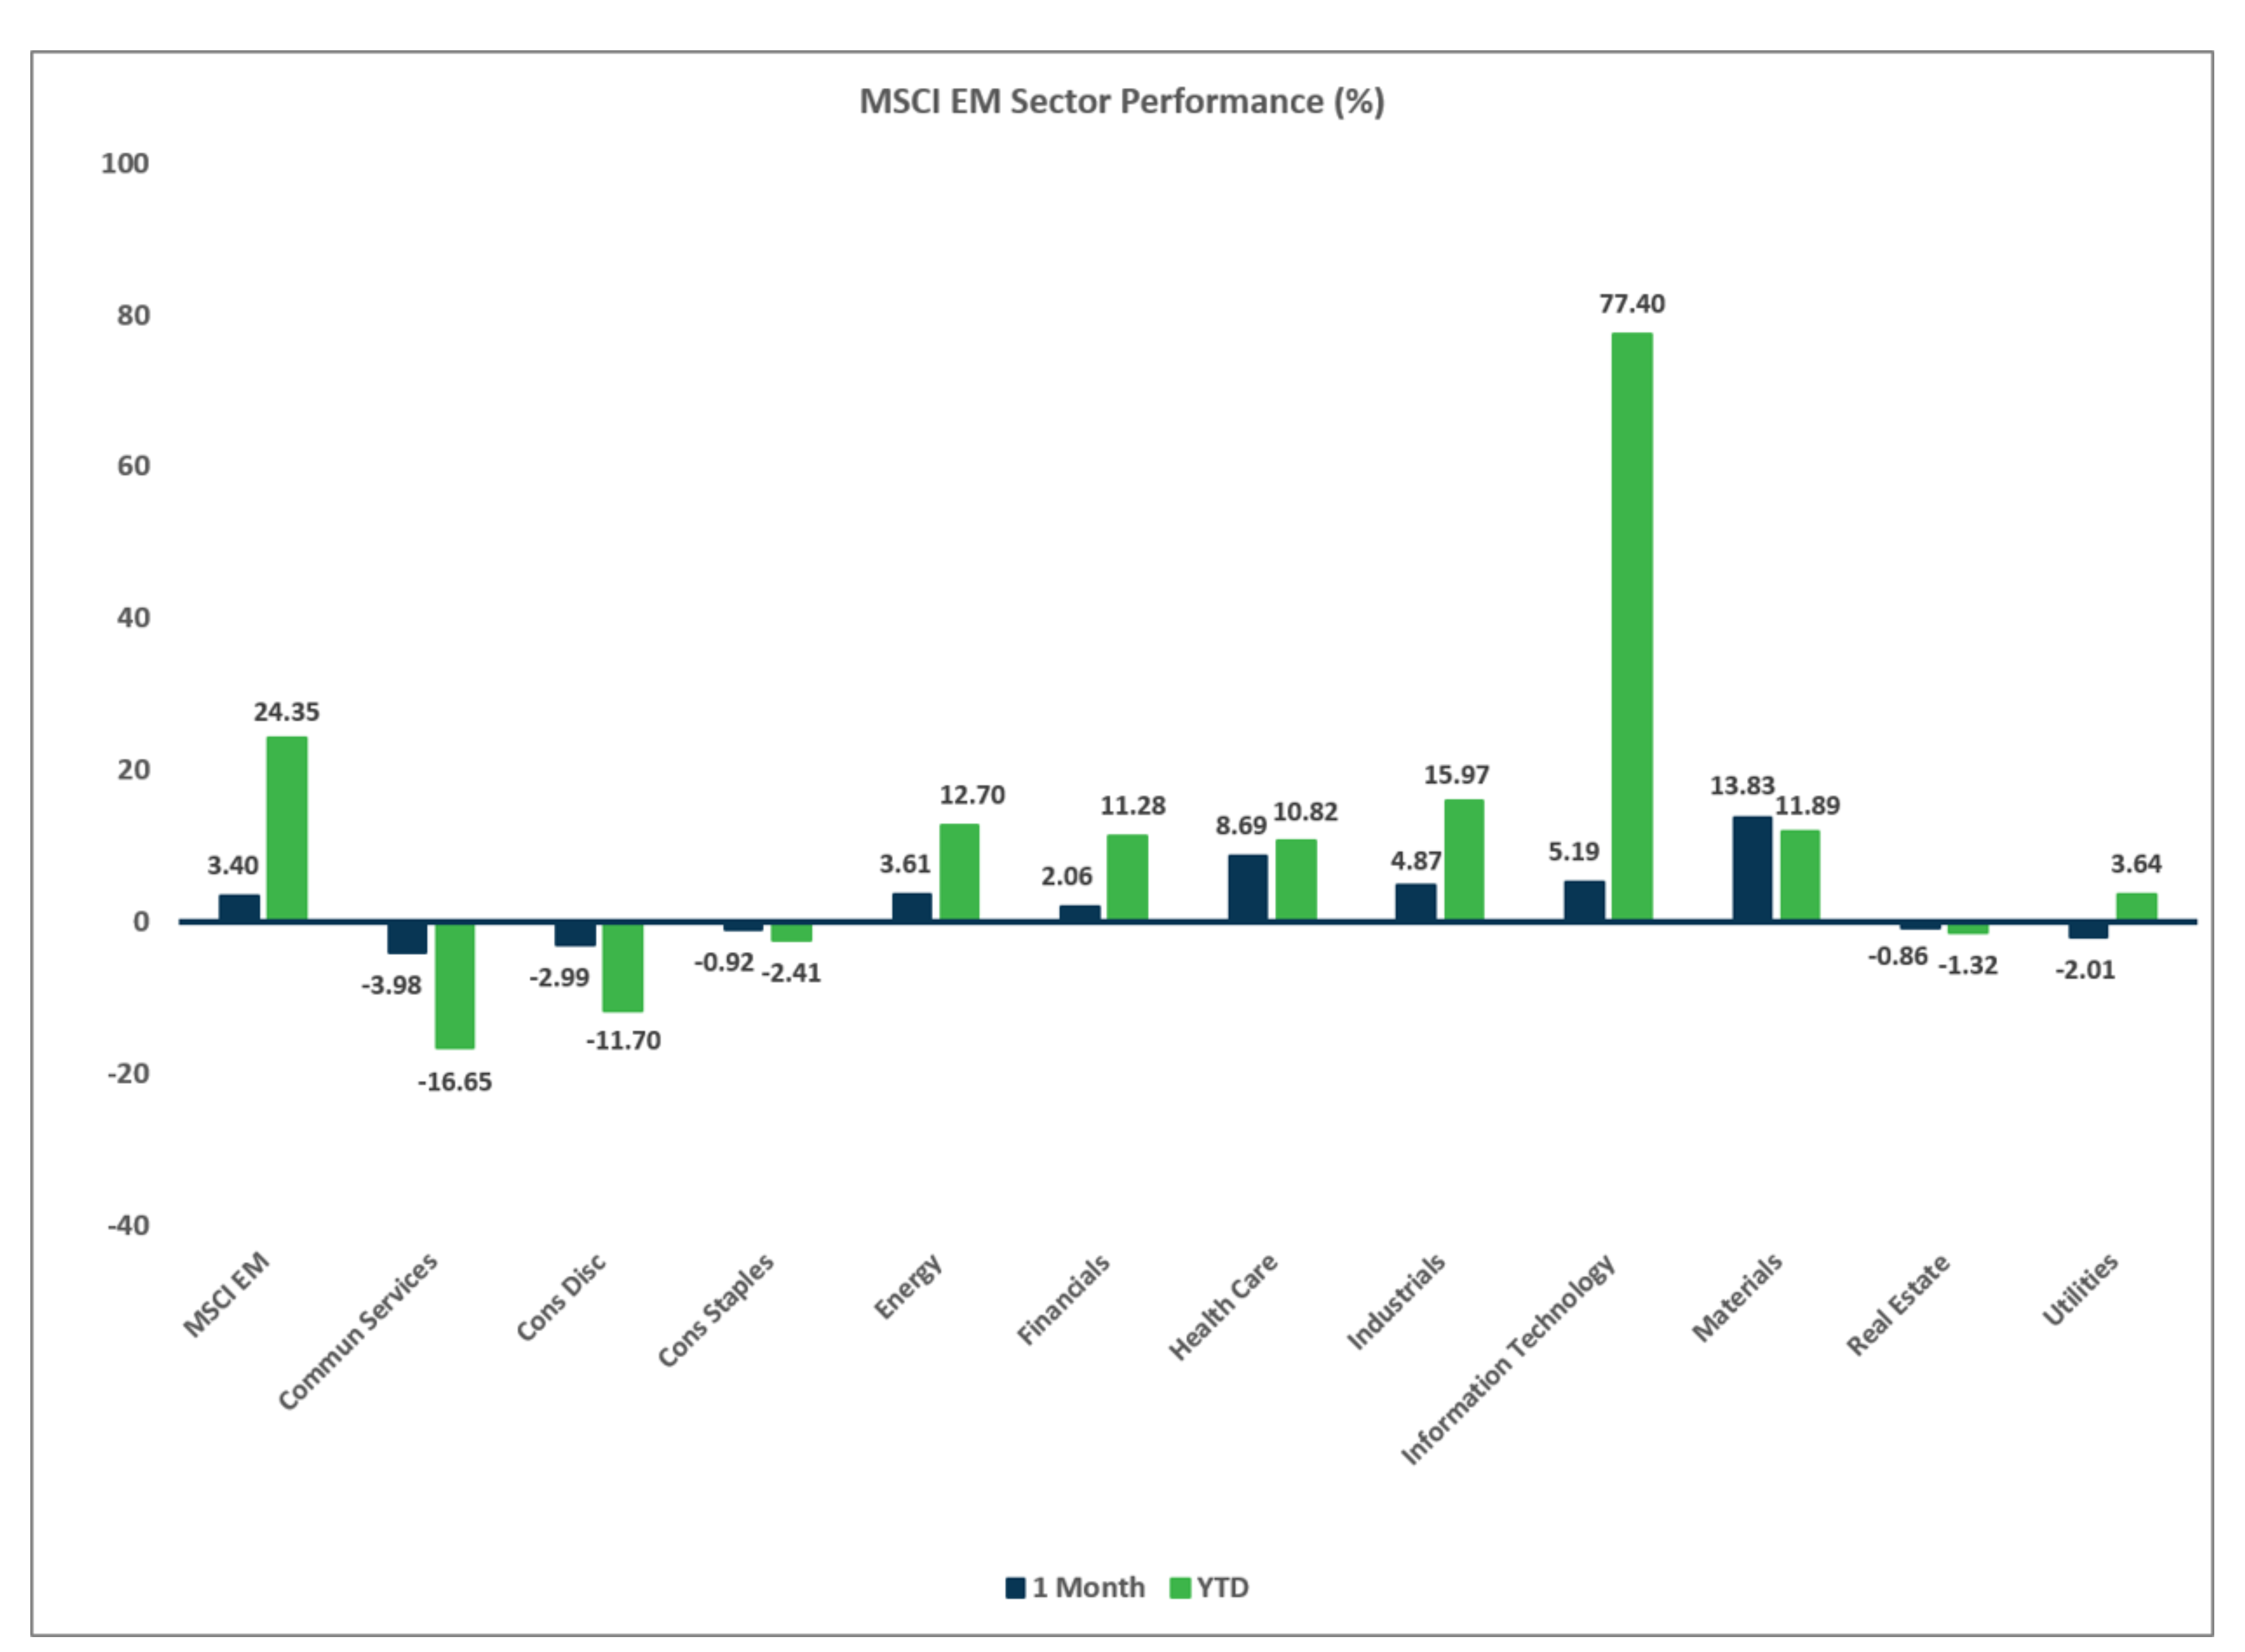
Sector Performance – MSCI EM (as of 8/31/26)
Disclosures
Investment services offered by Enterprise Bank & Trust are not deposits, obligations, or guaranteed by the bank or its affiliates. The information provided represents the opinions of Enterprise Bank & Trust and is not intended to forecast future events or guarantee future results. Past performance does not guarantee future returns. This information is for educational purposes only. Investors should consult with their investment professionals for advice concerning their particular situation.
Investments are: *Not FDIC insured *May lose value *Not financial institution guaranteed *Not a deposit *Not insured by any federal government agency.

