
July 2026 Market Update

Economic Highlights
United States
- U.S. GDP growth of 1.5% in Q2 was slightly below the 1.8% consensus expectation and the 2.1% annualized rate reported in Q1. While the GDP number was below expectations, the miss appeared to come from a decline in federal government spending and inventories. Other parts of the economy appeared strong. Personal spending rose 2.1% after eking out a 0.4% gain in Q1. However, inventories fell 0.7% and federal spending was off 0.3%.
- Job growth in the U.S. slowed a bit in June, with only 57,000 new jobs added to the economy, below the 115,000 expectation. The unemployment rate, however, dropped to 4.2%, largely due to a slump in the labor force participation rate, which fell 0.3% to 61.5%, the lowest since March 2021. Prior months also saw significant downward revisions. The May total, which had been much stronger than economists anticipated, was cut by 43,000, while April’s figure came down 31,000 to 148,000, as the report showed labor market growth significantly slower than previously thought. Finally, wages grew 0.3% M/M or 3.5% Y/Y.
- Consumer prices rose 3.5% annually in June, less than expected as energy prices eased to near pre-war levels. The June CPI report showed headline inflation fell 0.4% M/M but rose 3.5% Y/Y while core CPI was flat M/M but increased at an annual clip of 2.6%. The easing of prices came from a big decline in energy and a decrease in services costs, particularly for housing. Energy declined 5.7% M/M but has still gained more than 15% Y/Y. Food prices jumped 0.2% in June and shelter costs increased just 0.1%. The Federal Reserve’s preferred inflation gauge, the PCE Index, showed headline inflation of 3.7% Y/Y in June, with core PCE coming in at an annualized rate of 3.3%. As the labor market picture has stabilized, the Fed remains laser-focused on inflation and interest rates.
- Spending at U.S. retailers last month was weaker than expected, despite the World Cup drawing tourists from around the world and online sales events. Retail sales rose 0.2% in June from the prior month, down sharply from May’s revised 1% increase. Excluding sales at gas stations, spending in June was up by a solid 0.7%. Overall spending was buoyed by the World Cup and Amazon’s Prime Day, although spending at gas stations declined 5.3%.
Non-U.S. Developed
- The eurozone flash composite PMI returned to expansion territory in July, hitting a 5-month high reading of 51.9 (up from 50.0 in June). The increase in output reflected both a renewed rise in services business activity and a faster expansion in manufacturing production. The solid growth in manufacturing output seen in July was the sharpest since March 2022. The eurozone’s largest economy, Germany, saw business activity increase for the first time in four months. Meanwhile, French output continued to fall, but only marginally. The latest data suggest eurozone growth of about 0.3% Q/Q, but the uncertain geopolitical environment will continue to provide a strong headwind.
- Eurozone economic growth beat expectations, but growth by member countries was all over the map. Growth of 0.4% Q/Q, was better than the 0.2% estimate and the flattish growth reported last quarter. Ireland reported the strongest level of growth at 3.9% Q/Q, while Germany and France both reported subdued growth of 0.2%. Germany’s growth slowed from Q1 and France remained weak overall.
Emerging Markets
- China’s economy expanded by 4.3% in Q2, its weakest pace since Q4 2022. The weak print reinforced calls for more policy stimulus as an accelerating slide in investments deepened the strain on growth, while consumption remained subdued. China’s Q2 growth came in below the People’s Bank of China’s full-year growth target range of 4.5% to 5%. Robust industrial production and exports tied to the global artificial intelligence (AI) investment boom continue to power headline growth, but trends in private investment and consumption are a bit troubling and may require further support measures. Exports remain the bright spot in an otherwise cooling economy. Other key data showed retail sales rebounded 1% in June and industrial output surged 5.3% Y/Y.
- China’s official manufacturing PMI fell back into contraction territory, largely due to a slump in domestic demand and typhoon-related production disruptions. The official reading came in at 49.2 in July, down from 50.3 in June. The headline figure was dragged down by the new orders sub-index, which fell to 48.5, the lowest in 38 months. The RatingDog China Manufacturing PMI declined to a four-month low of 50.9 in July 2026 from 51.7 in June, as output and new orders grew more slowly.
- China's official Non-Manufacturing PMI fell to 49.0 in July 2026 from 50.2 in June, pointing to a renewed contraction after two months of modest expansion. Business activity, new orders and employment all weakened in July.
- South Korea's economy grew faster than expectations in Q2, driven by a semiconductor export boom powering AI and digital infrastructure. GDP rose 0.6% Q/Q or 3.7% Y/Y. Growth was driven by a 1.4% gain in exports. Taiwan saw its third straight quarter of double-digit economic growth, with an annualized reading of 12.9% in Q2. Exports were strong, but domestic demand also provided a strong boost in Q2.
Market Performance (as of 7/31/26)
Fixed Income
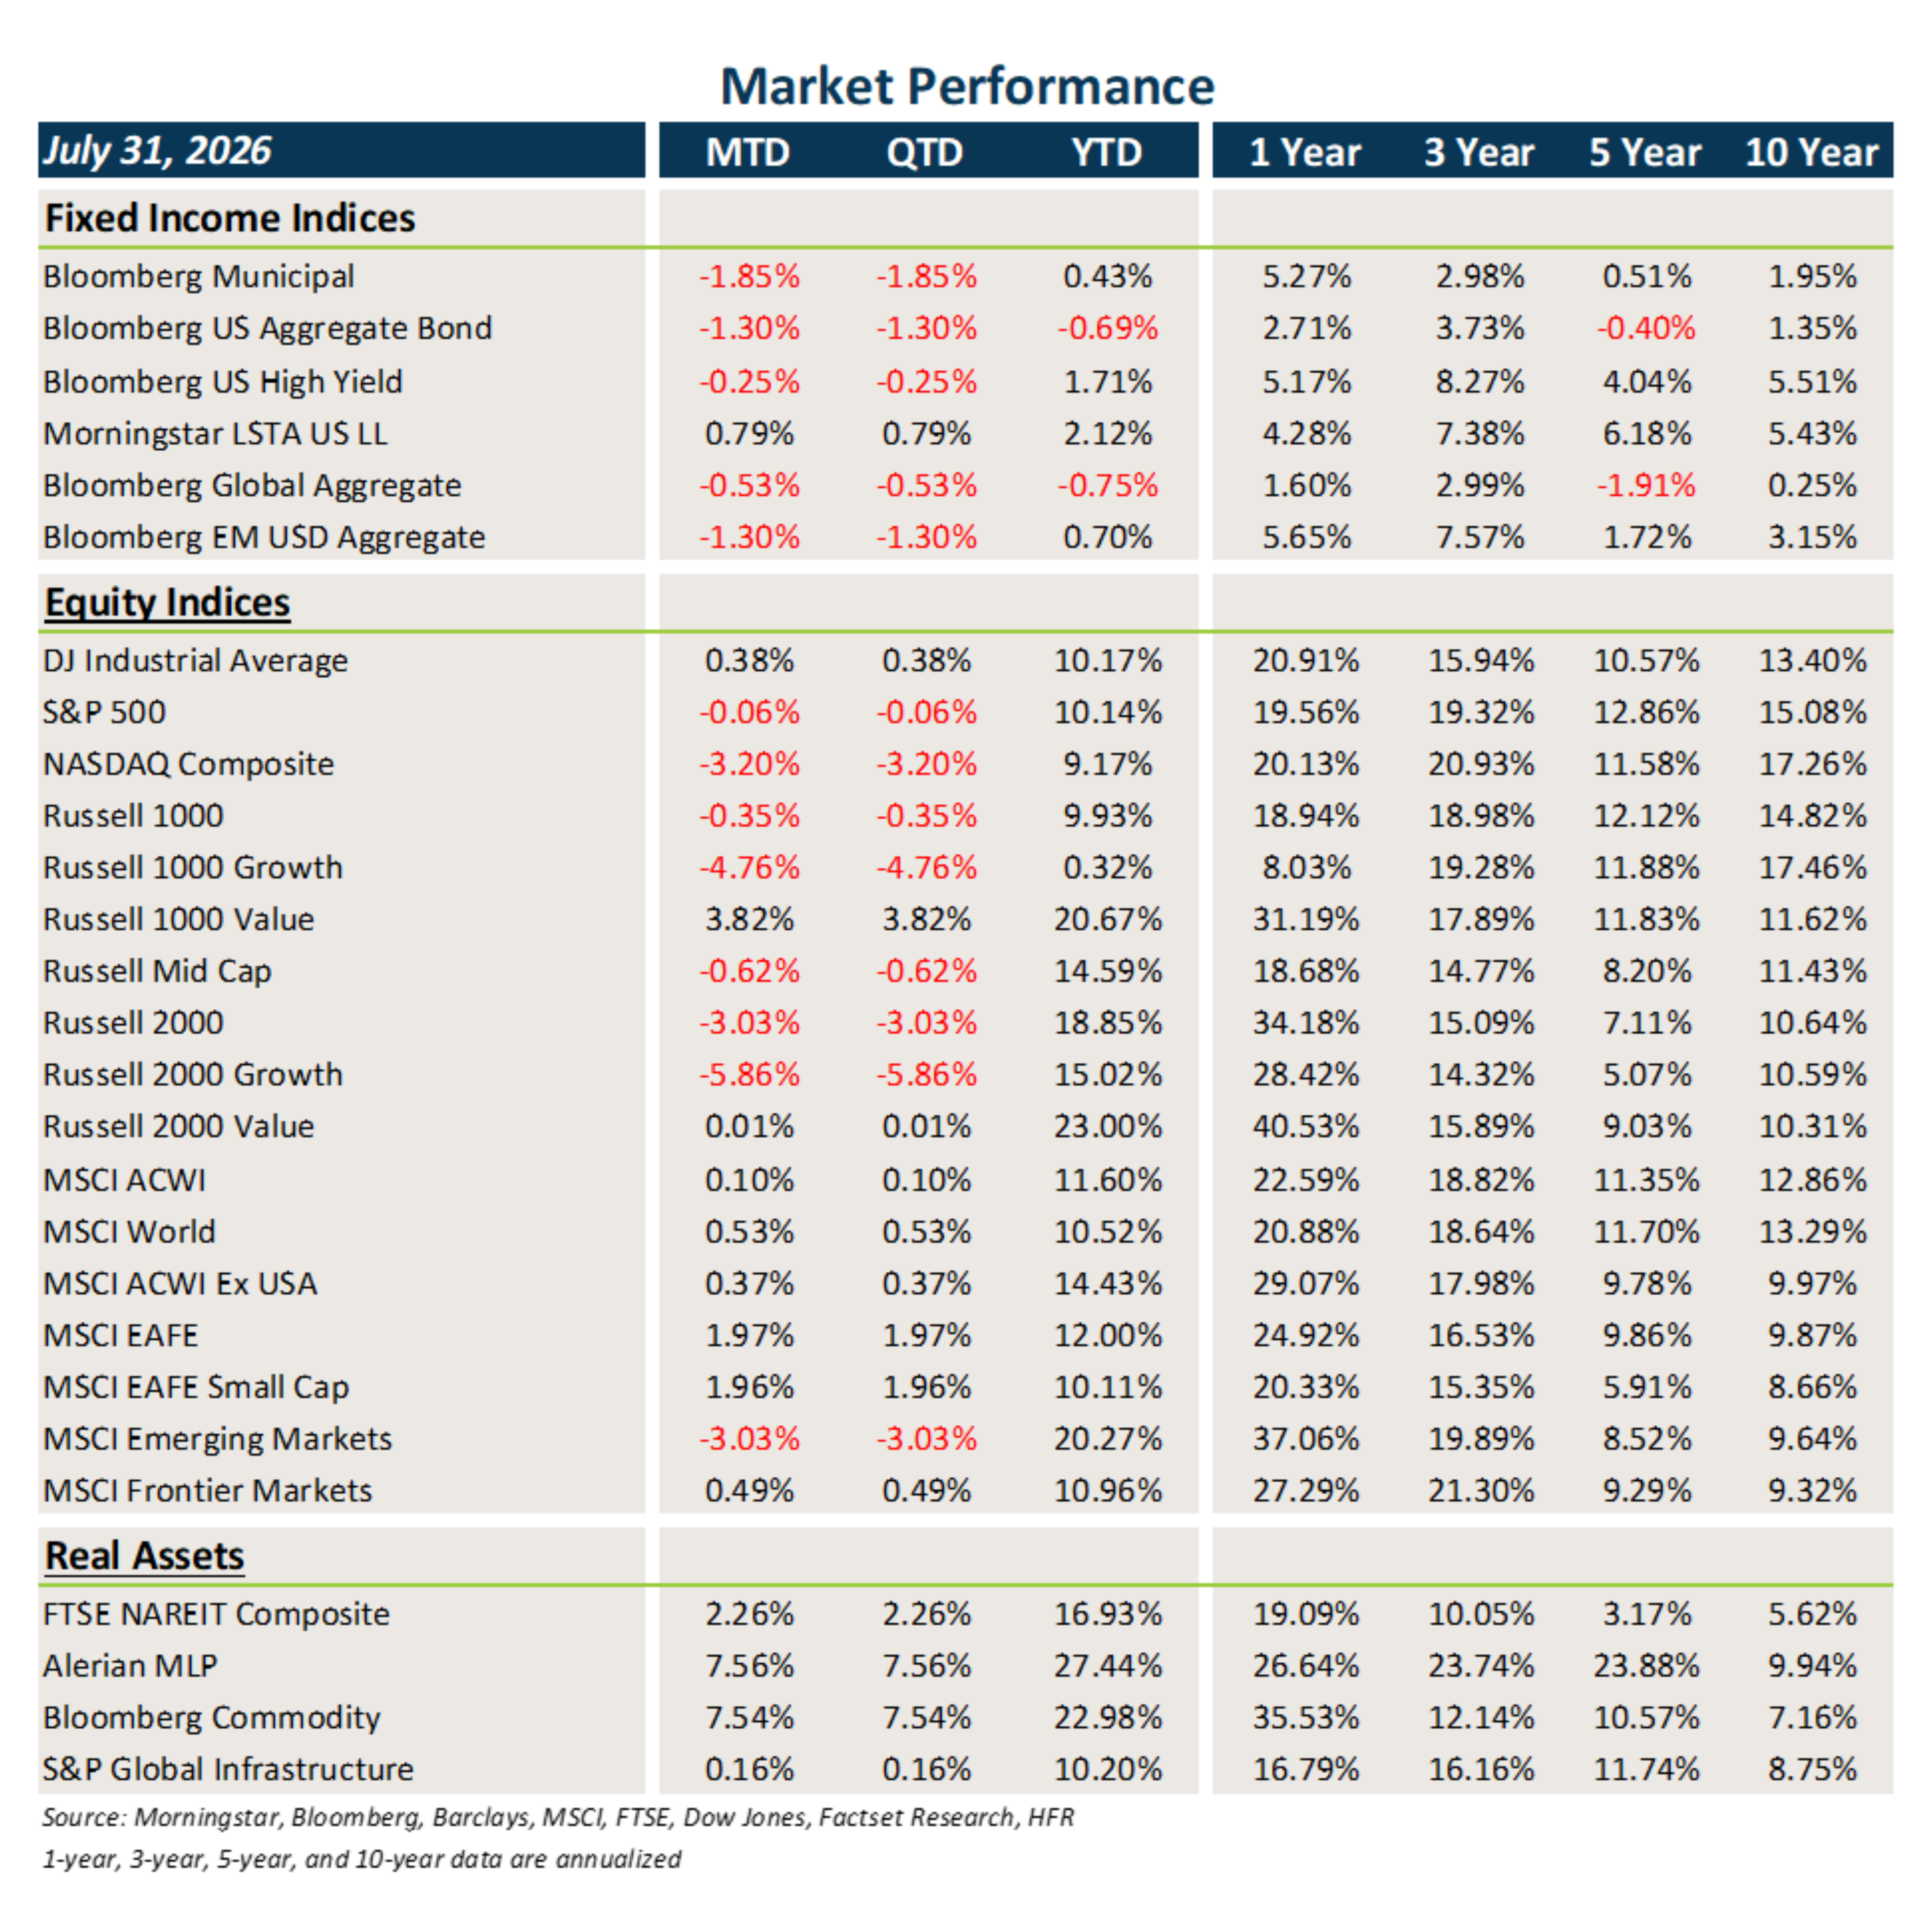
- Interest rates and Treasury yields continued their march higher in July, leading to losses in most areas of fixed income.
- Core fixed income and municipal bonds shed ground in July.
- Credit was mostly negative during July, driven primarily by spread widening and the overall move higher in rates.
- Floating rate loans eked out a small gain, providing some insulation against higher interest rates.
U.S. Equities
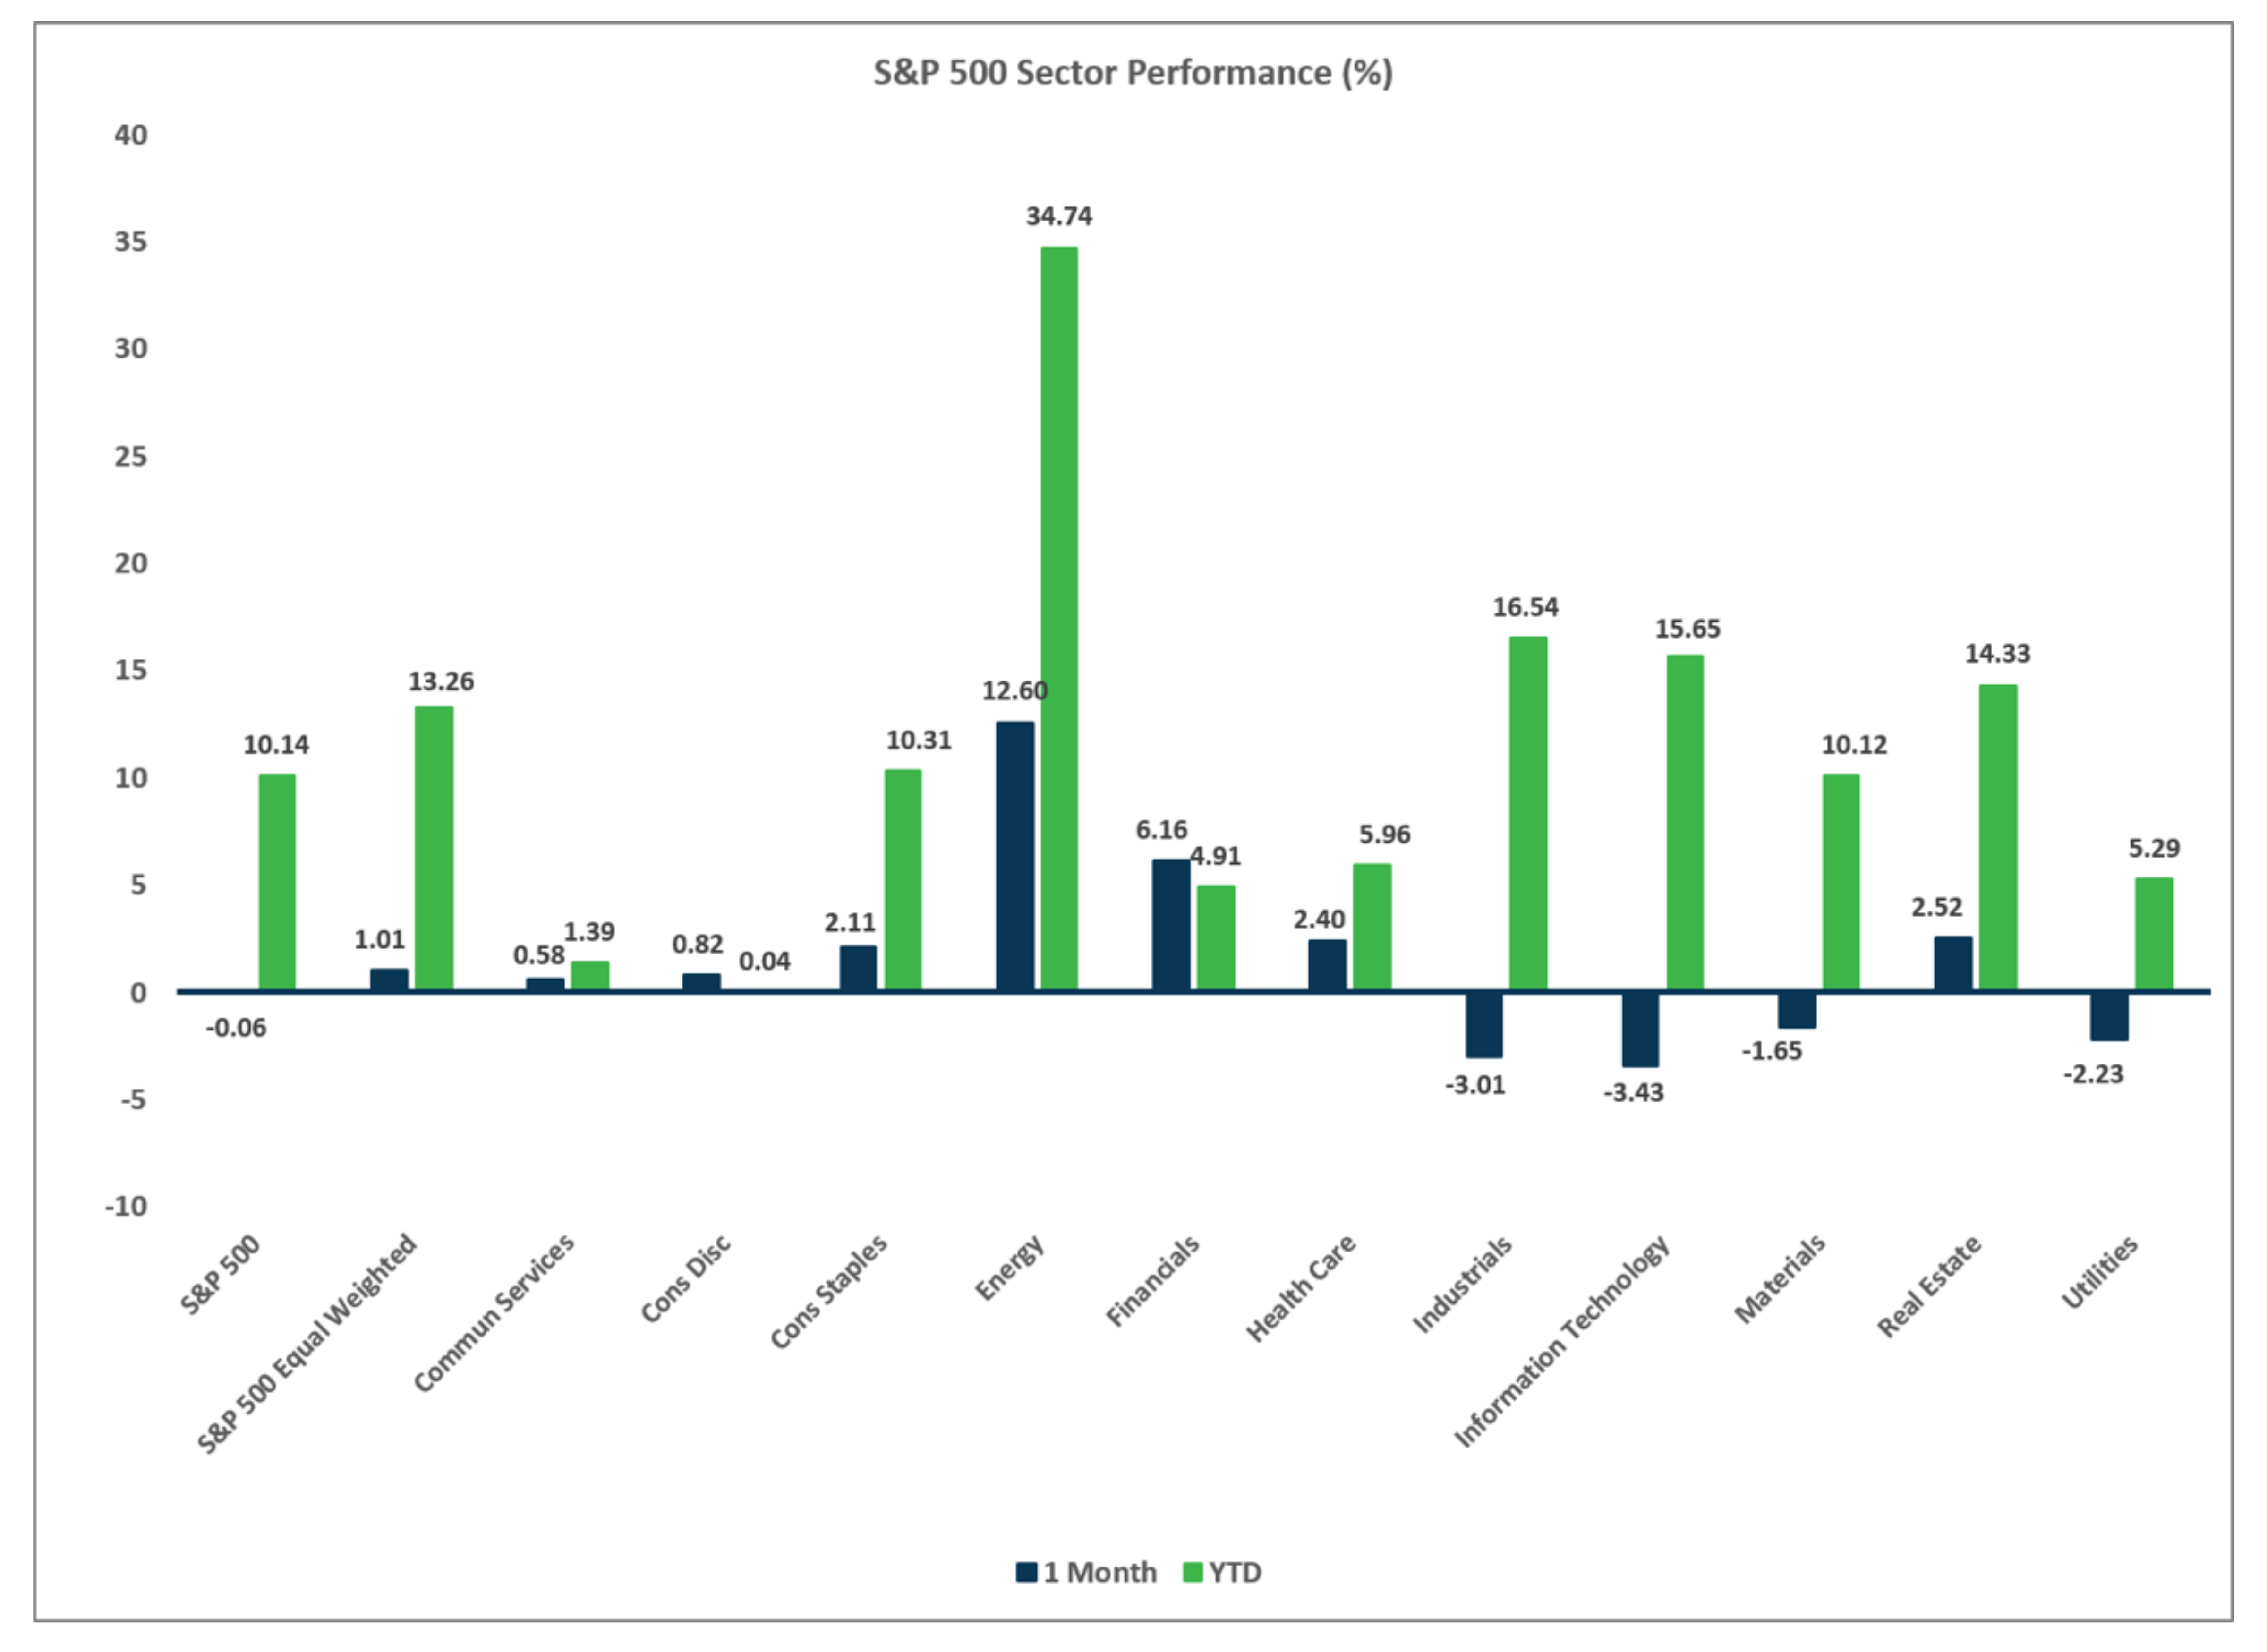
- U.S. equities were mostly negative in July, led by the selloff in growth/tech stocks leveraged to the AI buildout trade.
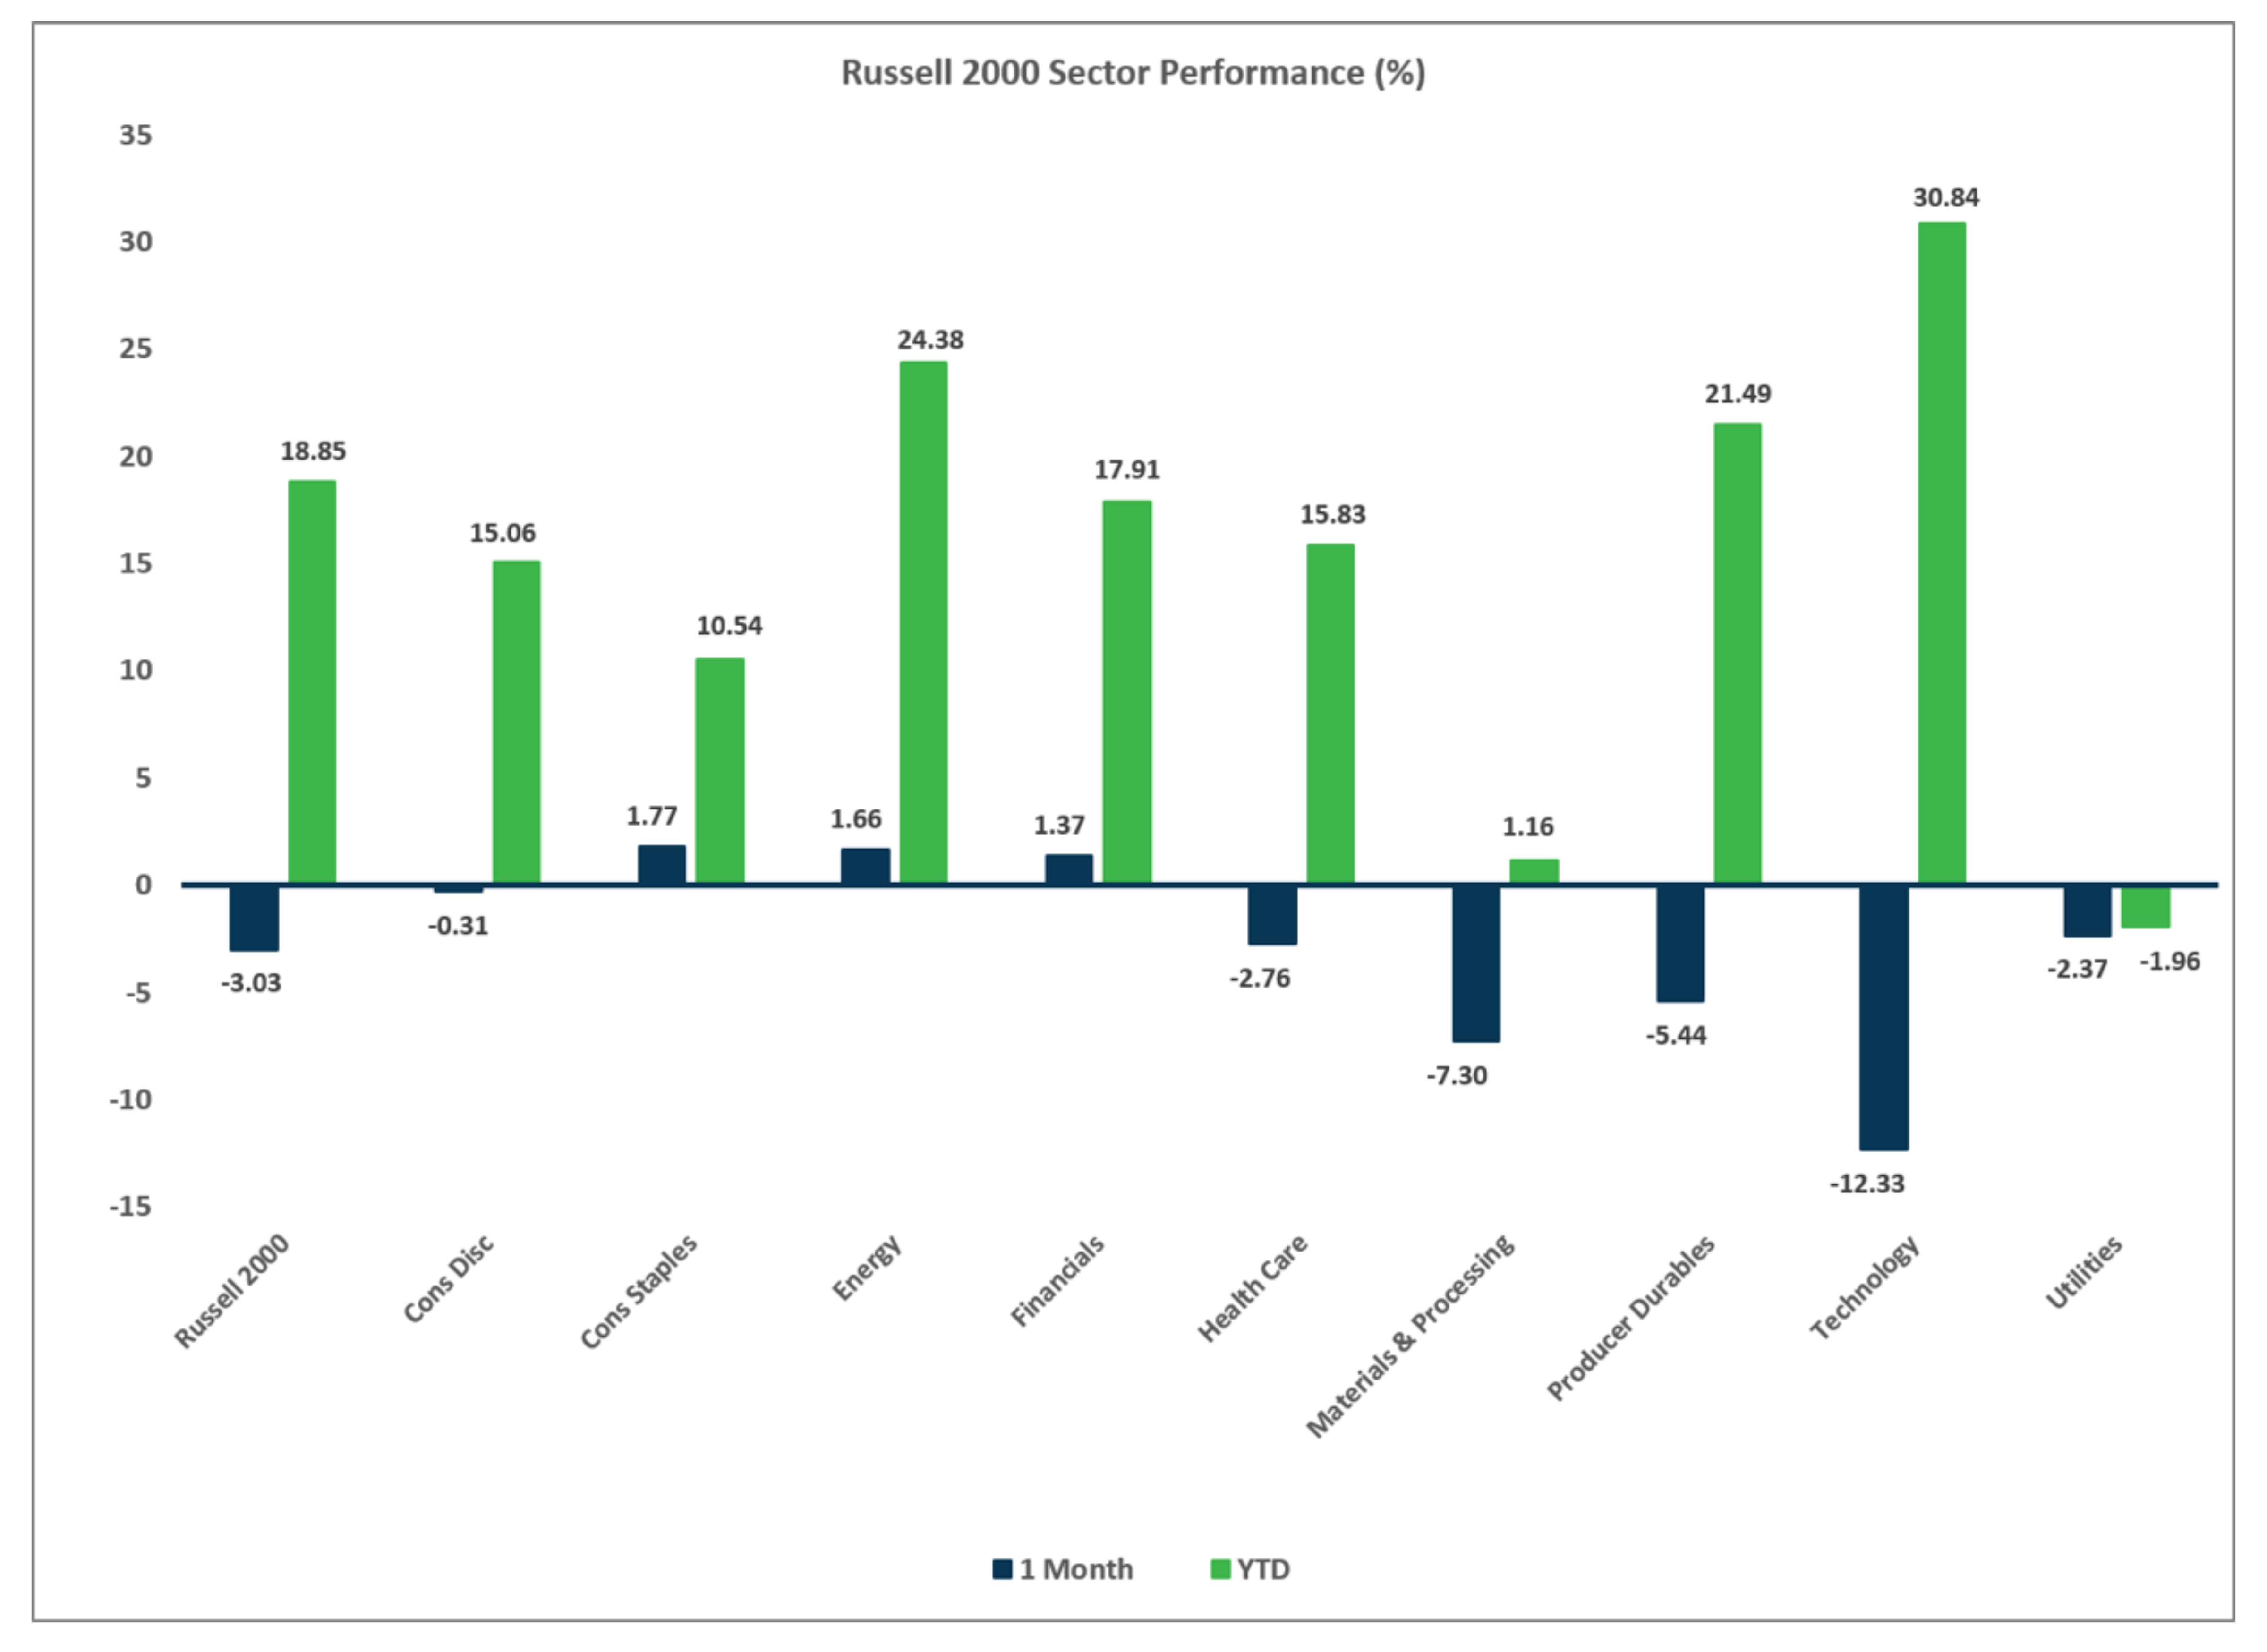
- Value trounced growth stocks across all market capitalizations, and large caps provided some protection against small caps.
- Earnings have been exceptional, and we are encouraged by the broadening out of markets and better recent stock picking results.
Non-U.S. Equities
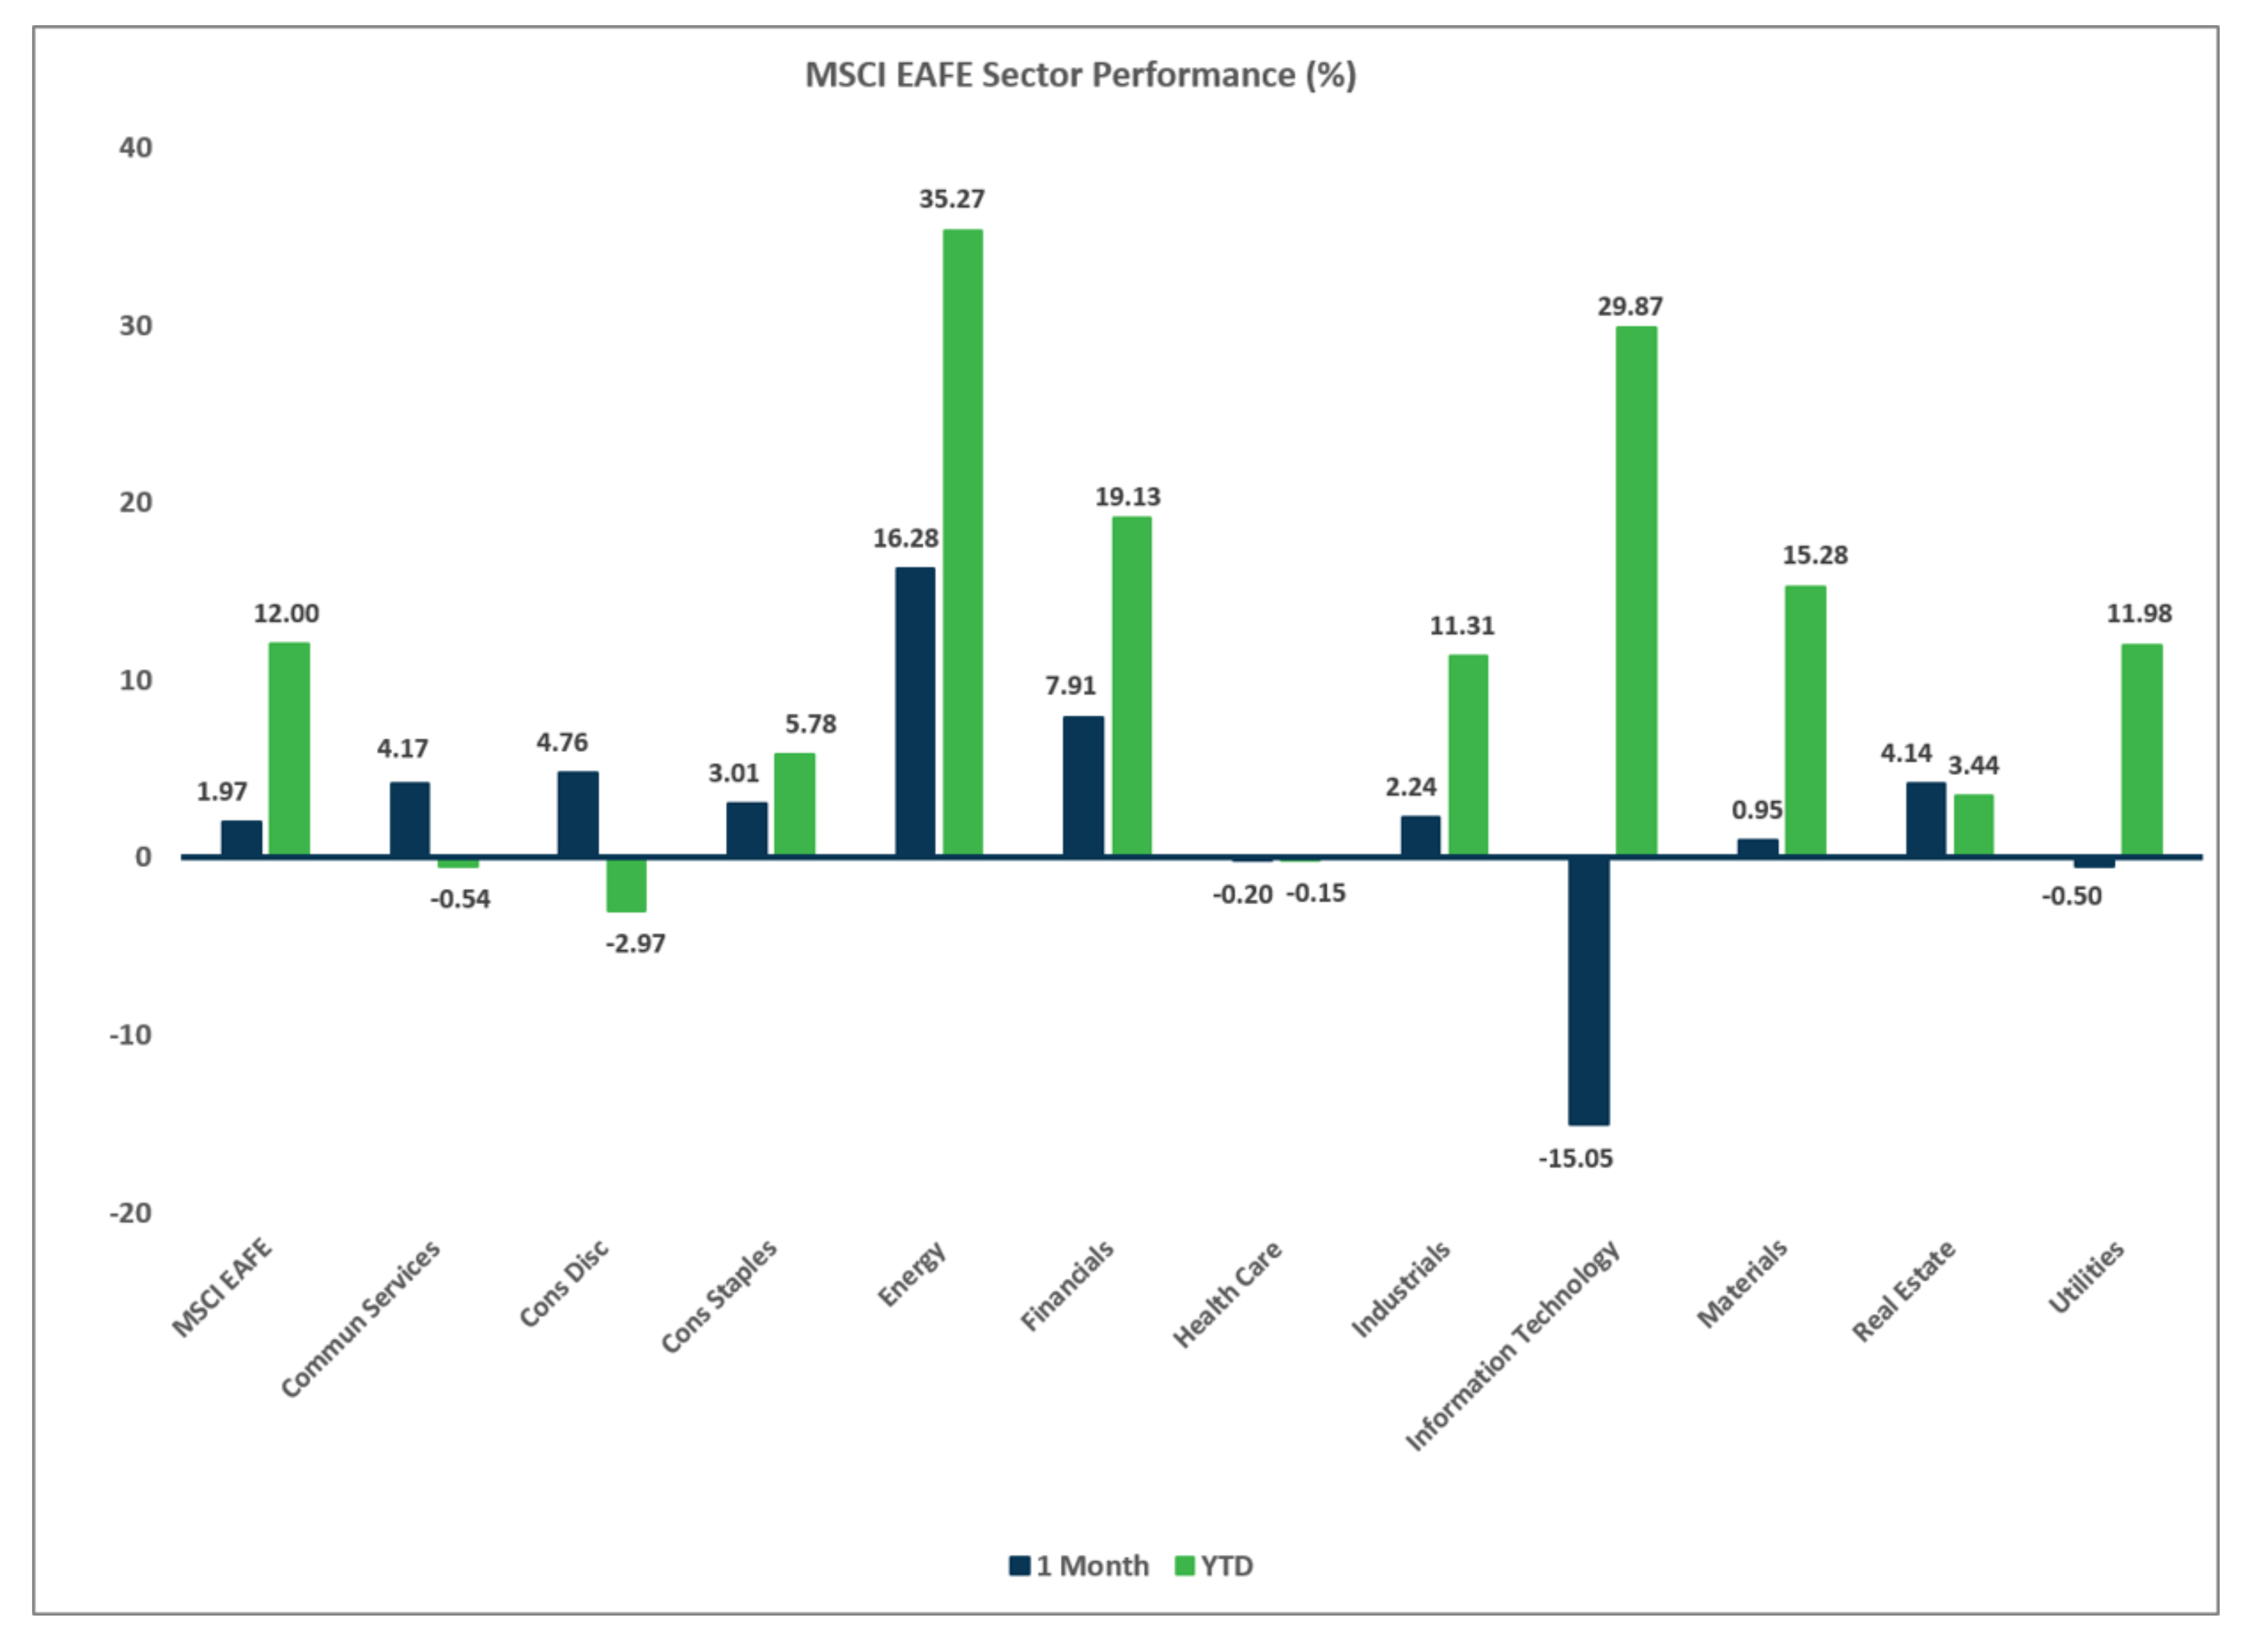
- EAFE equities outperformed in July, as the universe is heavily focused on value stocks.
- Within EAFE markets, value beat growth and there was little dispersion between large caps and small caps.
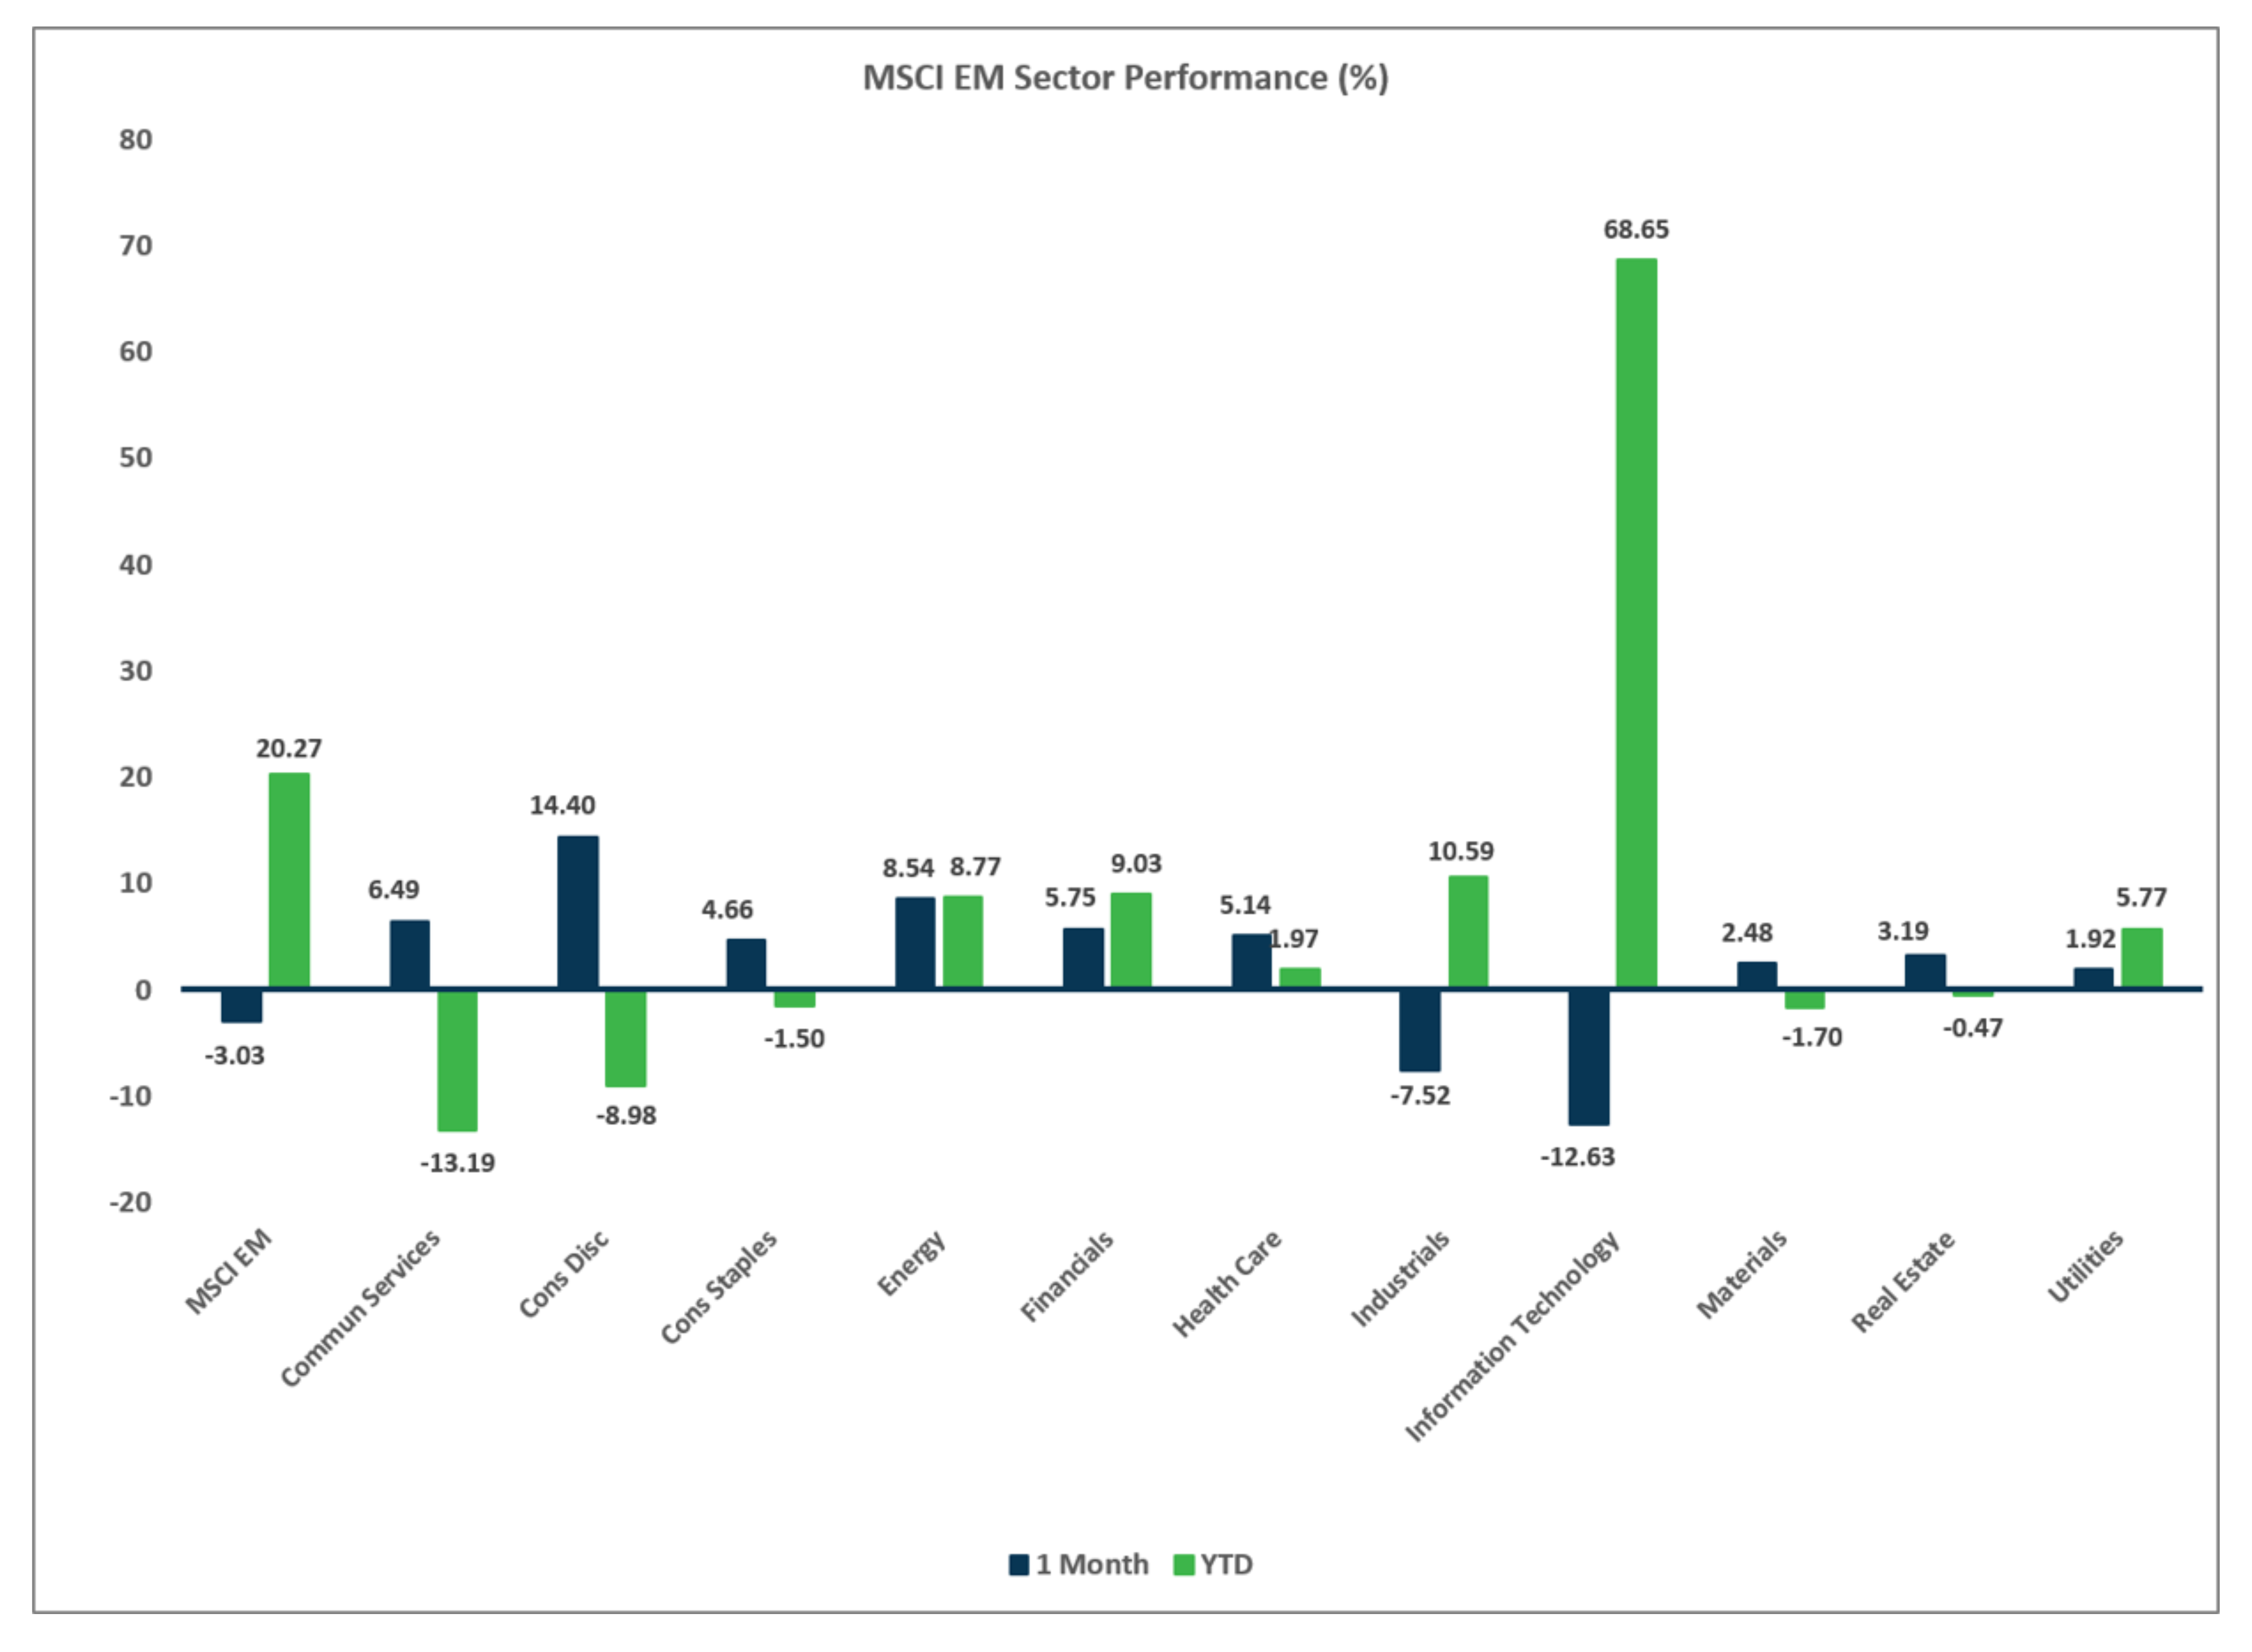
- EM equities struggled largely due to the unwinding of the AI trade.
- USD weakness added 103 bps to EAFE returns and 123 bps to EM returns.
Sector Performance – S&P 500 (as of 7/31/26)
Sector Performance – Russell 2000 (as of 7/31/26)
Sector Performance – MSCI EAFE (as of 7/31/26)
Sector Performance – MSCI EM (as of 7/31/26)
Disclosures
Investment services offered by Enterprise Bank & Trust are not deposits, obligations, or guaranteed by the bank or its affiliates. The information provided represents the opinions of Enterprise Bank & Trust and is not intended to forecast future events or guarantee future results. Past performance does not guarantee future returns. This information is for educational purposes only. Investors should consult with their investment professionals for advice concerning their particular situation.
Investments are: *Not FDIC insured *May lose value *Not financial institution guaranteed *Not a deposit *Not insured by any federal government agency.

