
Capital Markets Playbook | Q1 2026

2025 Q4 Summary
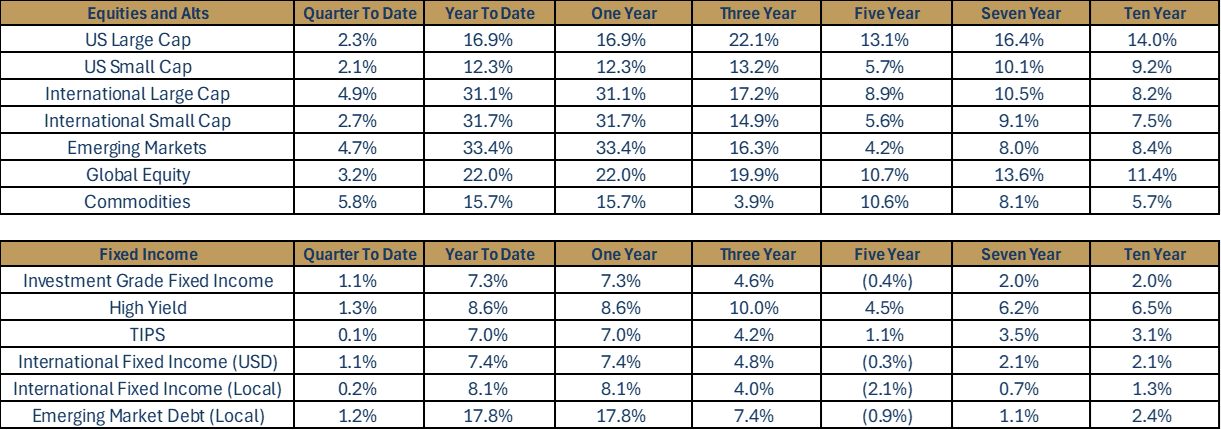
- Equity markets finished the year strong in the final quarter of 2025.
- All major equity asset classes posted gains of at least 2% in the fourth quarter. International large cap (+4.9%) was the strongest performing equity asset class. Commodities (+5.8%) were up due primarily to strength in precious metals.
- For the calendar year, global equities gained double-digit percentage returns for the third year in a row. International and emerging market (EM) equities logged +30% performance for the year, outperforming U.S. equities.
- Broad-based fixed income markets posted positive gains in the fourth quarter as well.
- All major fixed income asset classes significantly outperformed cash in 2025.
- Riskier fixed income asset classes (ex: high yield, EM debt) outperformed more conservative fixed income asset classes in 2025 (ex: Treasuries, investment grade fixed income).
2025: In Review
- 2025 U.S. Macroeconomic Review
- The Federal Reserve cut its short-term policy rate to 3.5-3.75% and signaled its monetary easing cycle may be coming to an end in 2026.
- Despite uncertainty around tariffs earlier in the year and a data vacuum due to the government shutdown, the economy is expected to have grown close to 2% in 2025.
- The Fed’s preferred measure of inflation, the Personal Consumption Expenditures (PCE) Index, declined in the first part of the year only to tick back up in more recent months. PCE inflation is likely to end the year at similar levels to those reported for 2024.
- 2025 Equity Market Review
- Broad-based equity markets finished the year up more than 20%.
- In the U.S., growth stocks outperformed value stocks handsomely due to enthusiasm over artificial intelligence (AI). Outside the U.S. however, value outperformed growth nearly two-fold.
- Equities outside the U.S. led all major equity asset classes.
- International large cap outperformed U.S. large cap by more than 14%.
- EM equities, which were up more than 30% in 2025, outperformed all major equity asset classes.
- Broad-based equity markets finished the year up more than 20%.
- 2025 Fixed Income Market Review
- All major fixed income asset classes reported returns of at least 7%.
- Despite periods of policy-driven volatility and fluctuating interest rates, domestic fixed income returns far exceeded returns on cash in 2025.
- EM debt (local currency) was the best performing fixed income asset class (+17.8%). Outperformance in this asset class was driven by supportive global factors — primarily a weaker U.S. dollar, U.S. interest rate cuts and strong growth in emerging markets.
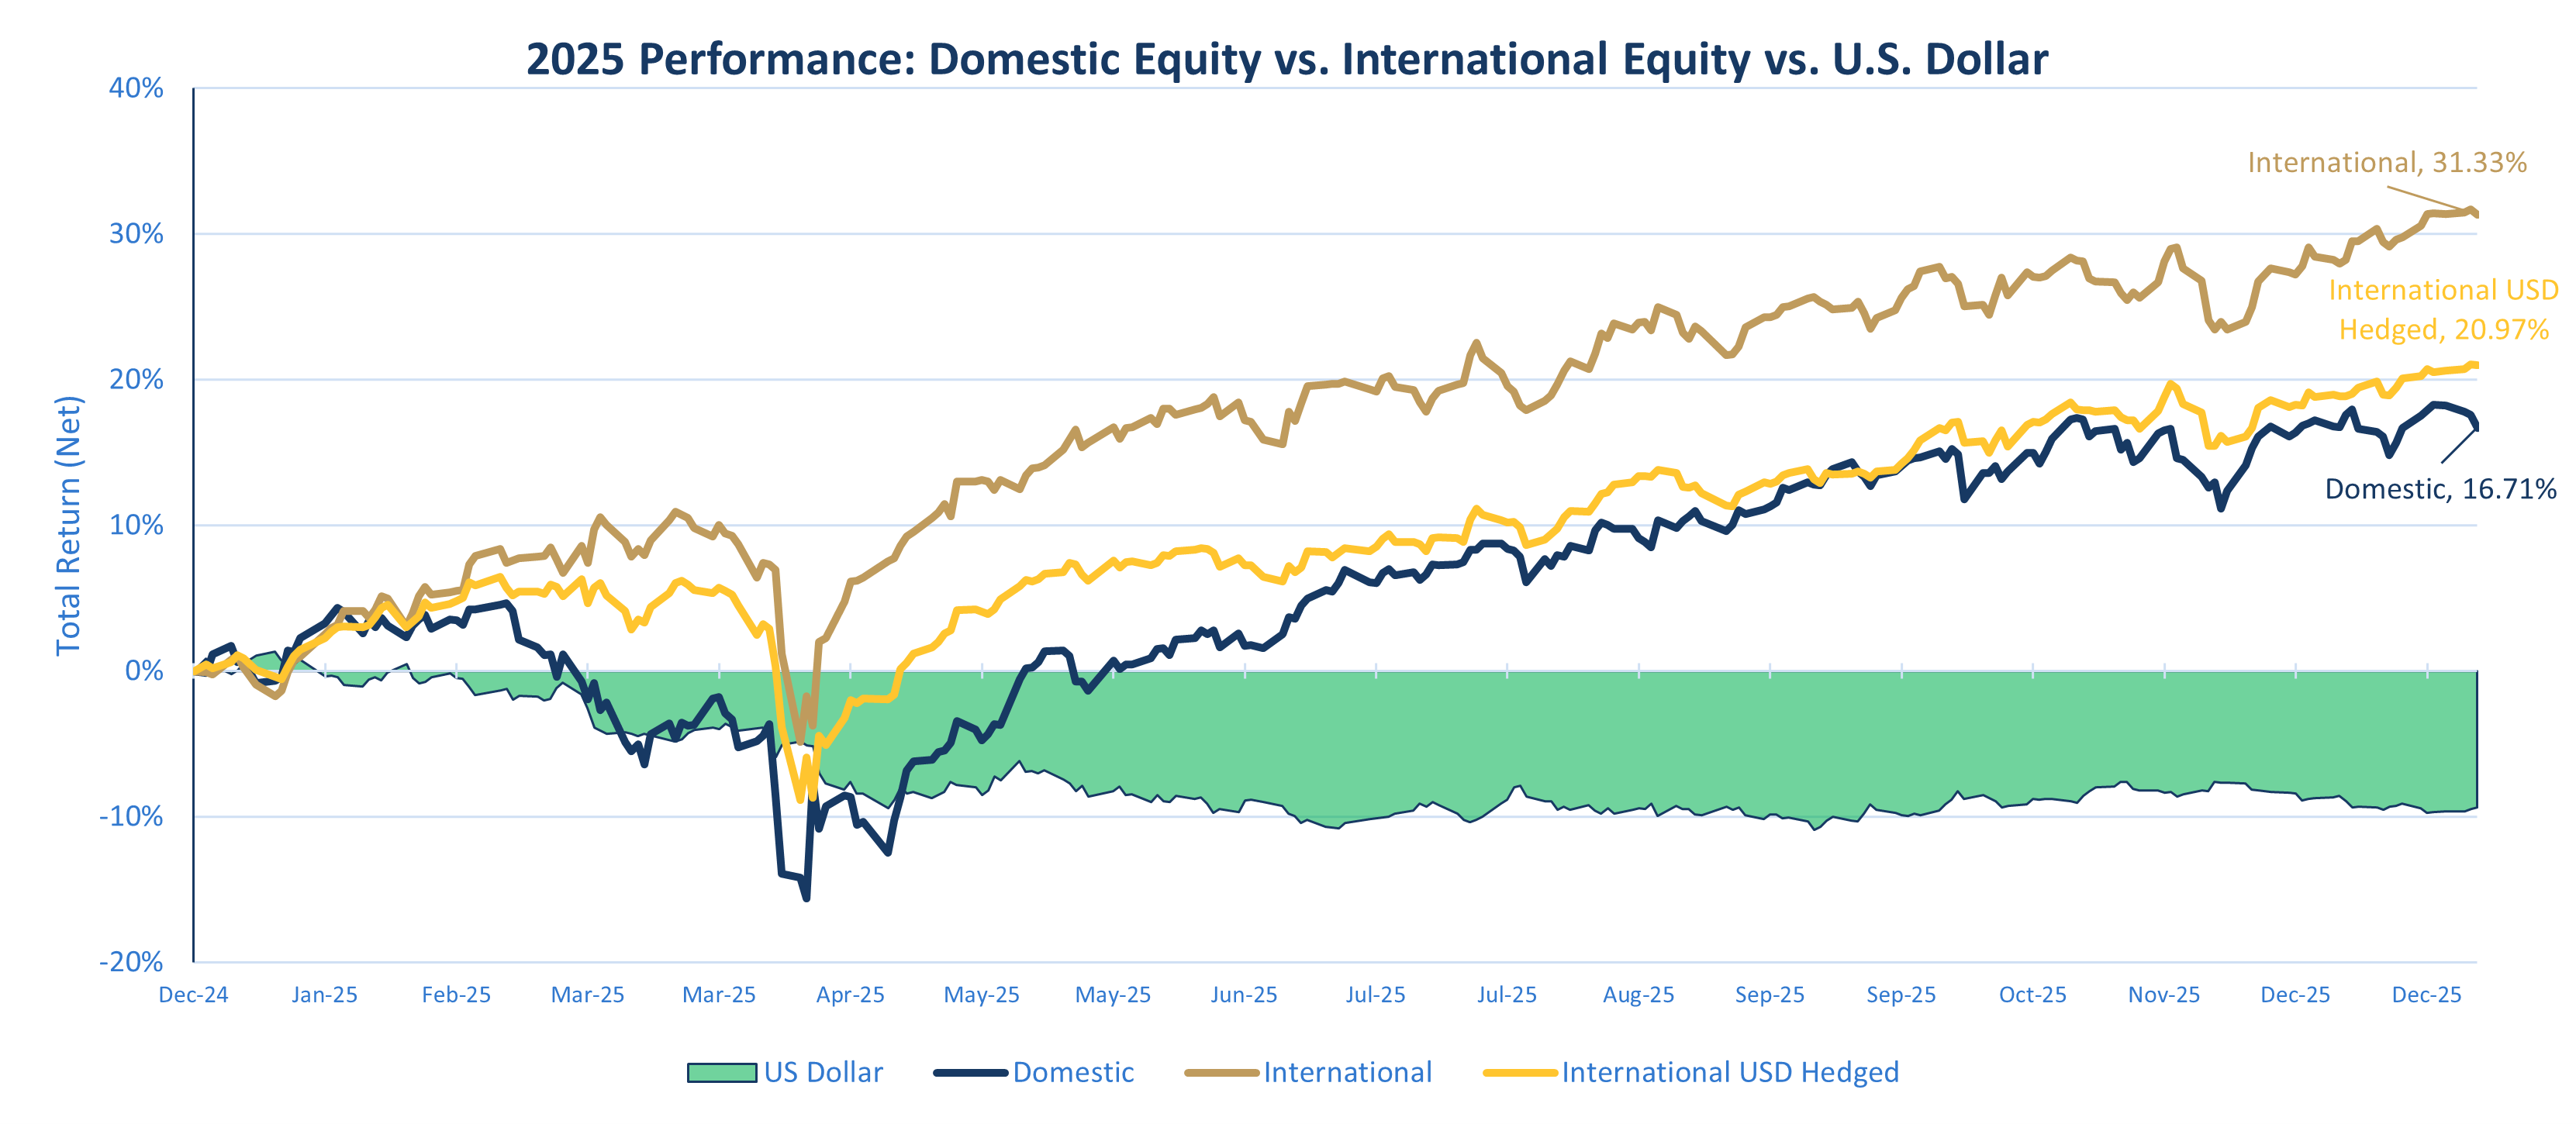
- Over the past two decades, international stocks provided better relative annual returns than domestic equities 40% of the time, highlighting the benefits of diversifying across regions.
- The weakening U.S. dollar provided a significant tailwind for domestic investors during the year, amplifying their returns in international markets.
- The U.S. Dollar Index (DXY) recorded its sharpest first-half decline in nearly 40 years, contributing to a notable divergence in year-to-date asset class performance.
- Currency tailwinds boosted returns, as international outperformed domestic equities by double digits for the first time since 2005.
- While interest rate differentials and inflation typically influence currency movements, the dollar weakness in 2025 appeared more closely tied to concerns over U.S. fiscal sustainability, growing uncertainty around trade policy and interest rate differentials with other developed markets.
2026: Expectations for the Year Ahead
- 2026 U.S. Macroeconomic Preview
- Expected Case
- Economic growth in the U.S. is expected to grow close to 2% in 2026.
- Consumer spending is expected to moderate and come in slightly below the 25-year average growth rate of 2.5%.
- Unemployment, currently at 4.4%, is expected to remain stable through the end of 2026.
- Wage growth, which is expected to continue to moderate in 2026, should come in close to its average long-term growth rate (3.5-4.0%).
- Inflation remains range-bound as impacts from tariffs continue to flow through the economy, keeping inflation levels above the Fed’s 2% target throughout 2026.
- PCE inflation, the Fed’s preferred measure of inflation, is expected to decrease to 2.5% by year end 2026.
- The Fed is expected to make one or two additional cuts to the federal funds rate in 2026 before the Fed’s easing cycle comes to an end.
- Expected Case
- 2026 Equity Market Preview
- Expected Case
- The global equity outlook heading into 2026 remains constructive. While volatility and pullbacks may occur, economies and markets around the world are projected to continue to grow.
- AI-related investments will likely remain a key driver of performance, but a broadening of earnings growth beyond the mega-cap tech sector is expected across multiple asset classes and areas of the market.
- Expected Case
- 2026 Fixed Income Preview
- Expected Case
- The yield curve is expected to normalize further. Federal rate cuts should result in a yield curve that is “upward sloping” across all maturities.
- The slope of the U.S. Treasury yield curve may steepen as the Fed is expected to make at least one accommodative cut in 2026.
- Intermediate and long-term interest rates may prove volatile and even move higher in the months and quarters ahead, as markets weigh concerns over U.S. debt, deficits and sticky inflation.
- Expected Case
Risks to the “Expected Case” in 2026
- Elevated Asset Class Valuations
- Equities and real estate make up a significant percentage of households’ total net worth. Equities and homes had significant price gains for the past five years, which has led to fairly expensive valuations.
- A reduction in asset values would likely lead to slower spending growth, weaker labor markets and slower economic growth.
- Unexpected Labor Market Weakness
- An unexpected softening of the labor market would create headwinds to consumer spending and lead to slower economic growth.
- Unexpected labor market weakness may create a more acute “affordability crisis” for low- and middle-income households.
- An Unexpected Pickup in Inflation
- Tariffs on imported goods could push inflation higher than expected, as its impact is still working its way into the economy.
- More aggressive and accommodative fiscal and monetary policy intervention may increase inflation and inflation expectations in the U.S.
- Mounting Concerns Over U.S. Debt and Deficits
- Mounting concerns over U.S. debt and deficits could lead to higher long-term interest rates (even if inflation moves lower).
- Larger-than-expected increases in the fiscal deficit could lead to even more debt issuance from the U.S. Treasury, which could push interest rates higher.
- Unexpected Geopolitical Issues and Midterm Elections
- Unexpected geopolitical events can significantly influence financial markets over short periods of time.
- Uncertainty associated with U.S. foreign policy could have negative impacts on market volatility, global trade flows and the global economy.
- The lead up to midterm elections in the U.S. could create news that negatively impacts market volatility over the short term.
- The “Unknown Unknowns”
- The most threatening risks to the “expected case” are always those that catch markets by surprise. The most recent examples of exogenous shocks are the emergence of COVID-19 in late 2019/early 2020 and the tariff announcements in early 2025.
2026 Expectations: Economic Growth
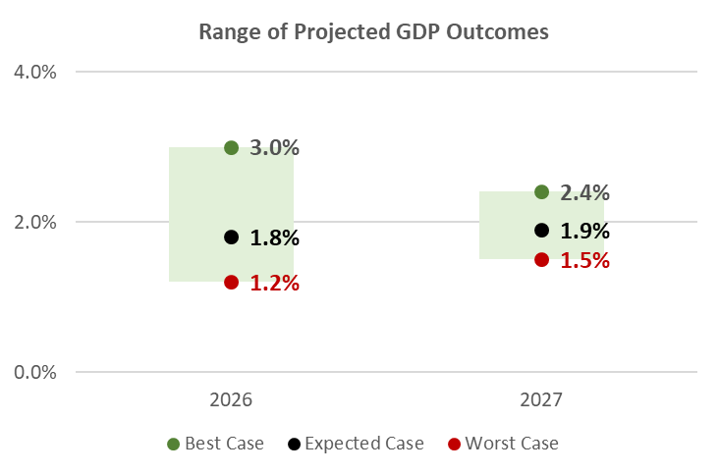
- U.S. economic growth is expected to continue its current growth path, remaining just below trend levels through 2026.
- GDP growth for 2026 and 2027 is expected to remain slightly below the long-term GDP trend rate of 2.1%.
- The probability of an economic contraction in the U.S. is low in 2026, but a recession cannot be entirely ruled out.
- Scenarios
- Best Case
- Economic activity in the U.S. will come in well above its long-term trend rate over the next two years.
- Expected Case
- Economic activity in the U.S. is near its long-term growth rate over the next two years.
- Worst Case
- Economic activity is well below its long-term trend rate over the next two years.
- Best Case
2026 Expectations: Inflation
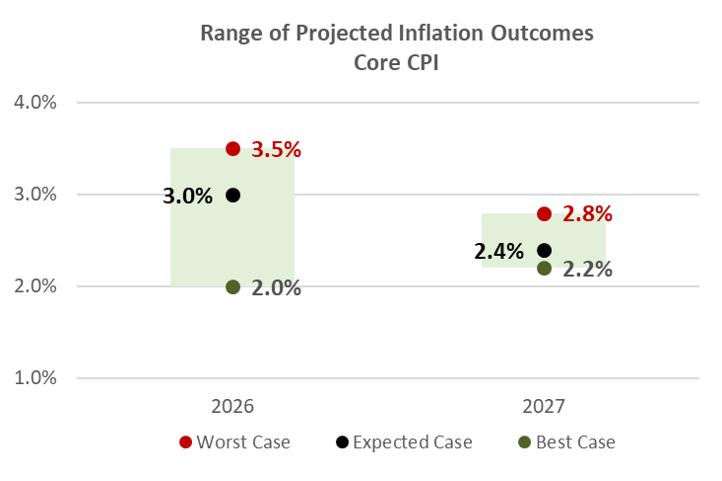
- Inflation remains sticky and is still about 1% higher than the Fed’s long-term target rate.
- Inflation may increase marginally in the months ahead as tariffs begin to filter into the aggregate U.S. economy.
- Policy changes that may be inflationary in nature (ex: tariffs, fiscal policy) may keep inflation stubbornly above the Fed’s inflation target through much of 2026.
- Scenarios
- Best Case
- Inflation declines to the Fed’s long-term inflation target of 2% by the end of 2026
- Expected Case
- Inflation continues to moderate very slowly and is about 1% higher than the Fed’s long-term inflation target by the end of 2026.
- Worst Case
- Inflation continues to be sticky throughout the aggregate economy and is approximately 1.5% higher than the Fed’s long-term inflation target through the end of 2026.
- Best Case
2026 in Focus: Consumers and the “K-Shaped” Economy
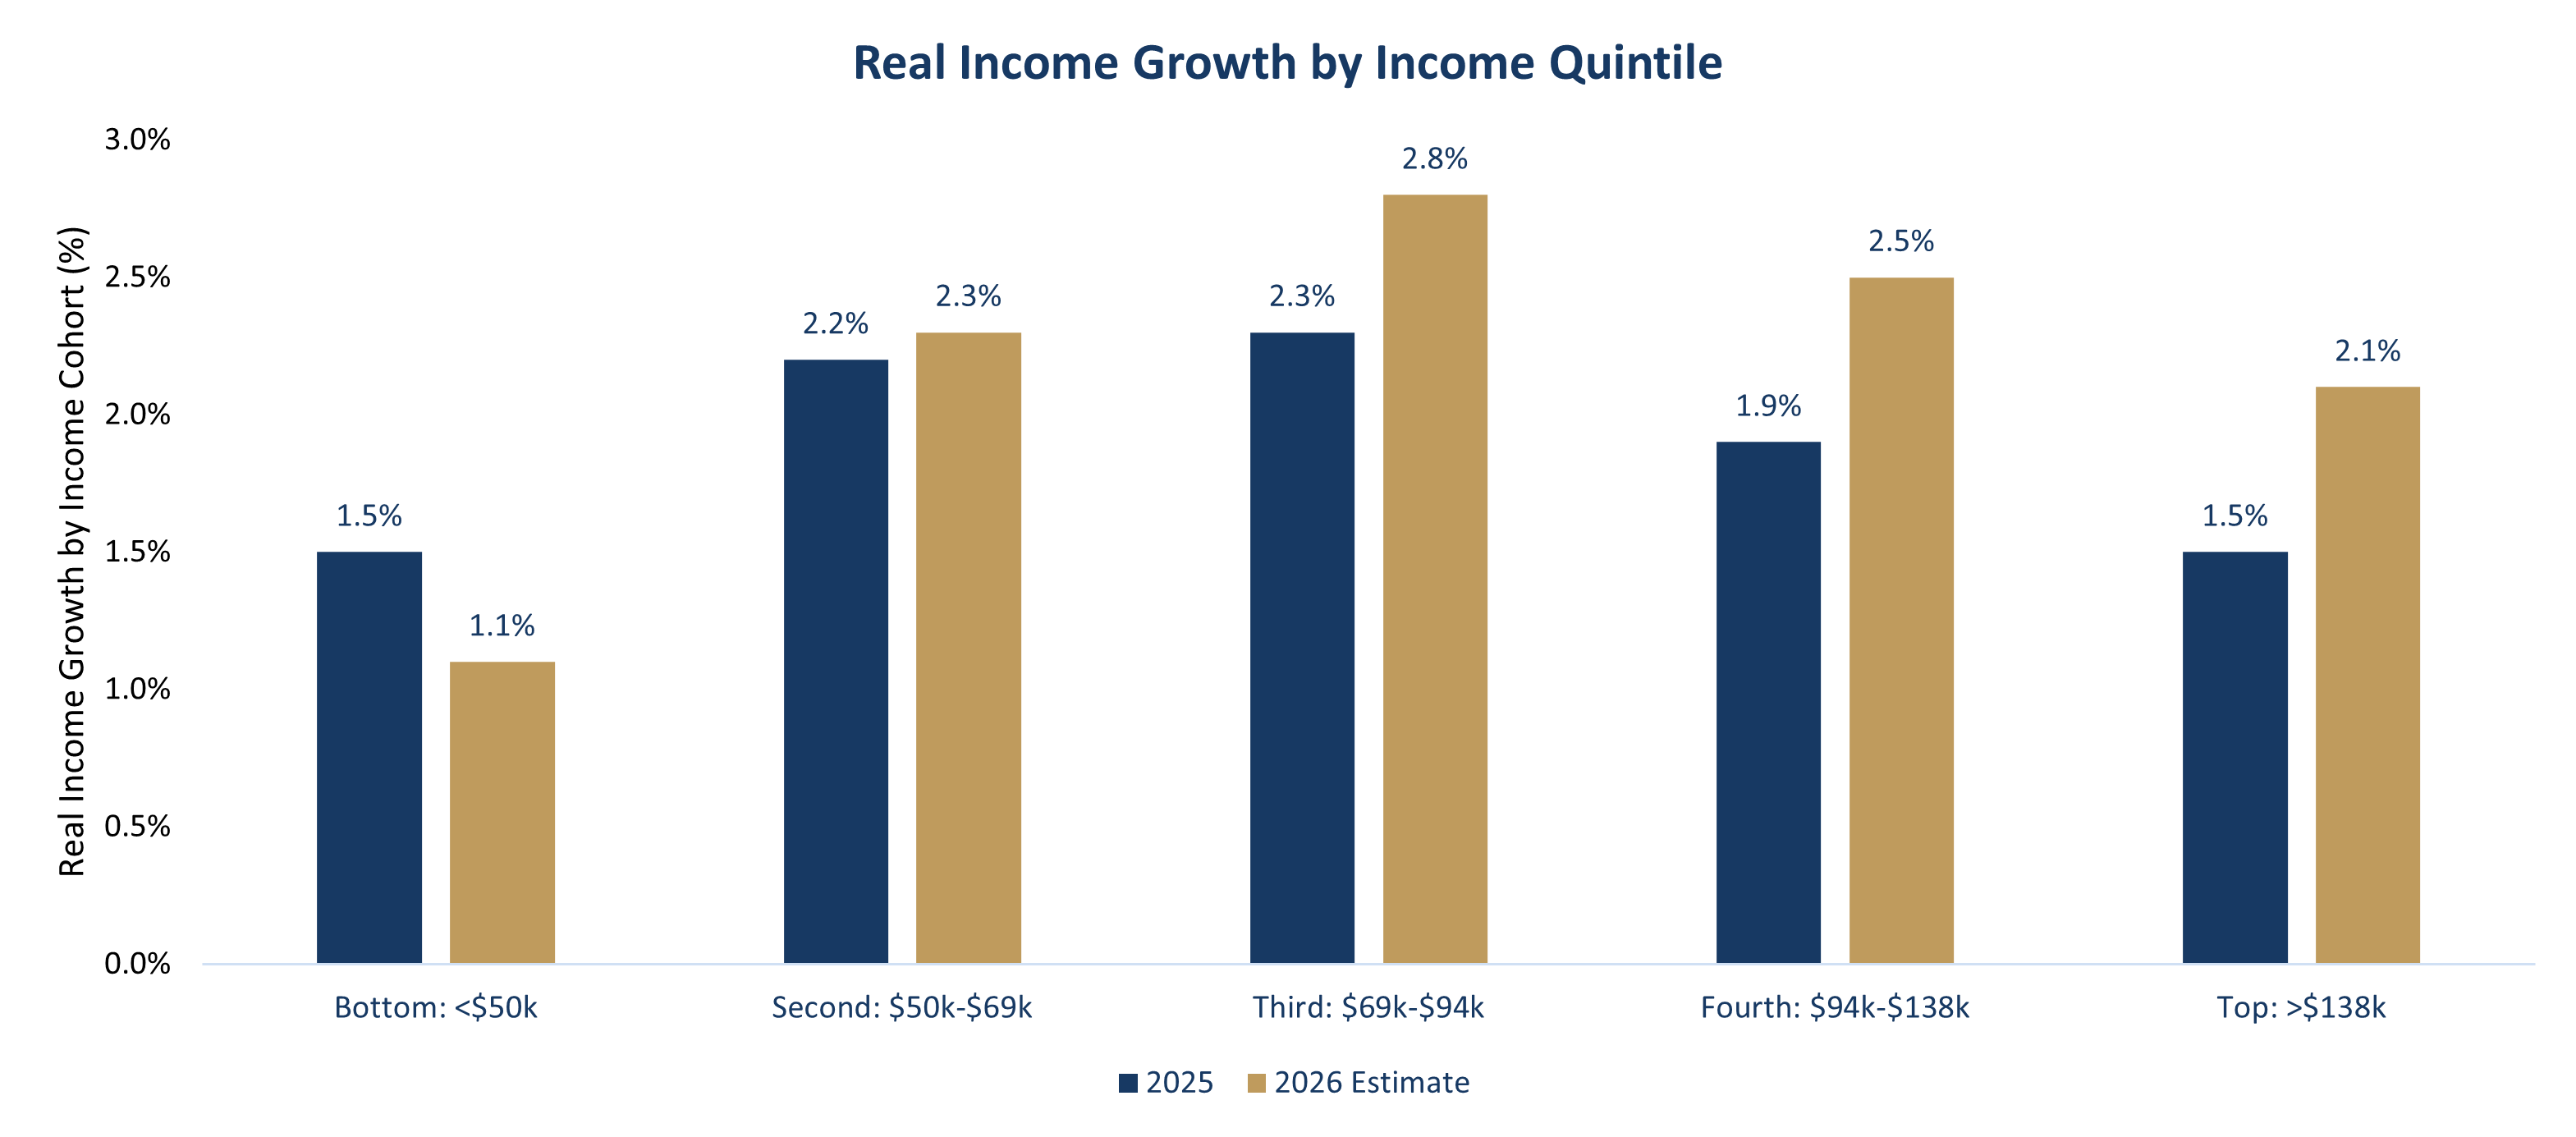
- Consumer spending accounts for roughly 70% of GDP historically and the top income quintile accounts for 40% of total consumption.
- Divergence in wealth gains between the highest and lowest income cohorts has increased in recent years. Lower income households are spending less due to persistent inflation, historically high shelter costs and cuts to social welfare programs.
- Meanwhile, a rise in asset prices and tax reform have been tailwinds for the highest-income consumers. This group is expected to see the highest increase in real income growth for 2026.
- Takeaway
- Consumption drives the U.S. economy. Affordability issues are most evident in lower-income households today. Should affordability become an issue for middle-income households, it would reduce aggregate consumption and economic growth in the U.S.
2026 in Focus: Tariffs
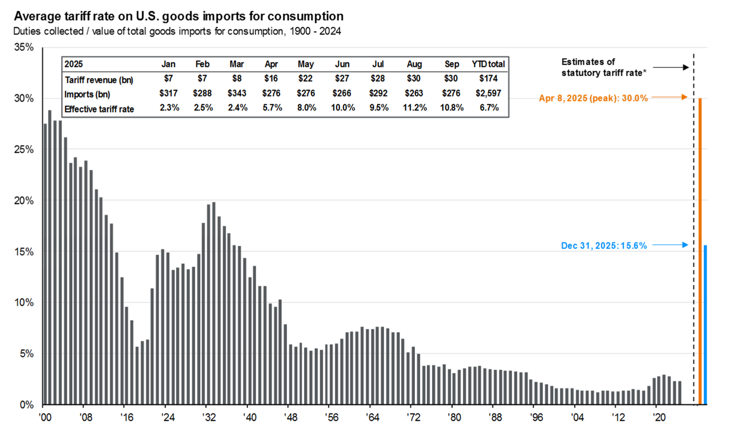
- Despite elevated concerns over high tariffs in 2025, tariffs have yet to have a material impact on overall economic activity in the U.S.
- Statutory tariff rates have been cut in half since April 2025 due to renegotiated trade deals, exceptions and carveouts.
- Additionally, many companies that were hit with additional tariff costs in 2025 have yet to pass those costs on to U.S. consumers in a material way.
- It is possible that U.S. firms begin to pass along higher tariff costs to consumers in 2026. That said, it is uncertain just how broad-based this activity may be in the quarters ahead.
- Takeaway
- Trade policy for 2026 remains uncertain. If the effective tariff rate continues to trend lower in 2026, the impact of tariffs will continue to be muted.
2026 in Focus: Earnings Expectations
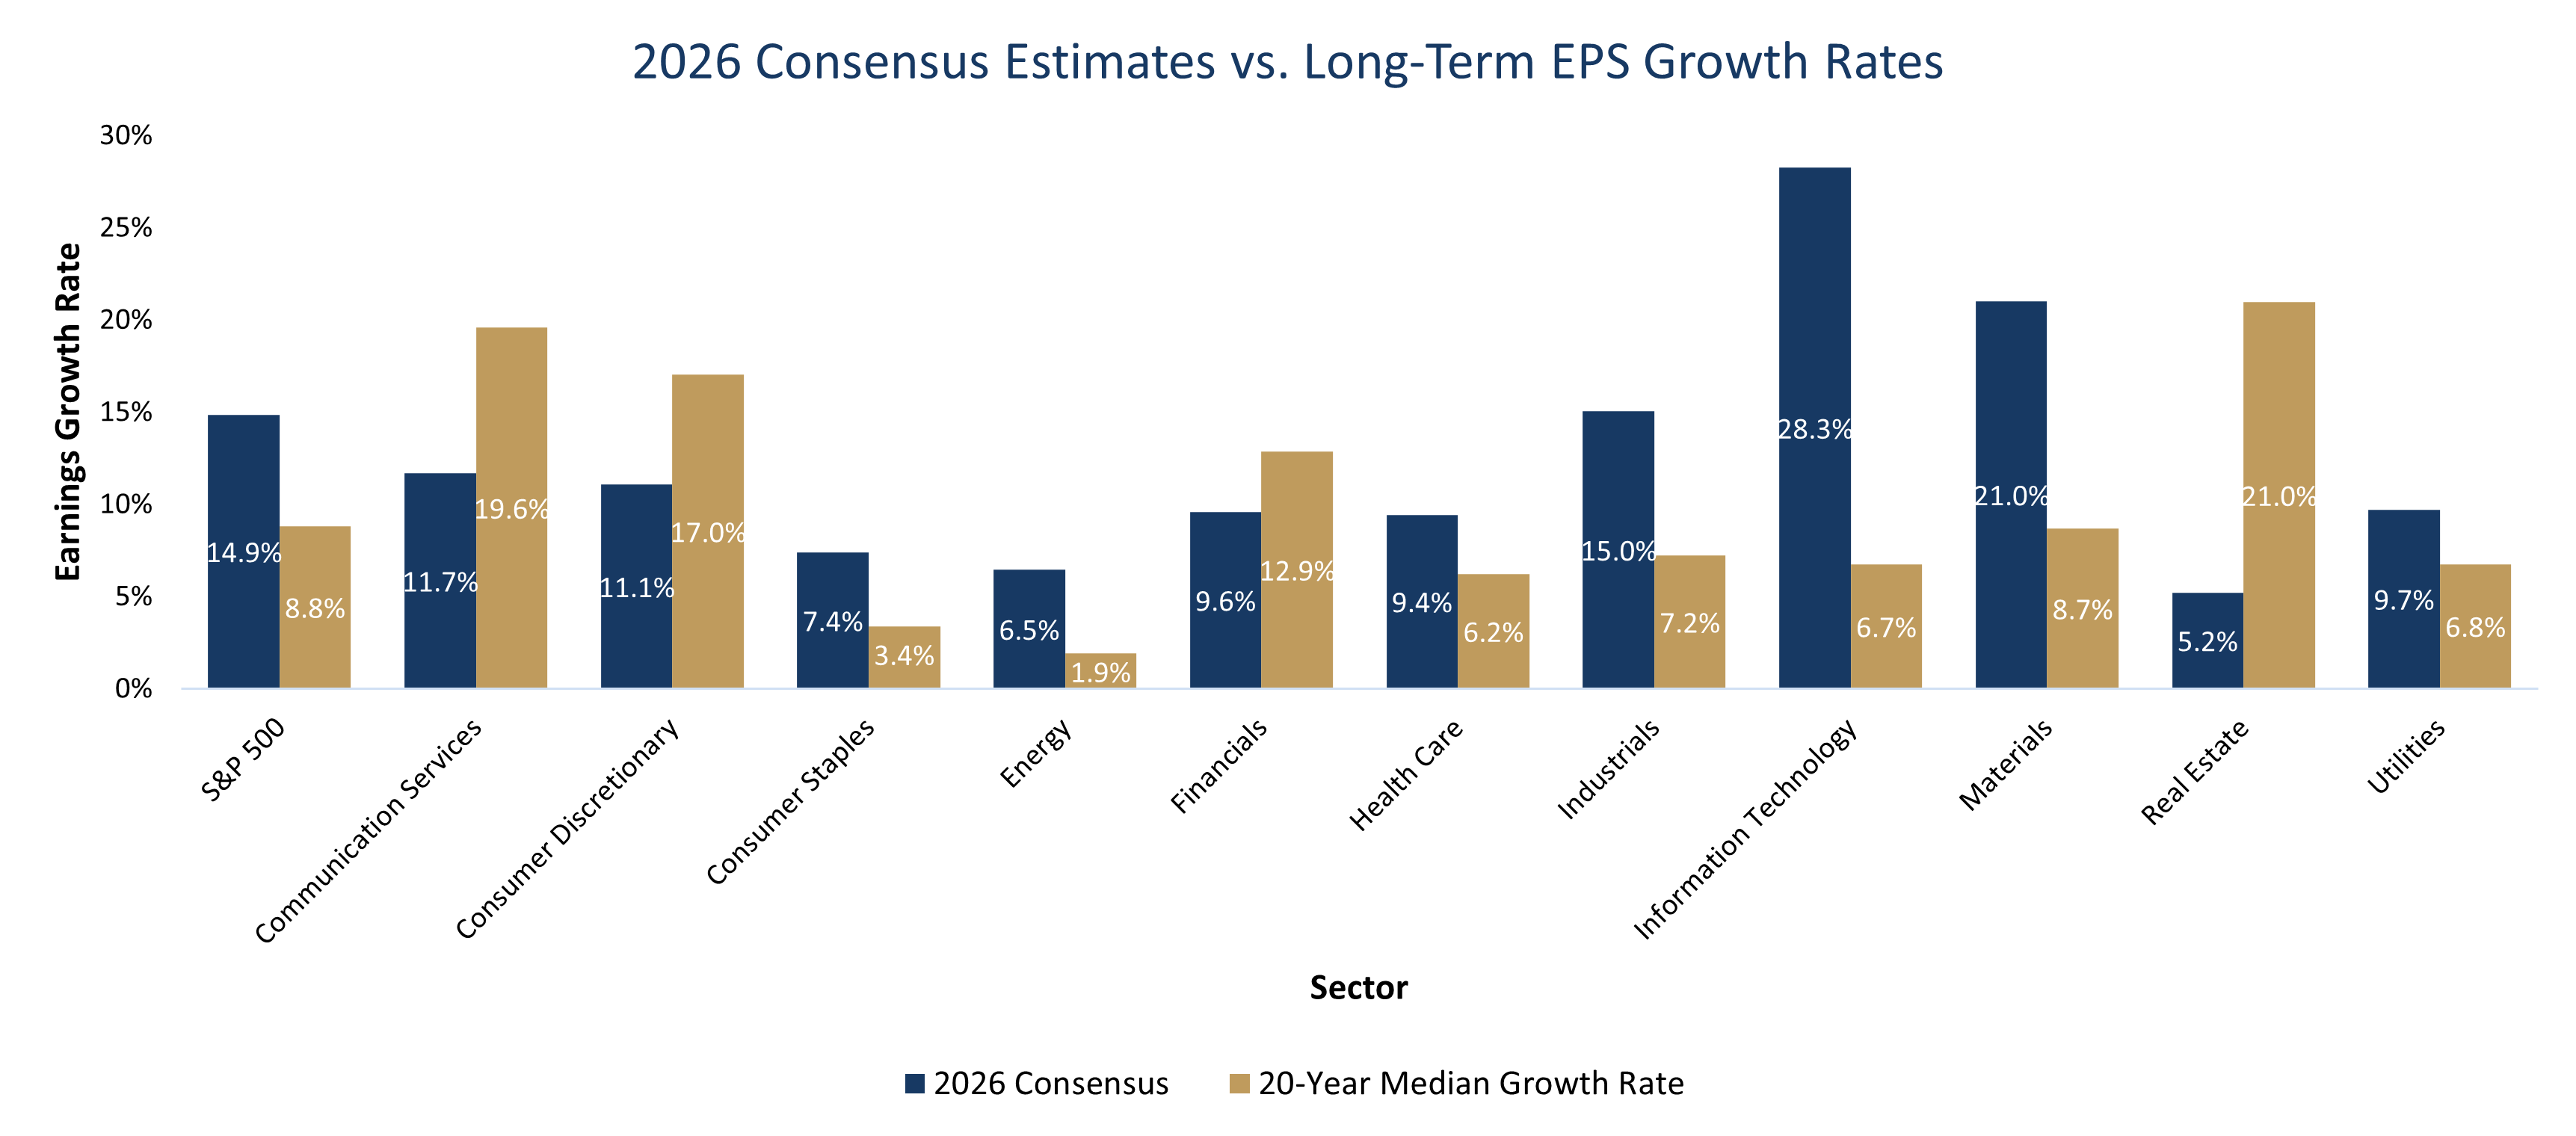
- Consensus 2026 earnings growth estimates imply solid growth across sectors, with the majority expected to be above their long-term median growth rates.
- With all sectors expected to grow earnings, investors may see greater performance breadth than in recent years as valuations may become more attractive.
- Takeaway
- Robust earnings growth across sectors may provide a backstop for equity markets amidst macroeconomic uncertainty.
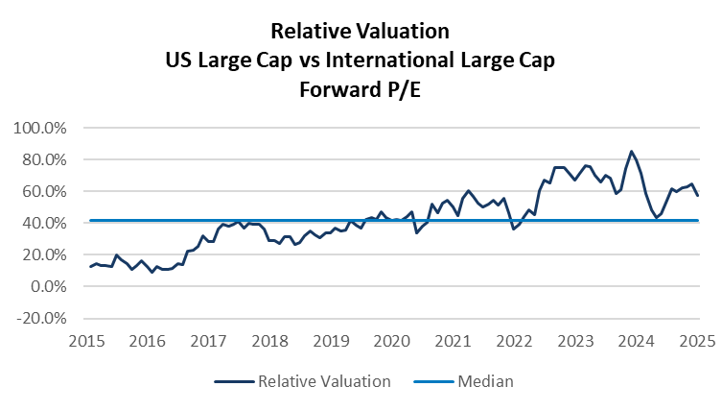
Relative Valuations: U.S. Large Cap Comparison
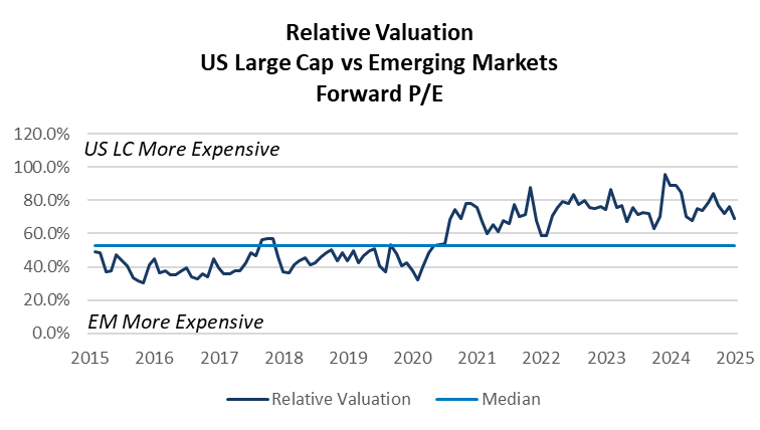
- Despite recent outperformance by equities outside the U.S., fundamental valuation metrics suggest that U.S. equities are still “expensive” on a relative basis.
- Relative valuations for U.S. large cap stocks remain above their 10-year average despite significant outperformance by international and EM equities in 2025.
- Takeaway
- Diversification outside the U.S. is prudent and we recommend investors have an allocation to international equity and EM equity.
Relative Valuations: Growth vs. Value Comparison
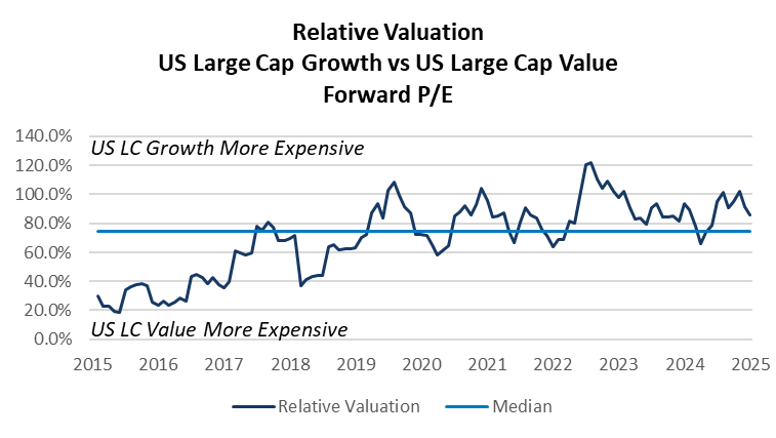
- From a relative fundamental valuation perspective, U.S. growth stocks remain expensive compared to U.S. value stocks.
- Value stocks in the U.S. performed well in 2025 but remain “cheap” compared to U.S. growth stocks.
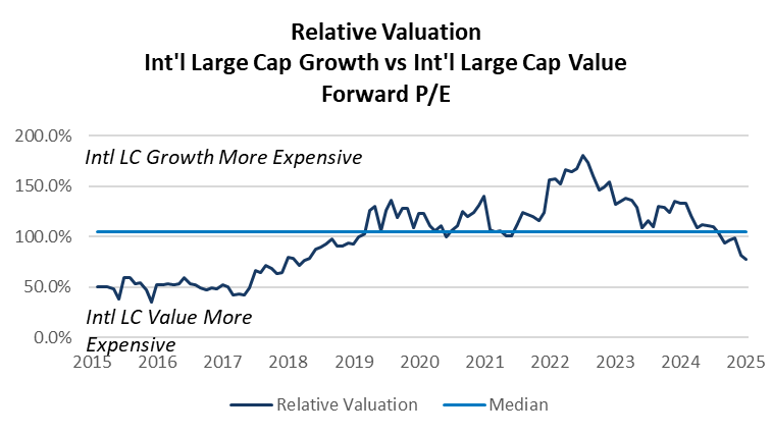
- Current relative valuations for international value stocks and international growth stocks are consistent with long-term relative valuation averages.
- International value stocks had been “cheaper” than international growth for the past five years, but that is no longer the case.
- Takeaway
- A slight overweight to U.S. value relative to U.S. growth is recommended given current fundamental valuations and the potential for trade-related volatility to continue.
Fixed Income: Treasuries
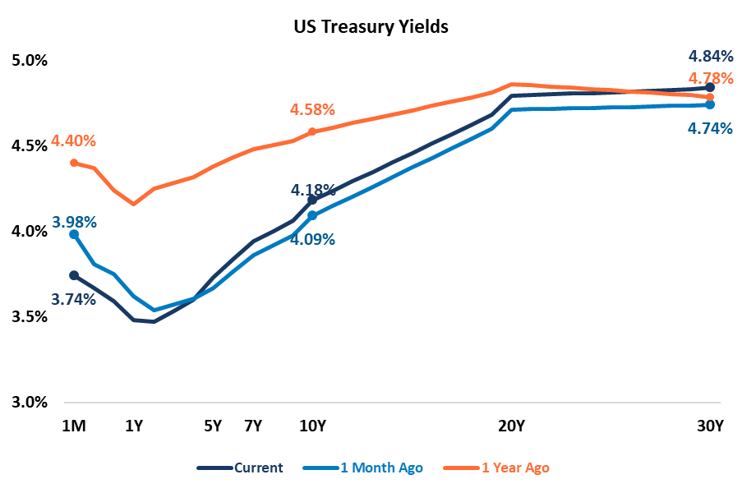
- The U.S. Treasury yield curve has changed materially over the past year, with volatility continuing in the quarter as rate expectations shift and concerns for the health of the U.S. economy increase.
- The yield curve remains inverted only at the very short end of the curve, but longer-dated term rates are no longer inverted.
- The yield curve should continue to steepen through 2026, as the Fed appears likely to cut short-term at least once through the end of the year.
- Long-term yields could spike in 2026, should concerns over U.S. debt and deficits escalate.
- Takeaways
- Any shift in expectations for the path of rate cuts could lead to increased volatility in rates through the end of the year.
- Increasing duration in fixed income portfolios is appropriate, especially for long-term investors that are invested exclusively in short-duration fixed income assets.
Long-Term Investors Should Stay Invested
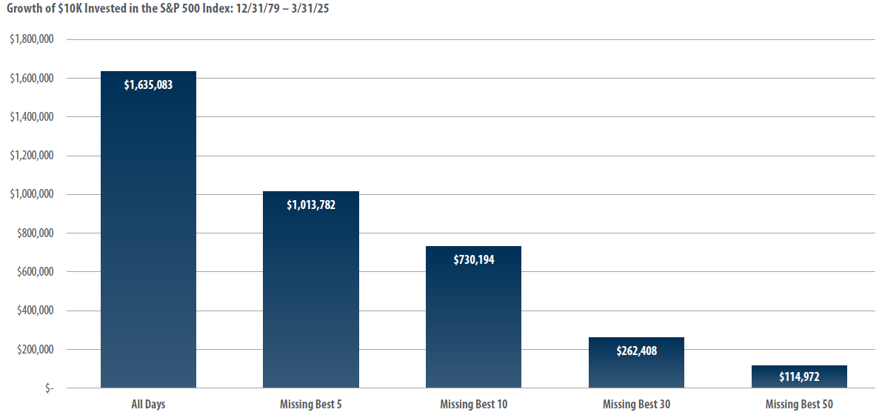
- The chart highlights how a $10k investment in the S&P 500 would grow over the next 45 years.
- If the investor missed the best 30 days of market performance, the investment portfolio would be worth more than $1.3M less than if the investor had stayed in the market.
- Takeaways
- The market’s best performance days typically occur during periods of elevated volatility.
- Regardless of what may be in store for the macroeconomy and capital markets, long-term investors should avoid the temptation to exit out of markets during periods of elevated uncertainty.
- Riding out market volatility is the best way to build wealth over the long term.
Equity Market Volatility
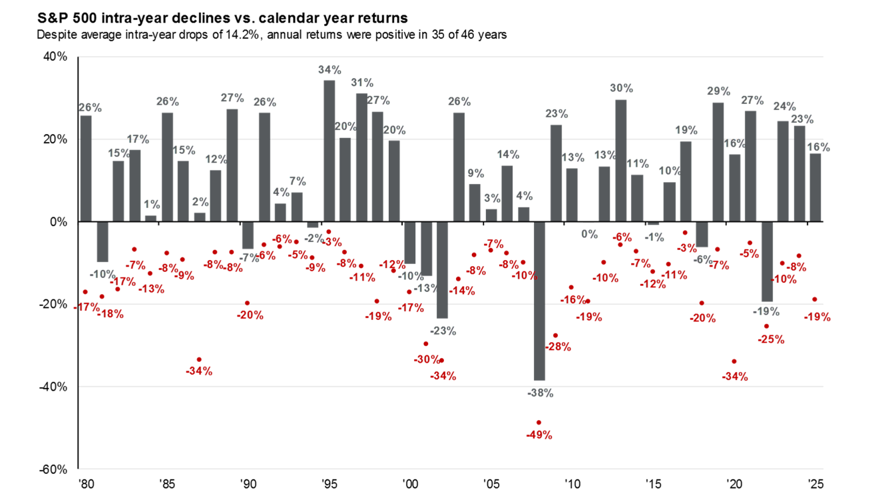
- The chart illustrates annual S&P 500 performance since 1980 (shown in columns above) and the intra-year declines during each year (shown by the red dots).
- Ex: In 2020, the S&P 500 experienced an intra-year decline of -34% before finishing up 16% for the year.
- Over the past 45 years, the S&P 500 has experienced an average intra-year decline of 14%. Despite that, the S&P 500 had positive annual performance in 34 of the last 45 years.
- Takeaway
- As painful as market volatility can be, equity market selloffs are normal, and investors are rewarded for patience.
Playbook Summary
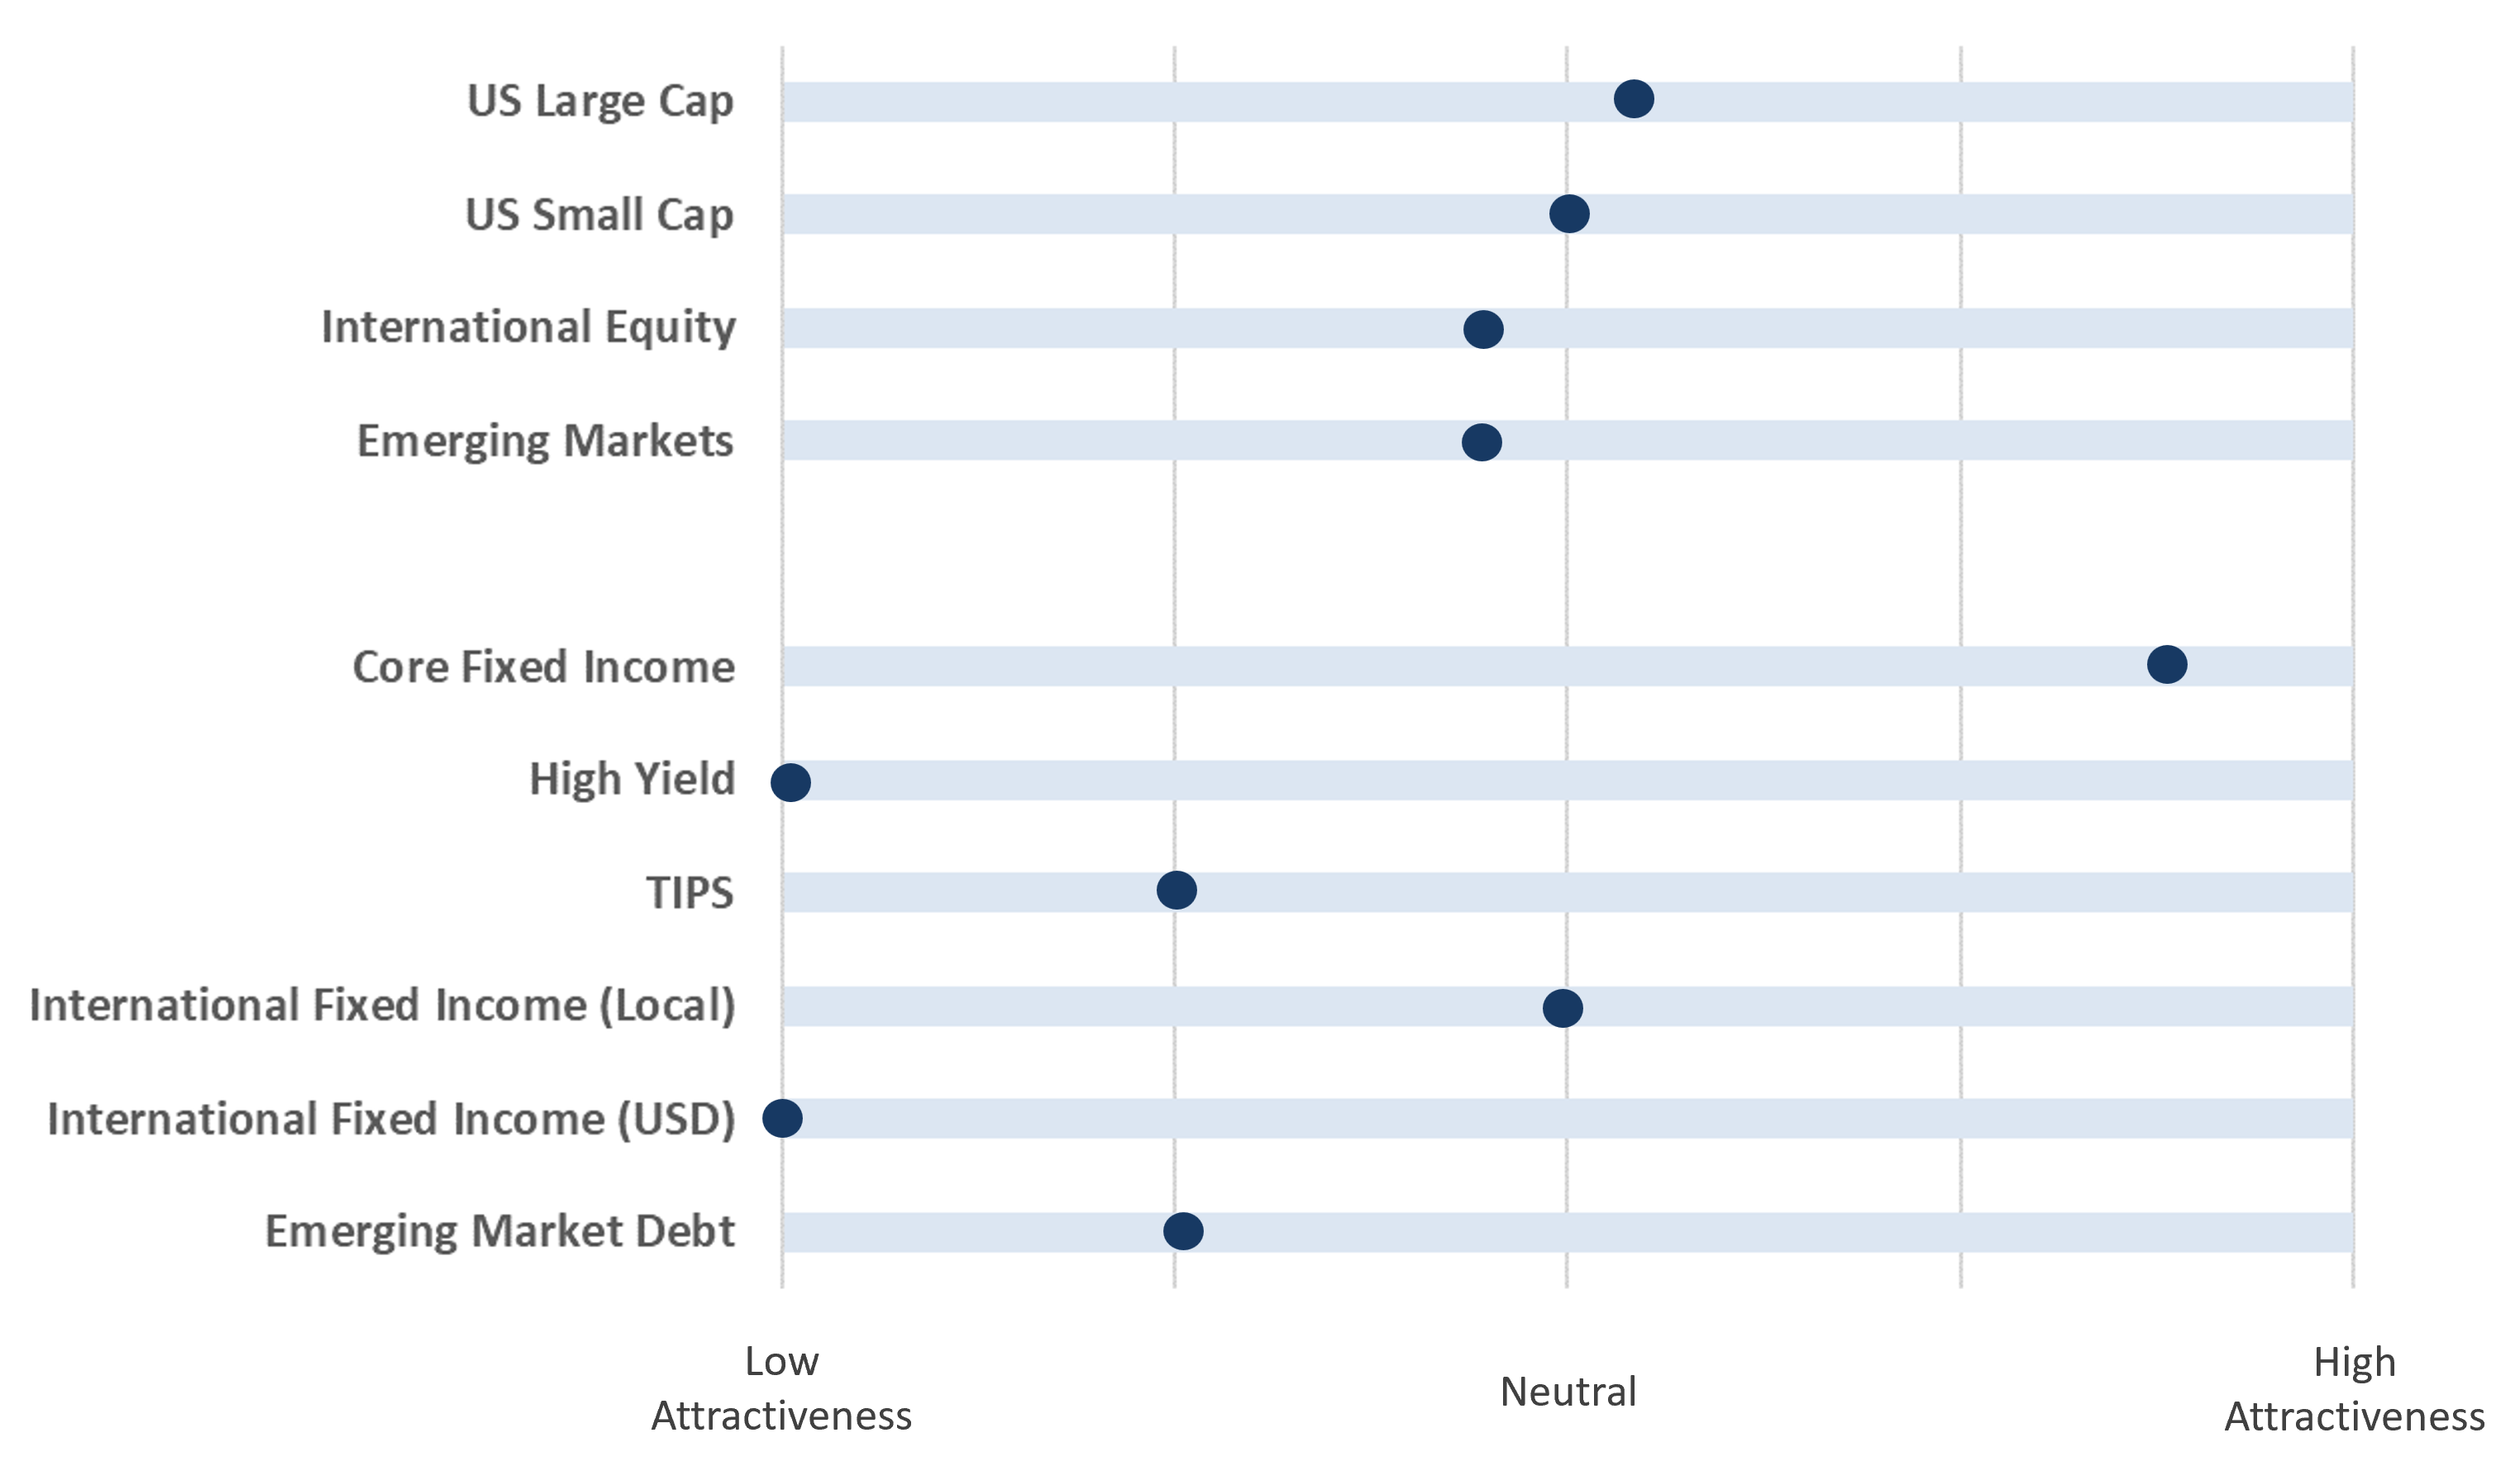
- The above table indicates where each major investment asset class falls on the distribution of attractiveness (from low to high). This table is meant to provide a standardized and comparable view of the level of opportunity in each asset class category.
- In subsequent quarters, we will discuss any movement along the scale for each asset class and the driving forces behind the change in outlook.

