
January 2026 Market Update

Economic Highlights
United States
- U.S. employers added 50,000 new jobs in December, short of the 73,000 estimate and below the 56,000 reported in November. The unemployment rate fell from 4.6% to 4.4%, and the U6 unemployment rate declined to 8.4%. The October and November reports were revised lower, and job growth averaged 49,000 in 2025, down from 168,000 in 2024. Average hourly earnings increased more than expected to an annualized rate of 3.8%. Outside of recessionary periods, 2025 marked the worst year of job growth since 2003.
- December’s CPI report came in better than anticipated, with headline inflation running at 2.7% and core inflation easing to 2.6%. Food prices jumped 0.7% M/M, energy prices rose 0.3% and recreation surged 1.2%. Rent increased 0.4%, but used cars fell 1.1%. With inflation largely contained, markets continue to project 2-3 rate cuts in 2026. The PCE price index increased 0.2% in November, matching October's gain. In the 12 months through November, the PCE price index climbed 2.8% after rising 2.7% in October. Core PCE increased 2.8% Y/Y in November.
- U.S. retail sales rose 0.6% M/M in November 2025, rebounding from a revised 0.1% decline in October and exceeding forecasts of a 0.4% increase. The rise was driven by a rebound in auto sales, following a slowdown caused by the expiration of federal tax incentives on electric vehicles and by strong holiday shopping. Core retail sales, used to calculate consumer spending in the GDP report, rose 0.4%. Durable goods orders surged 5.3% M/M in November, up from a revised 2.1% decline in October. The gain was driven by a sharp rebound in transportation equipment orders, which surged 14.7% after a 6.3% fall in October, led by a 97.6% spike in civilian aircraft bookings. Core goods rose 0.7%, a strong sign for the looming Q4 GDP report. The U.S. economy grew 4.4% in Q3, and the Atlanta Federal Reserve expects 4.2% growth in Q4.
- The manufacturing sector surprisingly surged back into expansion territory in January, based on the latest ISM Manufacturing PMI reading. The headline number of 52.6 was up from 47.9 in December, boosted by strong rebounds in production, new orders and employment. Although the headline readings were positive, survey respondents seemed to highlight caution and overall business softness.
Non-U.S. Developed
- The eurozone economy expanded 0.3% Q/Q in Q4, slightly ahead of expectations. Spain led the gains, surpassing expectations and supported by robust household consumption and fixed investment. The Netherlands expanded by 0.5%, driven primarily by exports. Germany and Italy both grew 0.3% while France’s GDP expanded 0.2%. For full-year 2025, the eurozone economy expanded 1.5%, up from 0.9% in 2024. In 2026, GDP growth is forecast to moderate a bit amid geopolitical tensions and trade policy uncertainty.
- The Bank of Japan upgraded its economic growth forecast for the fiscal year ending in March 2026 to 0.9% from 0.7% in October 2025 and raised its GDP expansion outlook for the 2026 fiscal year to 1% from 0.7%. The BOJ also sees difficult conditions moving forward with rising prices and wages. Inflation has run above the BOJ’s target for 45 consecutive months, and this could lead to additional monetary tightening in the coming months.
Emerging Markets
- China’s economic growth slowed to its weakest pace in nearly three years in Q4 as domestic demand softened, though full-year growth matched Beijing’s target despite growing trade frictions with the U.S. and a prolonged real estate slump. GDP grew 4.5% in Q4, down from the 4.8% pace in Q3. The Chinese economy grew 5% in 2025, matching the government’s official target. In addition, China reported a record trade surplus of nearly $1.2 trillion last year, driven by surging exports to non-U.S. markets as manufacturers redirected shipments to avoid higher U.S. tariffs.
- China’s official manufacturing PMI came in well below forecasts at 49.3 in January, down from December’s 50.1. The manufacturing PMI has been in contractionary territory for 9 of the past 10 months and suggests December's data may have been a blip rather than the start of a recovery trend. There was a broad-based slowdown across most categories. By enterprise size, China's large companies continued to outperform the medium and small enterprises, with large enterprise PMIs still in expansion while medium and small enterprises were in contraction.
- China’s official non-manufacturing PMI fell to a 37-month low in January at 49.4 (down from 50.2 in December). Most of the key sub-indices softened on the month. One of China's main goals is to improve services consumption and quality to boost domestic demand as a growth engine.
- Taiwan’s economy grew 12.7% Y/Y in Q4, fueled by strong demand for technology and semiconductor chips that power artificial intelligence. GDP increased 8.6% in 2025, the fastest pace in 15 years.
- South Korea’s GDP contracted 0.3% Q/Q in Q4, the steepest slowdown since Q4 2022. For the full year, South Korea’s economy grew 1%, its slowest annual expansion since 2020. In Q4, a slump in construction investment and a pullback in exports outweighed modest gains in consumption.
- Mexico's economy showed a 0.8% Q/Q expansion in Q4 2025, rebounding from a 0.3% contraction in Q3. Q4 growth was driven by 0.9% increases in both secondary (manufacturing) and tertiary (services) sectors. In 2025, the Mexican economy grew 1.6%, beating forecasts.
Market Performance (as of 1/31/26)
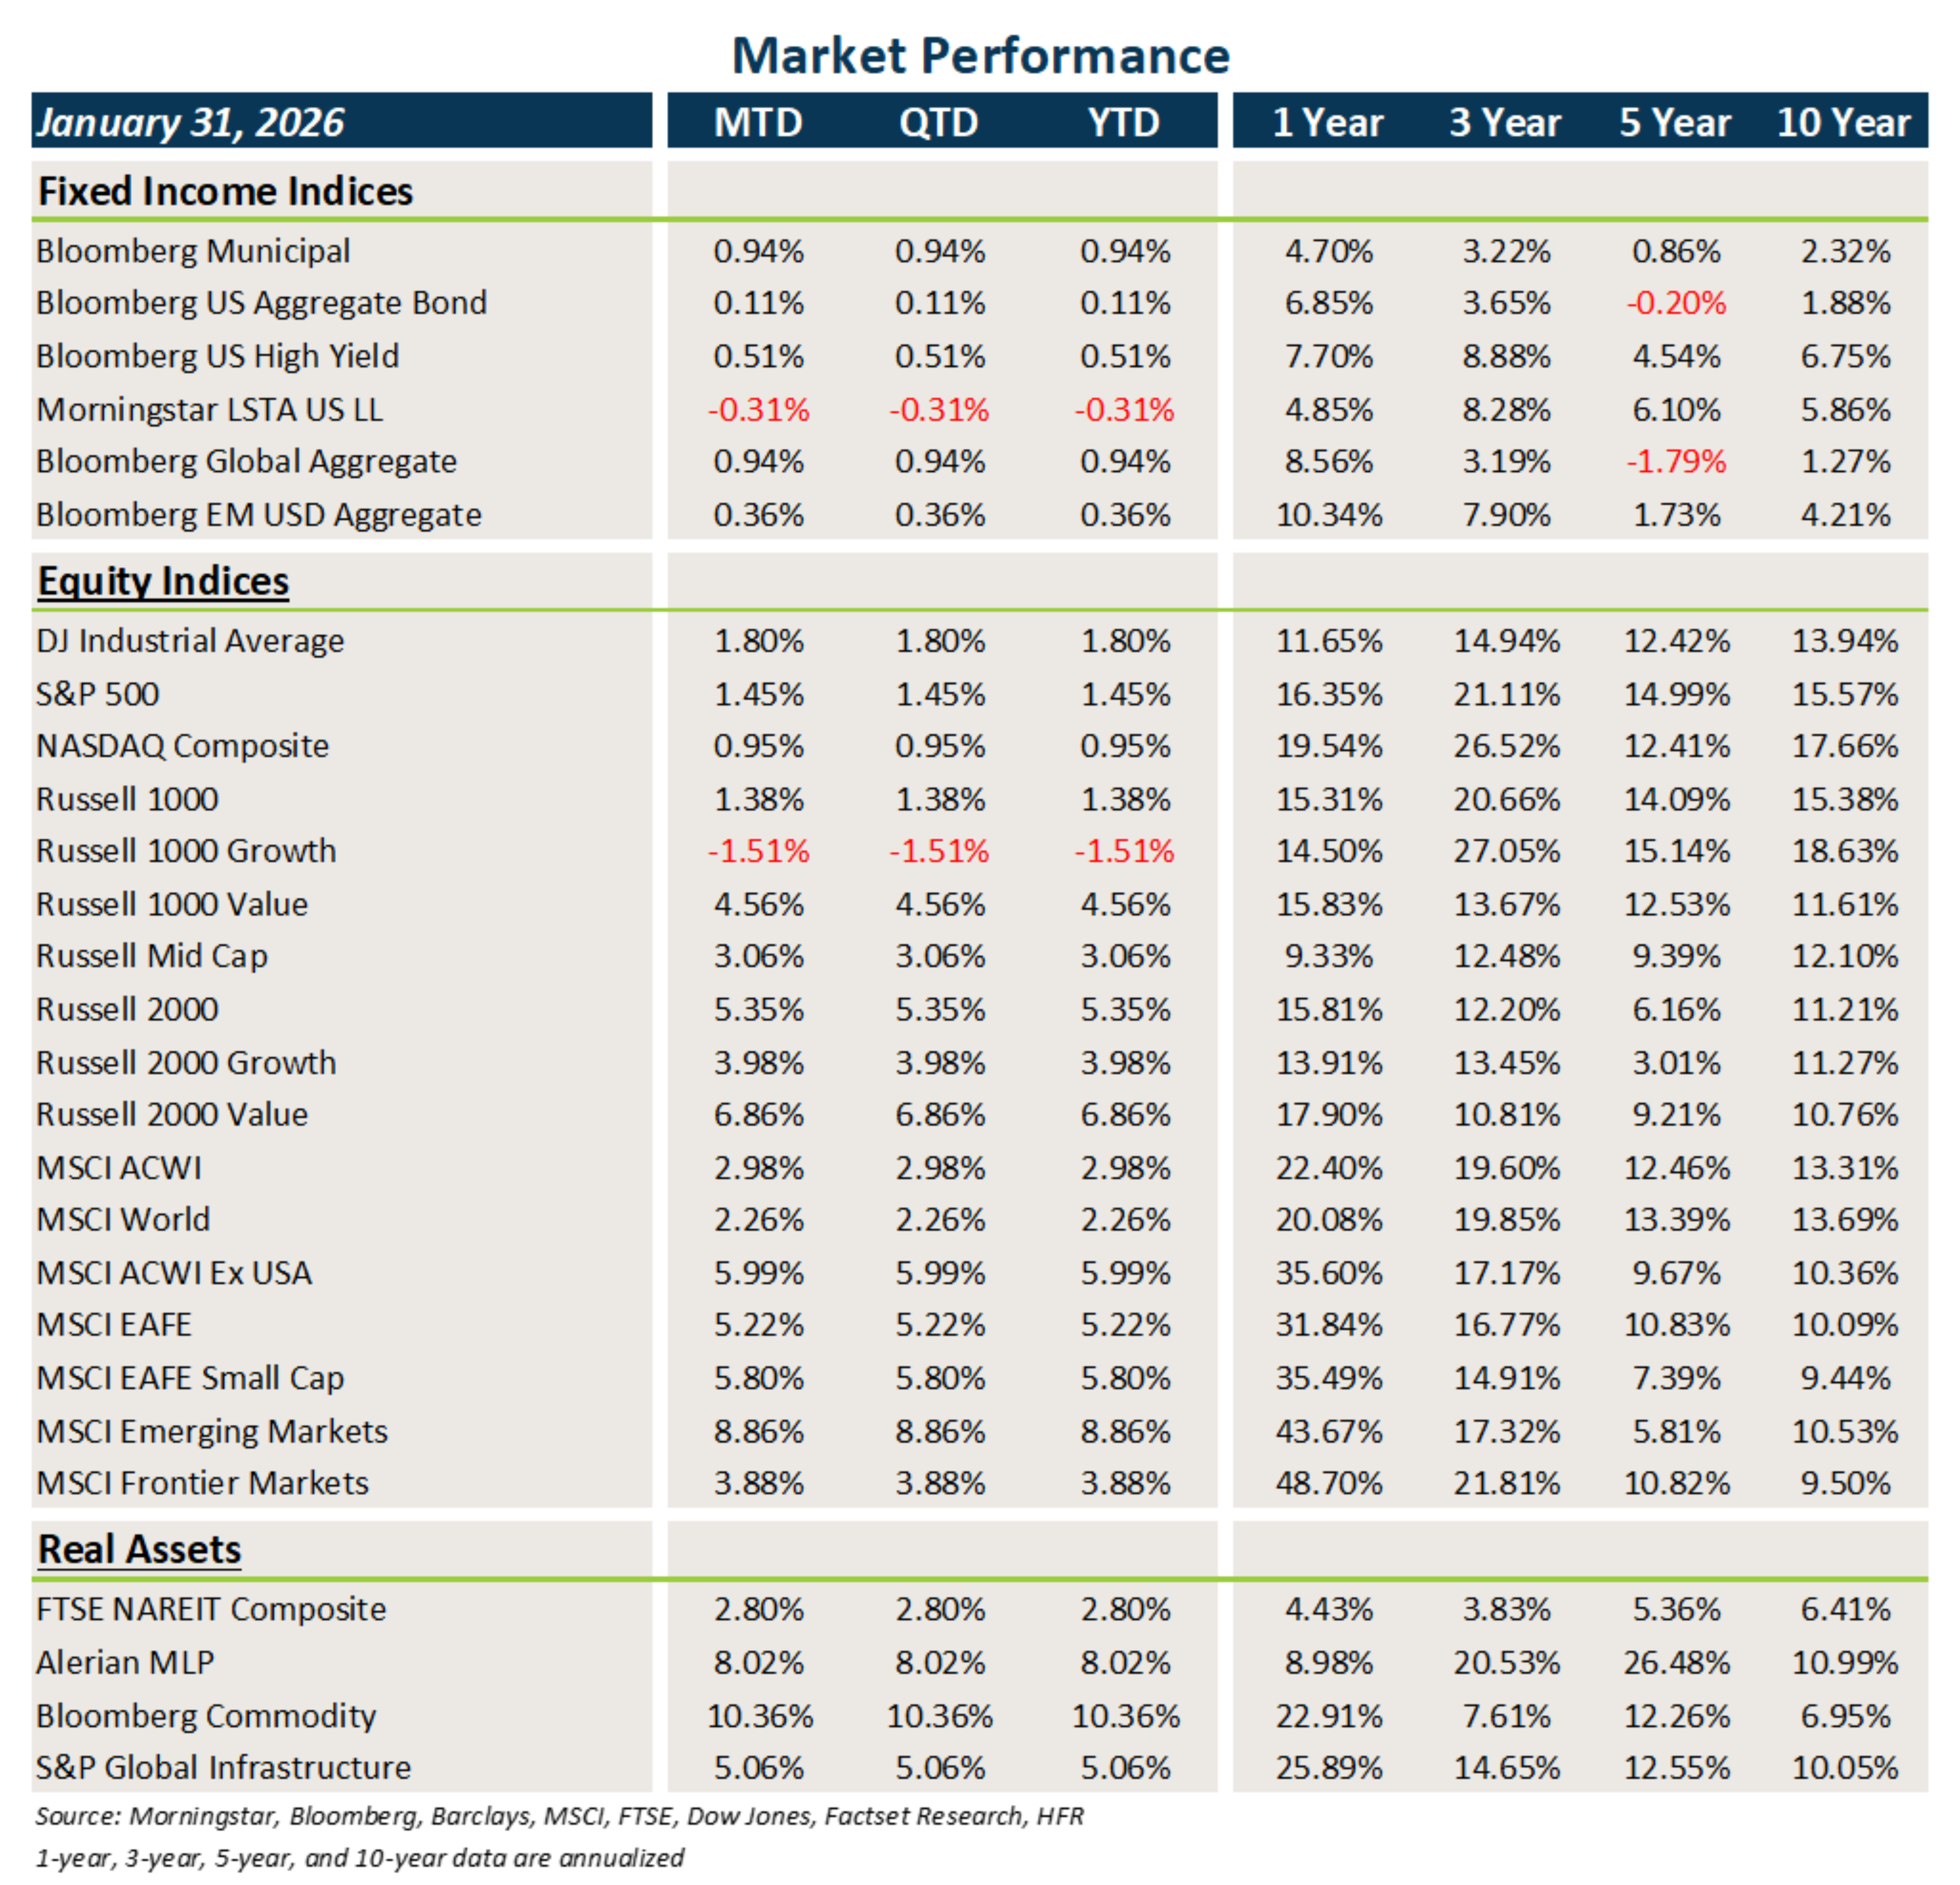
Fixed Income
- Fixed income across the globe eked out small gains in January, driven by higher starting yields and range-bound prices/yields.
- Municipal bonds posted a strong monthly gain compared to core fixed income that struggled with higher Treasury yields.
- Credit generally outperformed, again benefiting from higher carry and the already-tight credit spread environment.
U.S. Equities
- U.S. equities were generally positive last month, led by small caps and value stocks.
- Small caps outperformed large caps, and value stocks outpaced growth stocks across all market capitalizations.
- The R1000 Growth Index was the only major benchmark to post a negative return in January.
Non-U.S. Equities
- Stocks outside the U.S. posted solid gains, driven by EMs, value stocks and small caps.
- EAFE markets outperformed U.S. equities, with the best gains coming from Japanese equities.
- EMs rose nearly 9% last month, with strong gains coming from Latin America, Eastern Europe and Asia excluding China.
- The weaker USD boosted EAFE returns by 76 bps and EM returns by 7 bps.
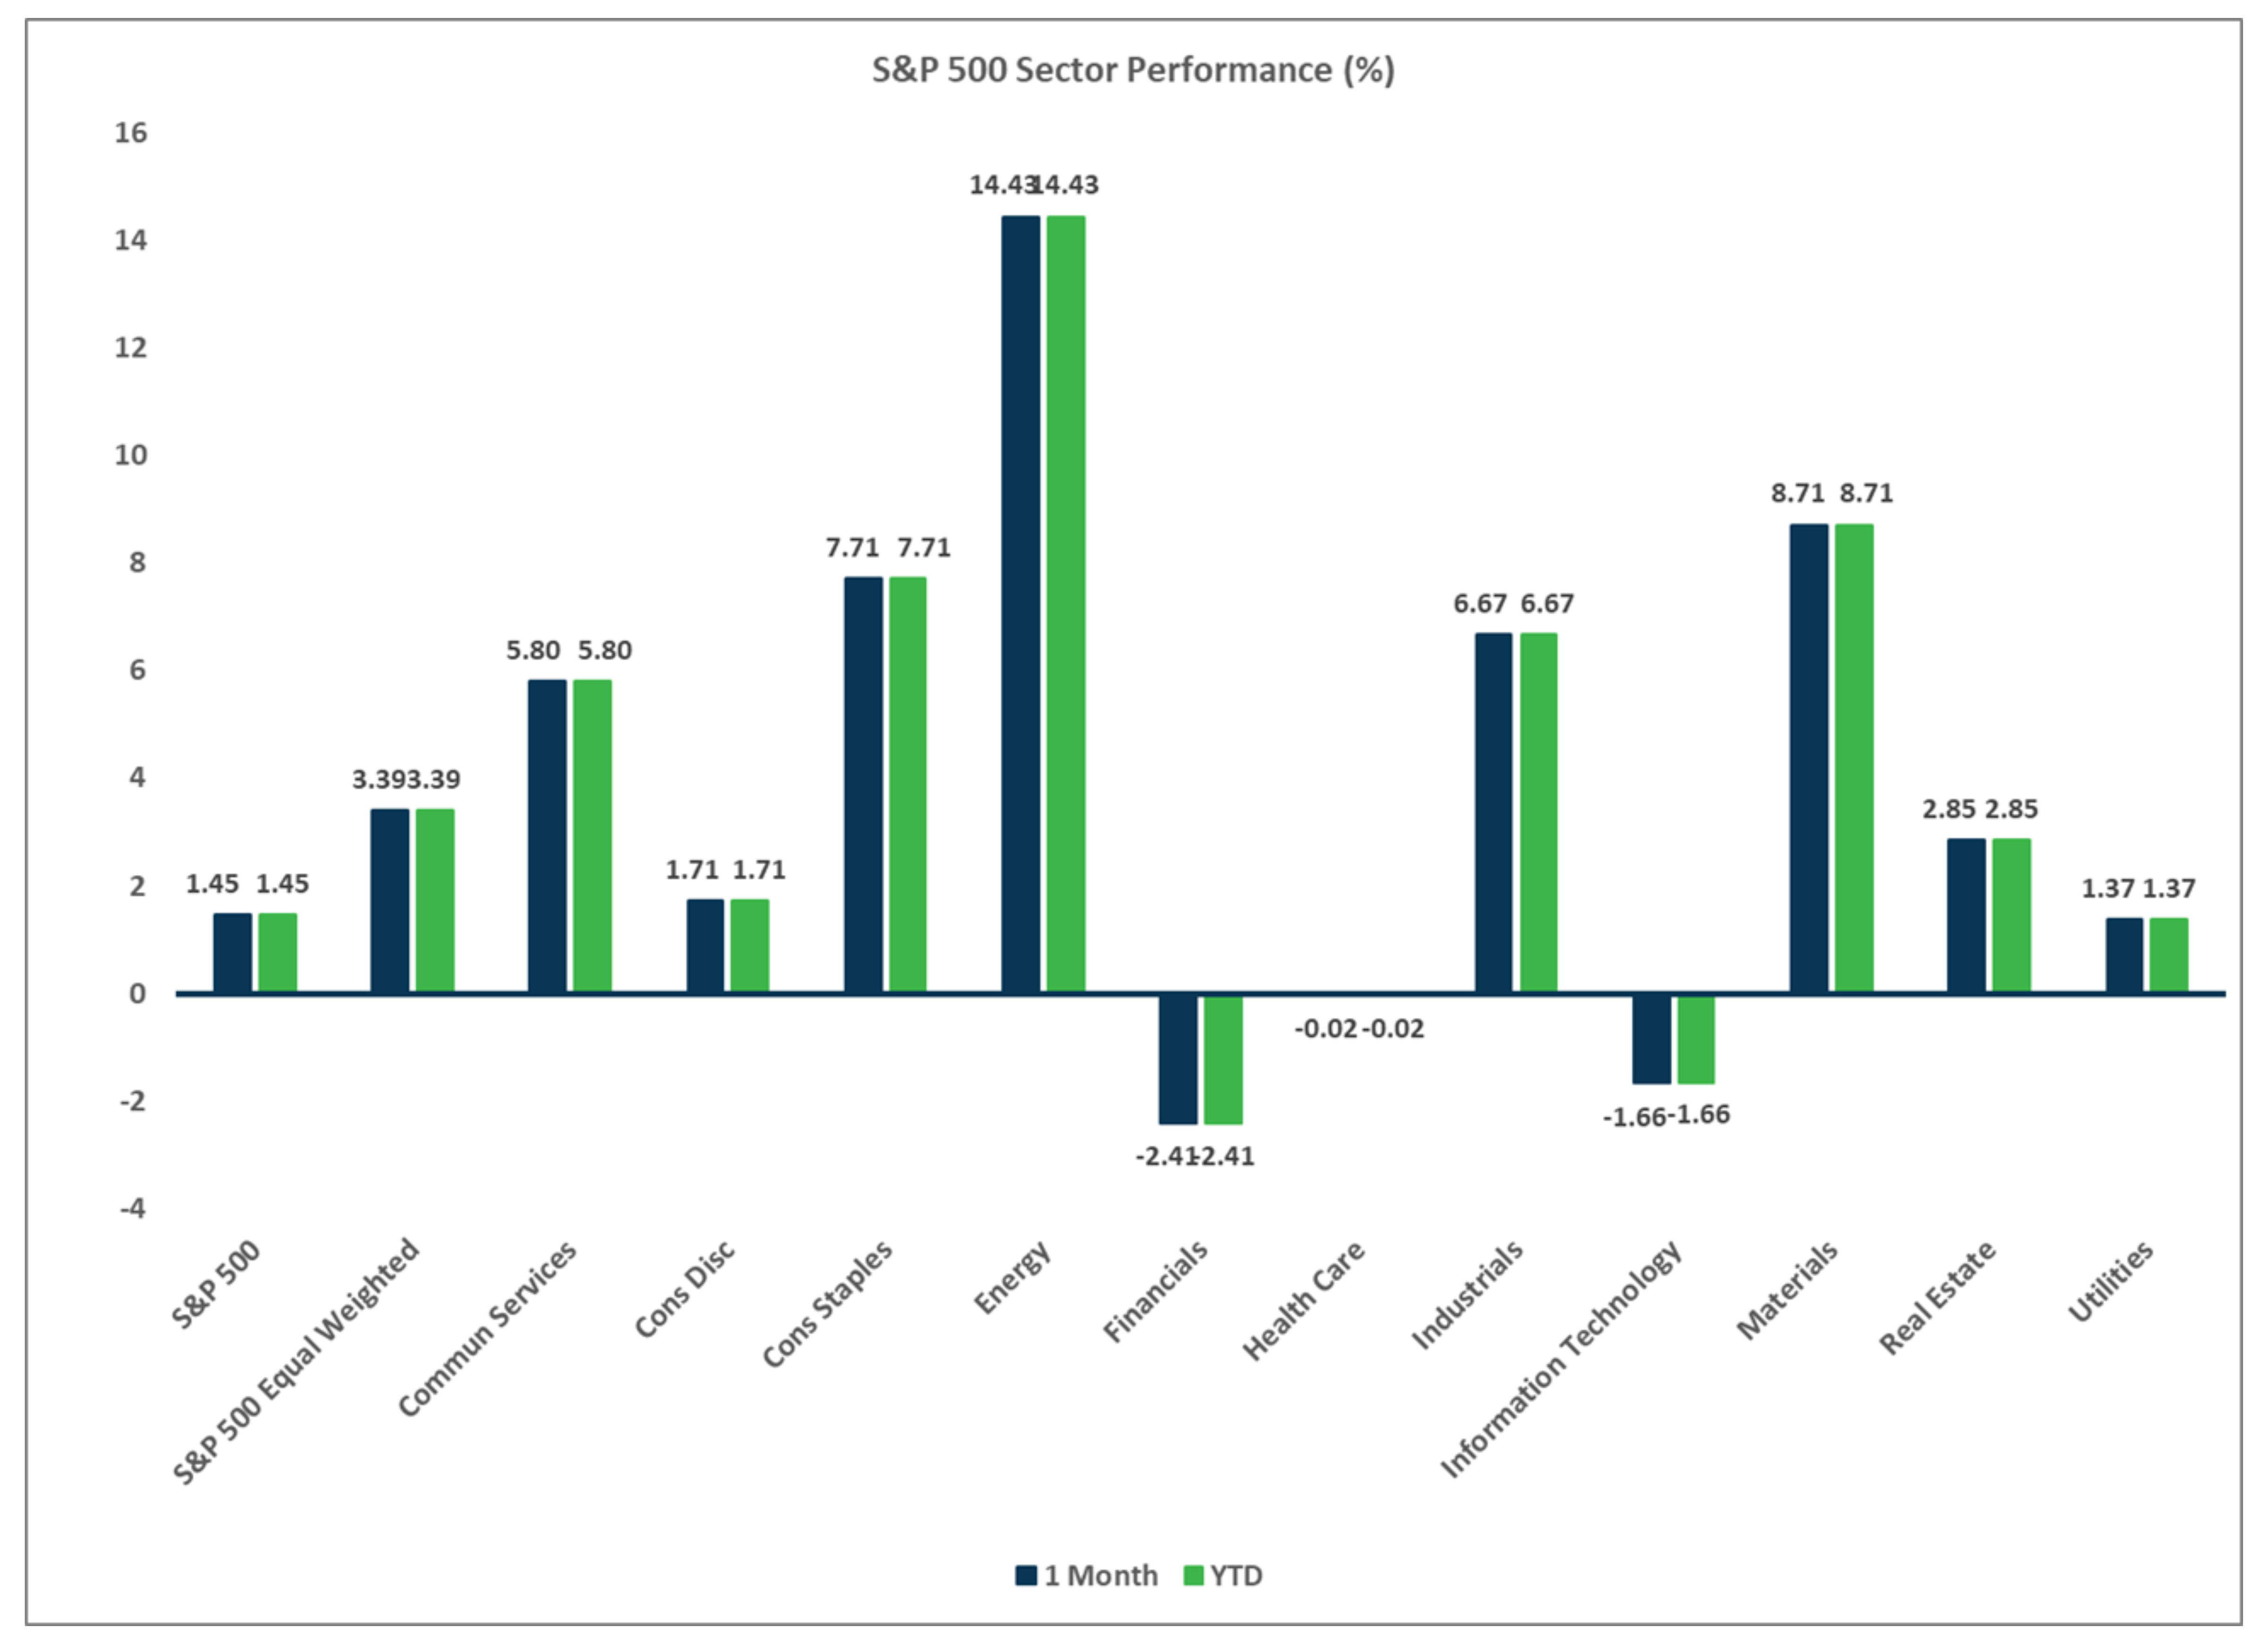
Sector Performance – S&P 500 (as of 1/31/26)
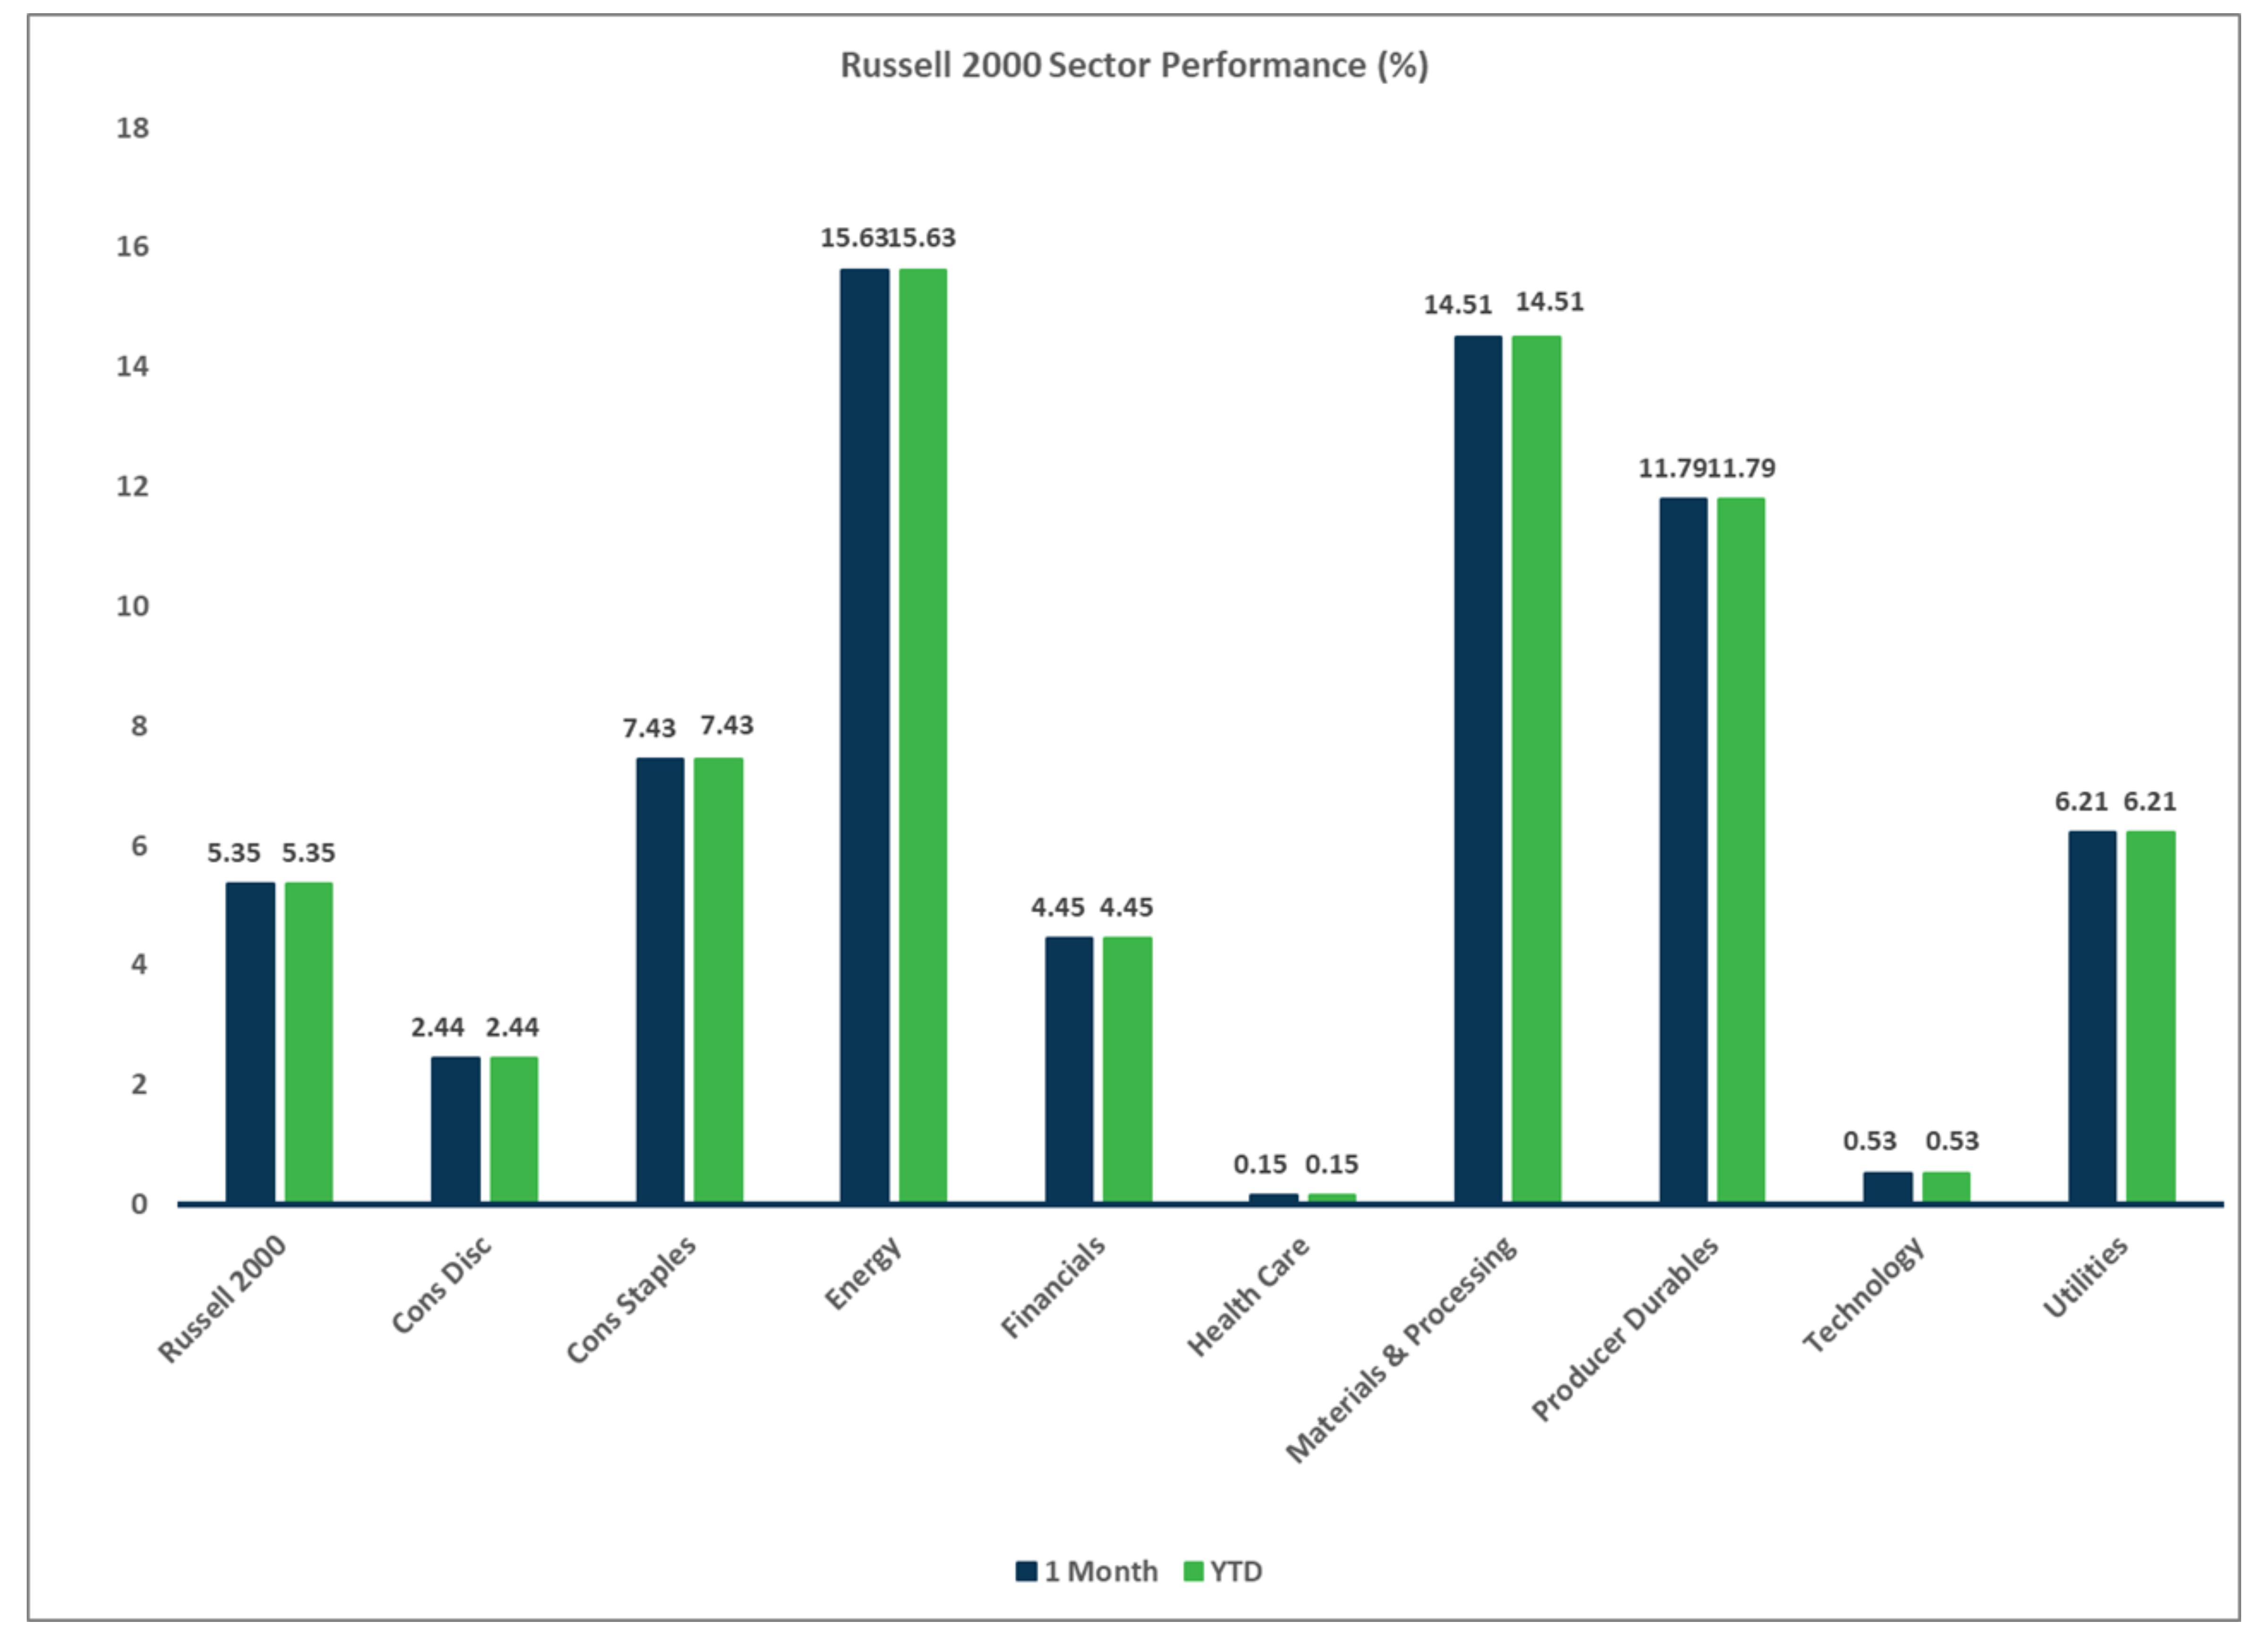
Sector Performance – Russell 2000 (as of 1/31/26)
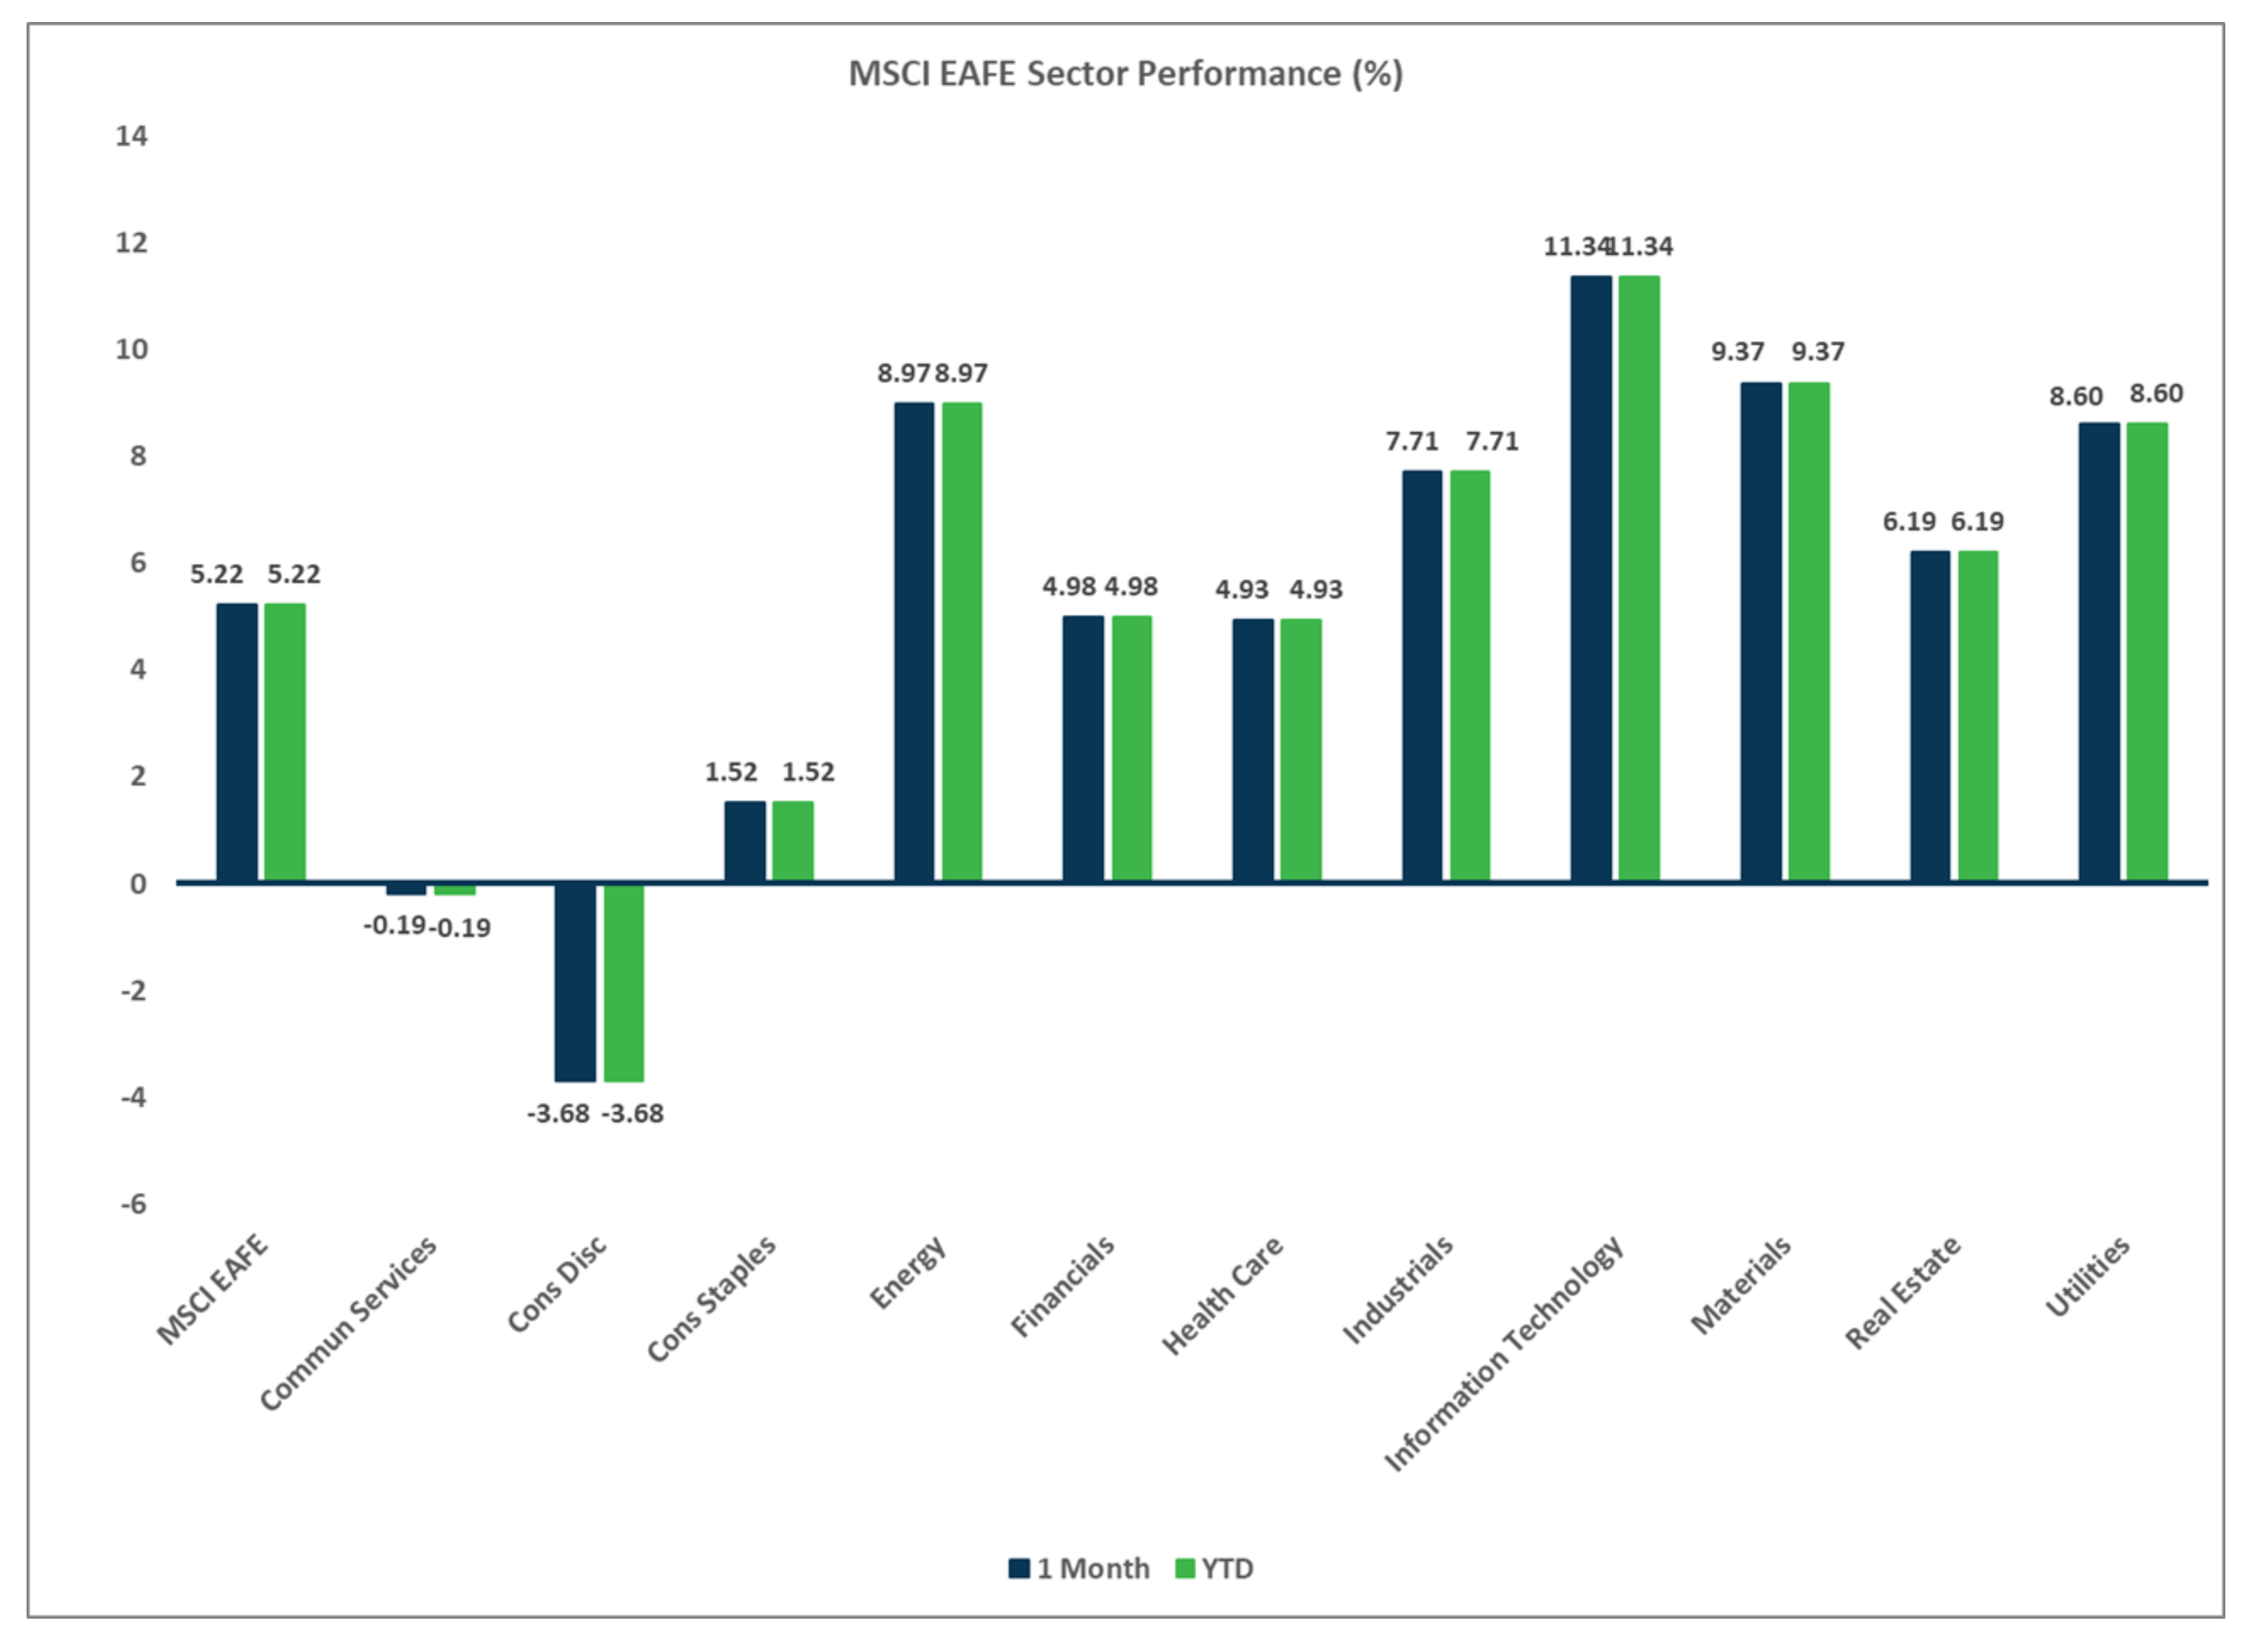
Sector Performance – MSCI EAFE (as of 1/31/26)
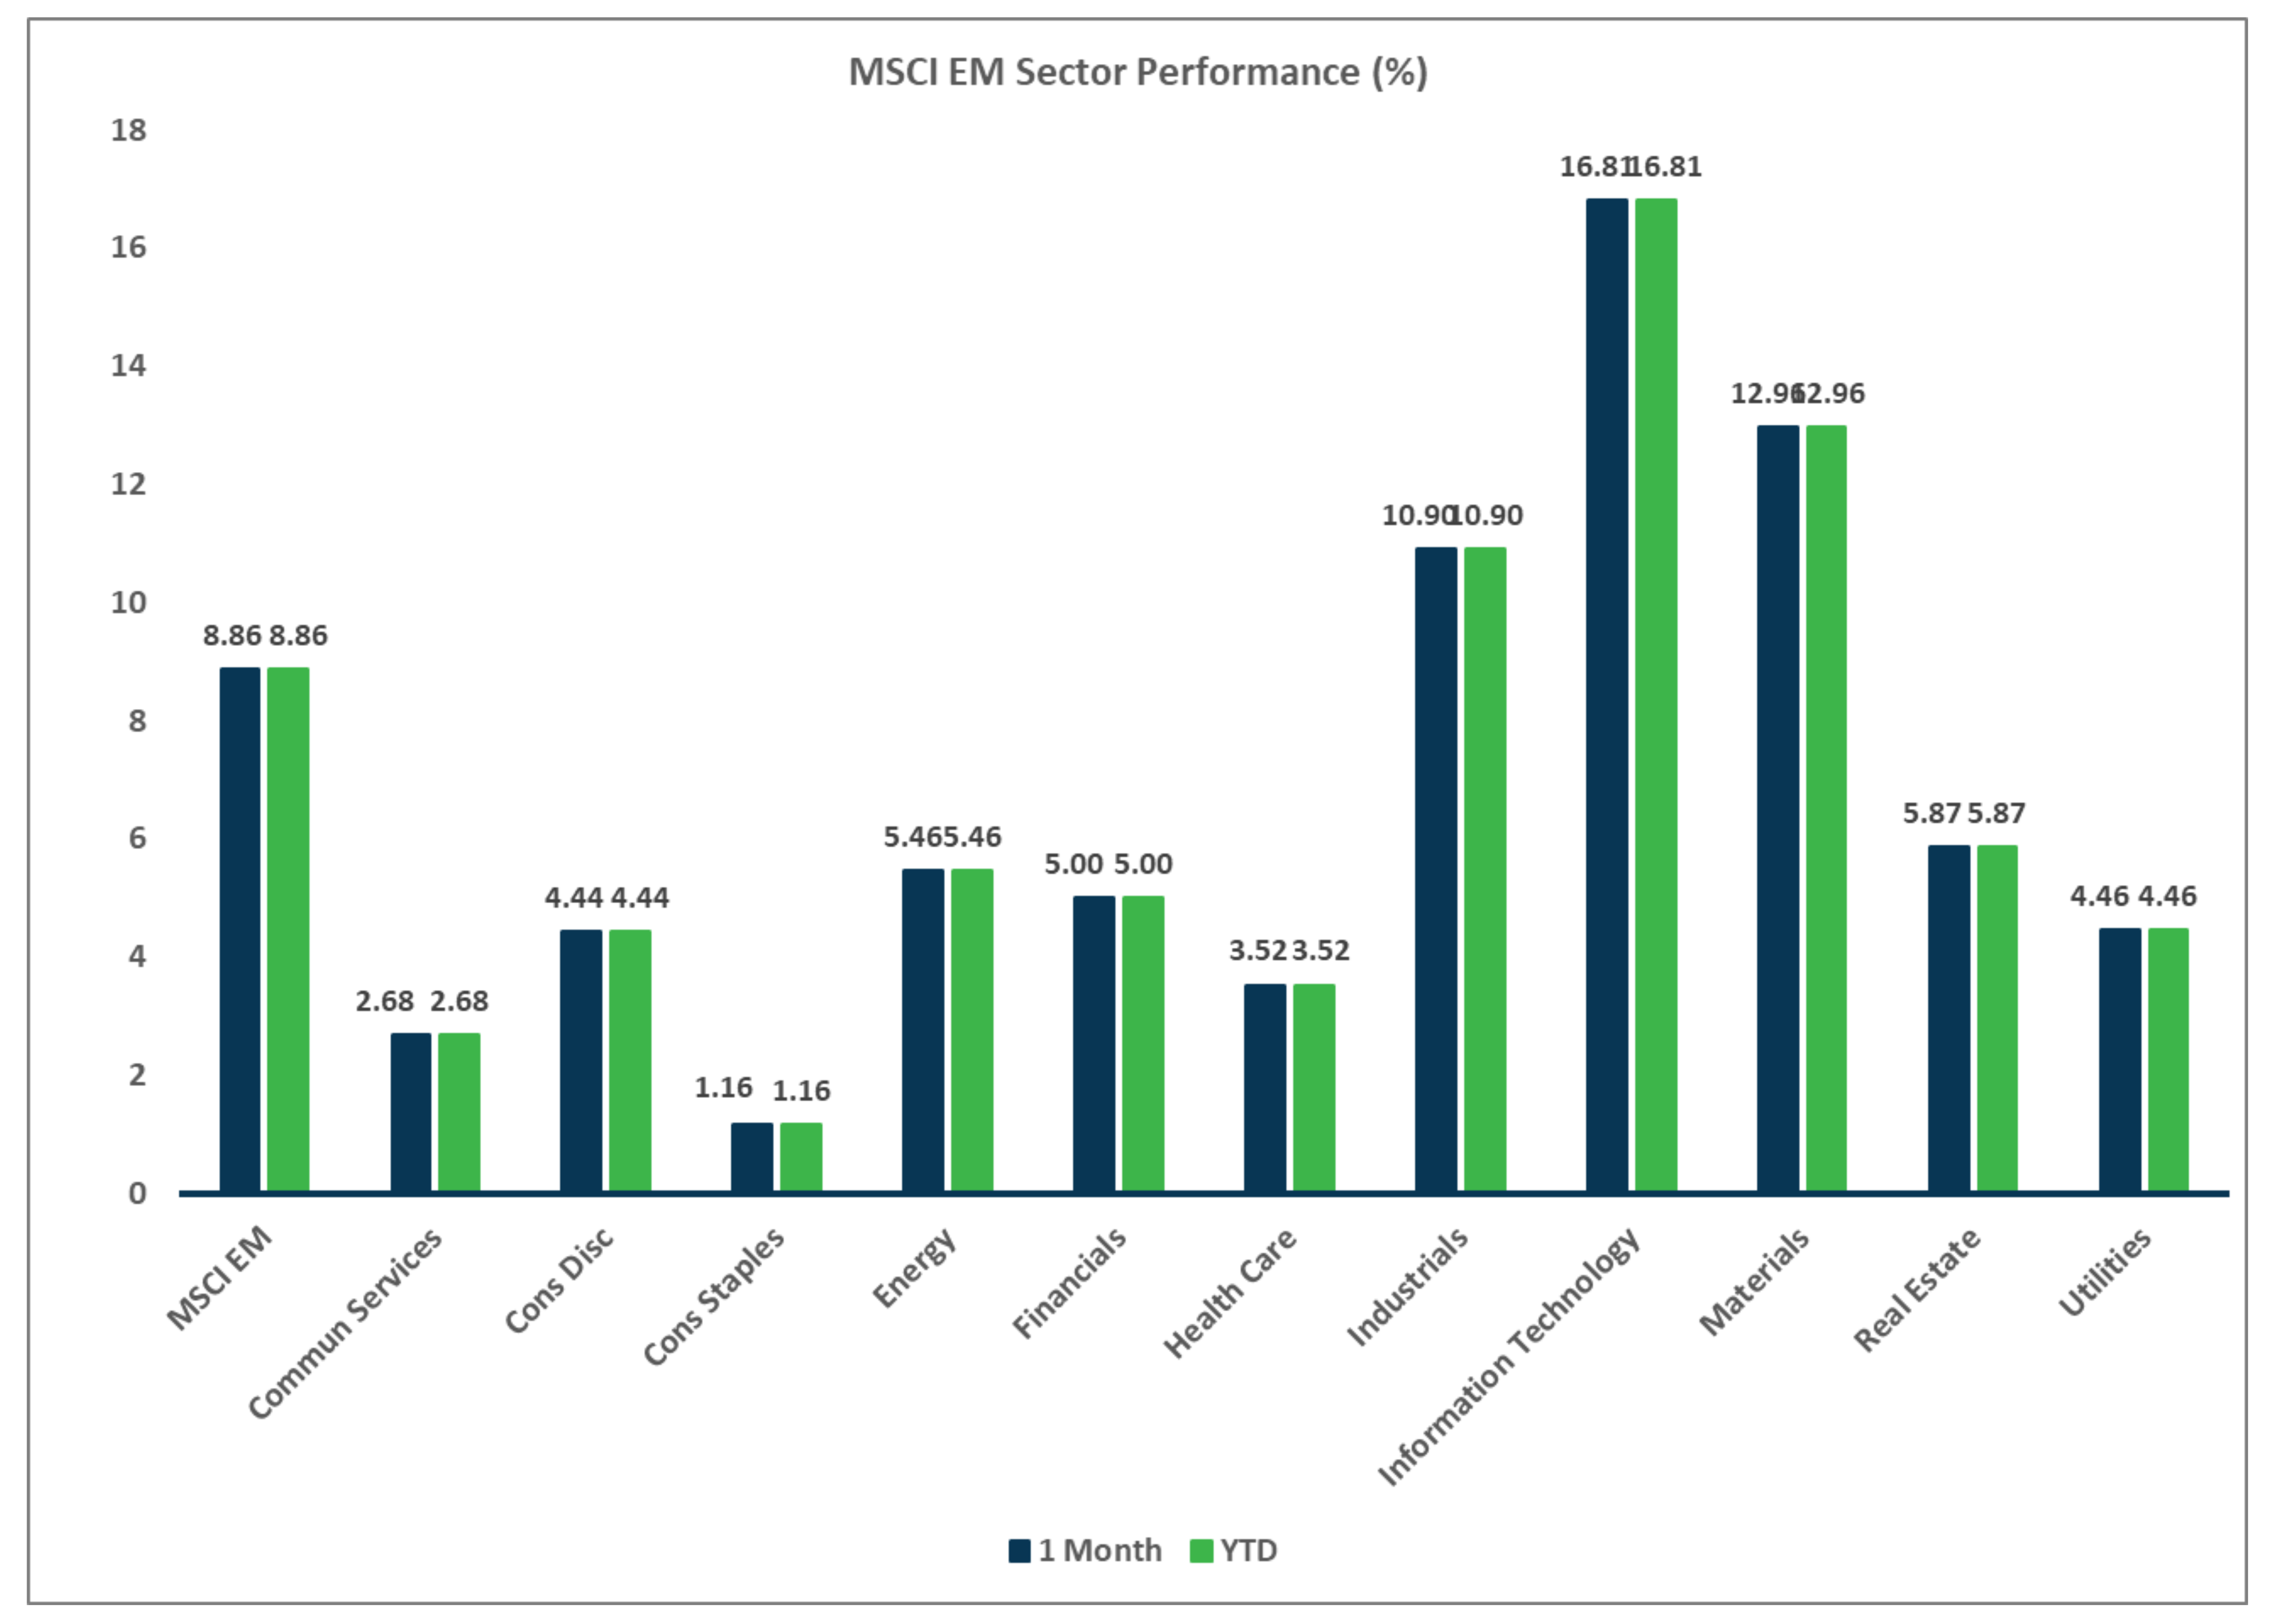
Sector Performance – MSCI EM (as of 1/31/26)
Disclosures
Investment services offered by Enterprise Bank & Trust are not deposits, obligations, or guaranteed by the bank or its affiliates. The information provided represents the opinions of Enterprise Bank & Trust and is not intended to forecast future events or guarantee future results. Past performance does not guarantee future returns. This information is for educational purposes only. Investors should consult with their investment professionals for advice concerning their particular situation.
Investments are: *Not FDIC insured *May lose value *Not financial institution guaranteed *Not a deposit *Not insured by any federal government agency.

