
Capital Markets Playbook | Q3 2026

2026 Q2 Summary
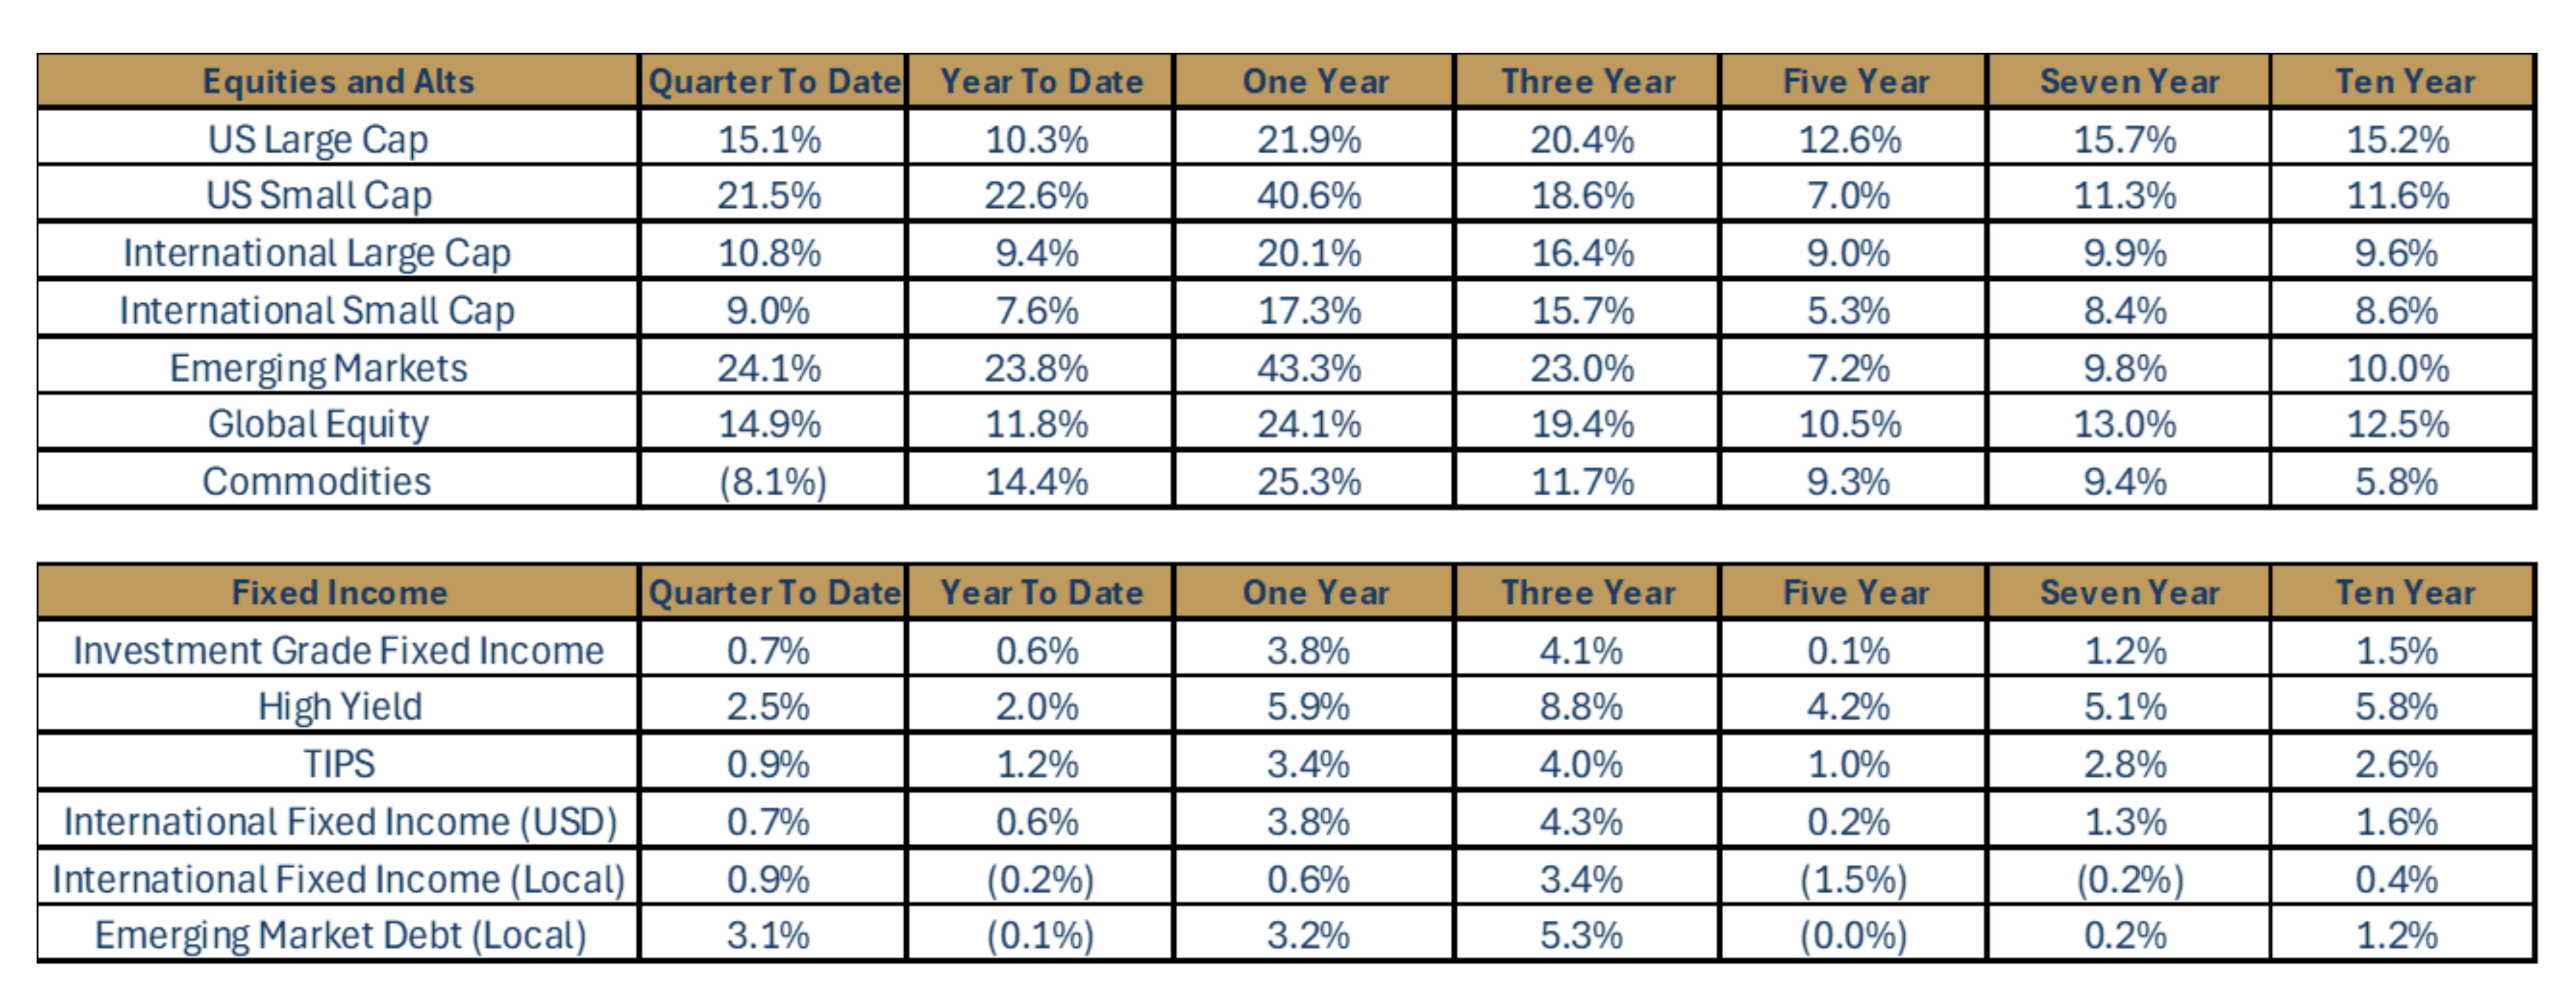
Source: FactSet data as of 6/30/2026. Returns for periods greater than one year are annualized.
- Following a volatile first quarter, global equity markets posted strong gains in the second quarter of 2026.
- U.S. large cap stock indices posted double-digit gains in Q2 (+15.1%) and marked their best quarterly performance since Q2 2020.
- Emerging market equities outperformed other regions in Q2 and were up +24.1%.
- Following strong performance in Q1, primarily due to higher energy prices, commodities were the only negative-performing “risky” asset in Q2.
- Broad-based fixed income markets posted positive gains in the second quarter as well.
- Investment grade fixed income had a modestly positive return in Q2 (+0.7%).
- Riskier fixed income asset classes (ex: high yield, EM debt) outperformed more conservative fixed income asset classes in the quarter (ex: Treasuries, investment grade fixed income).
2026 Q2: In Review
- U.S. Macroeconomic Review
- The U.S. economy grew 2.1% in the first quarter of 2026 due to ongoing strength in consumer spending.
- Economic growth is expected to decelerate slightly in the second quarter of 2026.
- Unemployment, currently 4.2%, declined slightly from the previous reading of 4.3%.
- The Federal Reserve’s preferred measure of inflation, the Personal Consumption Expenditures (PCE) Index, accelerated in the quarter as disruptions to energy supply chains have impacted pricing across various sectors. PCE inflation is now 140 bps above the Fed’s 2% inflation target.
- Middle East tensions shifted from escalation towards de-escalation, helping to bring oil prices significantly lower and easing inflation fears.
- The tariff situation is relatively unchanged. With the recent announcement of section 301 tariffs set to replace section 122 tariffs, there will be no meaningful changes. The effective tariff rate is expected to continue its decline.
- The Fed held its short-term policy rate steady at 3.5-3.75% in Q2. The Fed, under the leadership of a new Fed Chair, Kevin Warsh, hinted that the Committee may hike rates before the end of the year due to persistent inflation.
- Equity Market Review
- Equity market volatility fell in the quarter as tensions in the Middle East eased.
- Broad-based equity markets finished the quarter up +14.9%.
- Growth stocks outperformed, led by strength in semiconductors and other AI-related areas of the market.
- Emerging market equities led all major equity asset classes, followed closely by U.S. small caps, which once again performed exceptionally well (+21.5%).
- Fixed Income Market Review
- The Treasury curve flattened as short-term rates rose more than longer-dated yields, on increased expectations that the Fed may raise rates before year end.
- The two-year yield increased +35 bps in the quarter, while the 10-year yield increased +14 bps.
2026: Expectations for the Year Ahead
- 2026 U.S. Macroeconomic Preview
- Expected Case
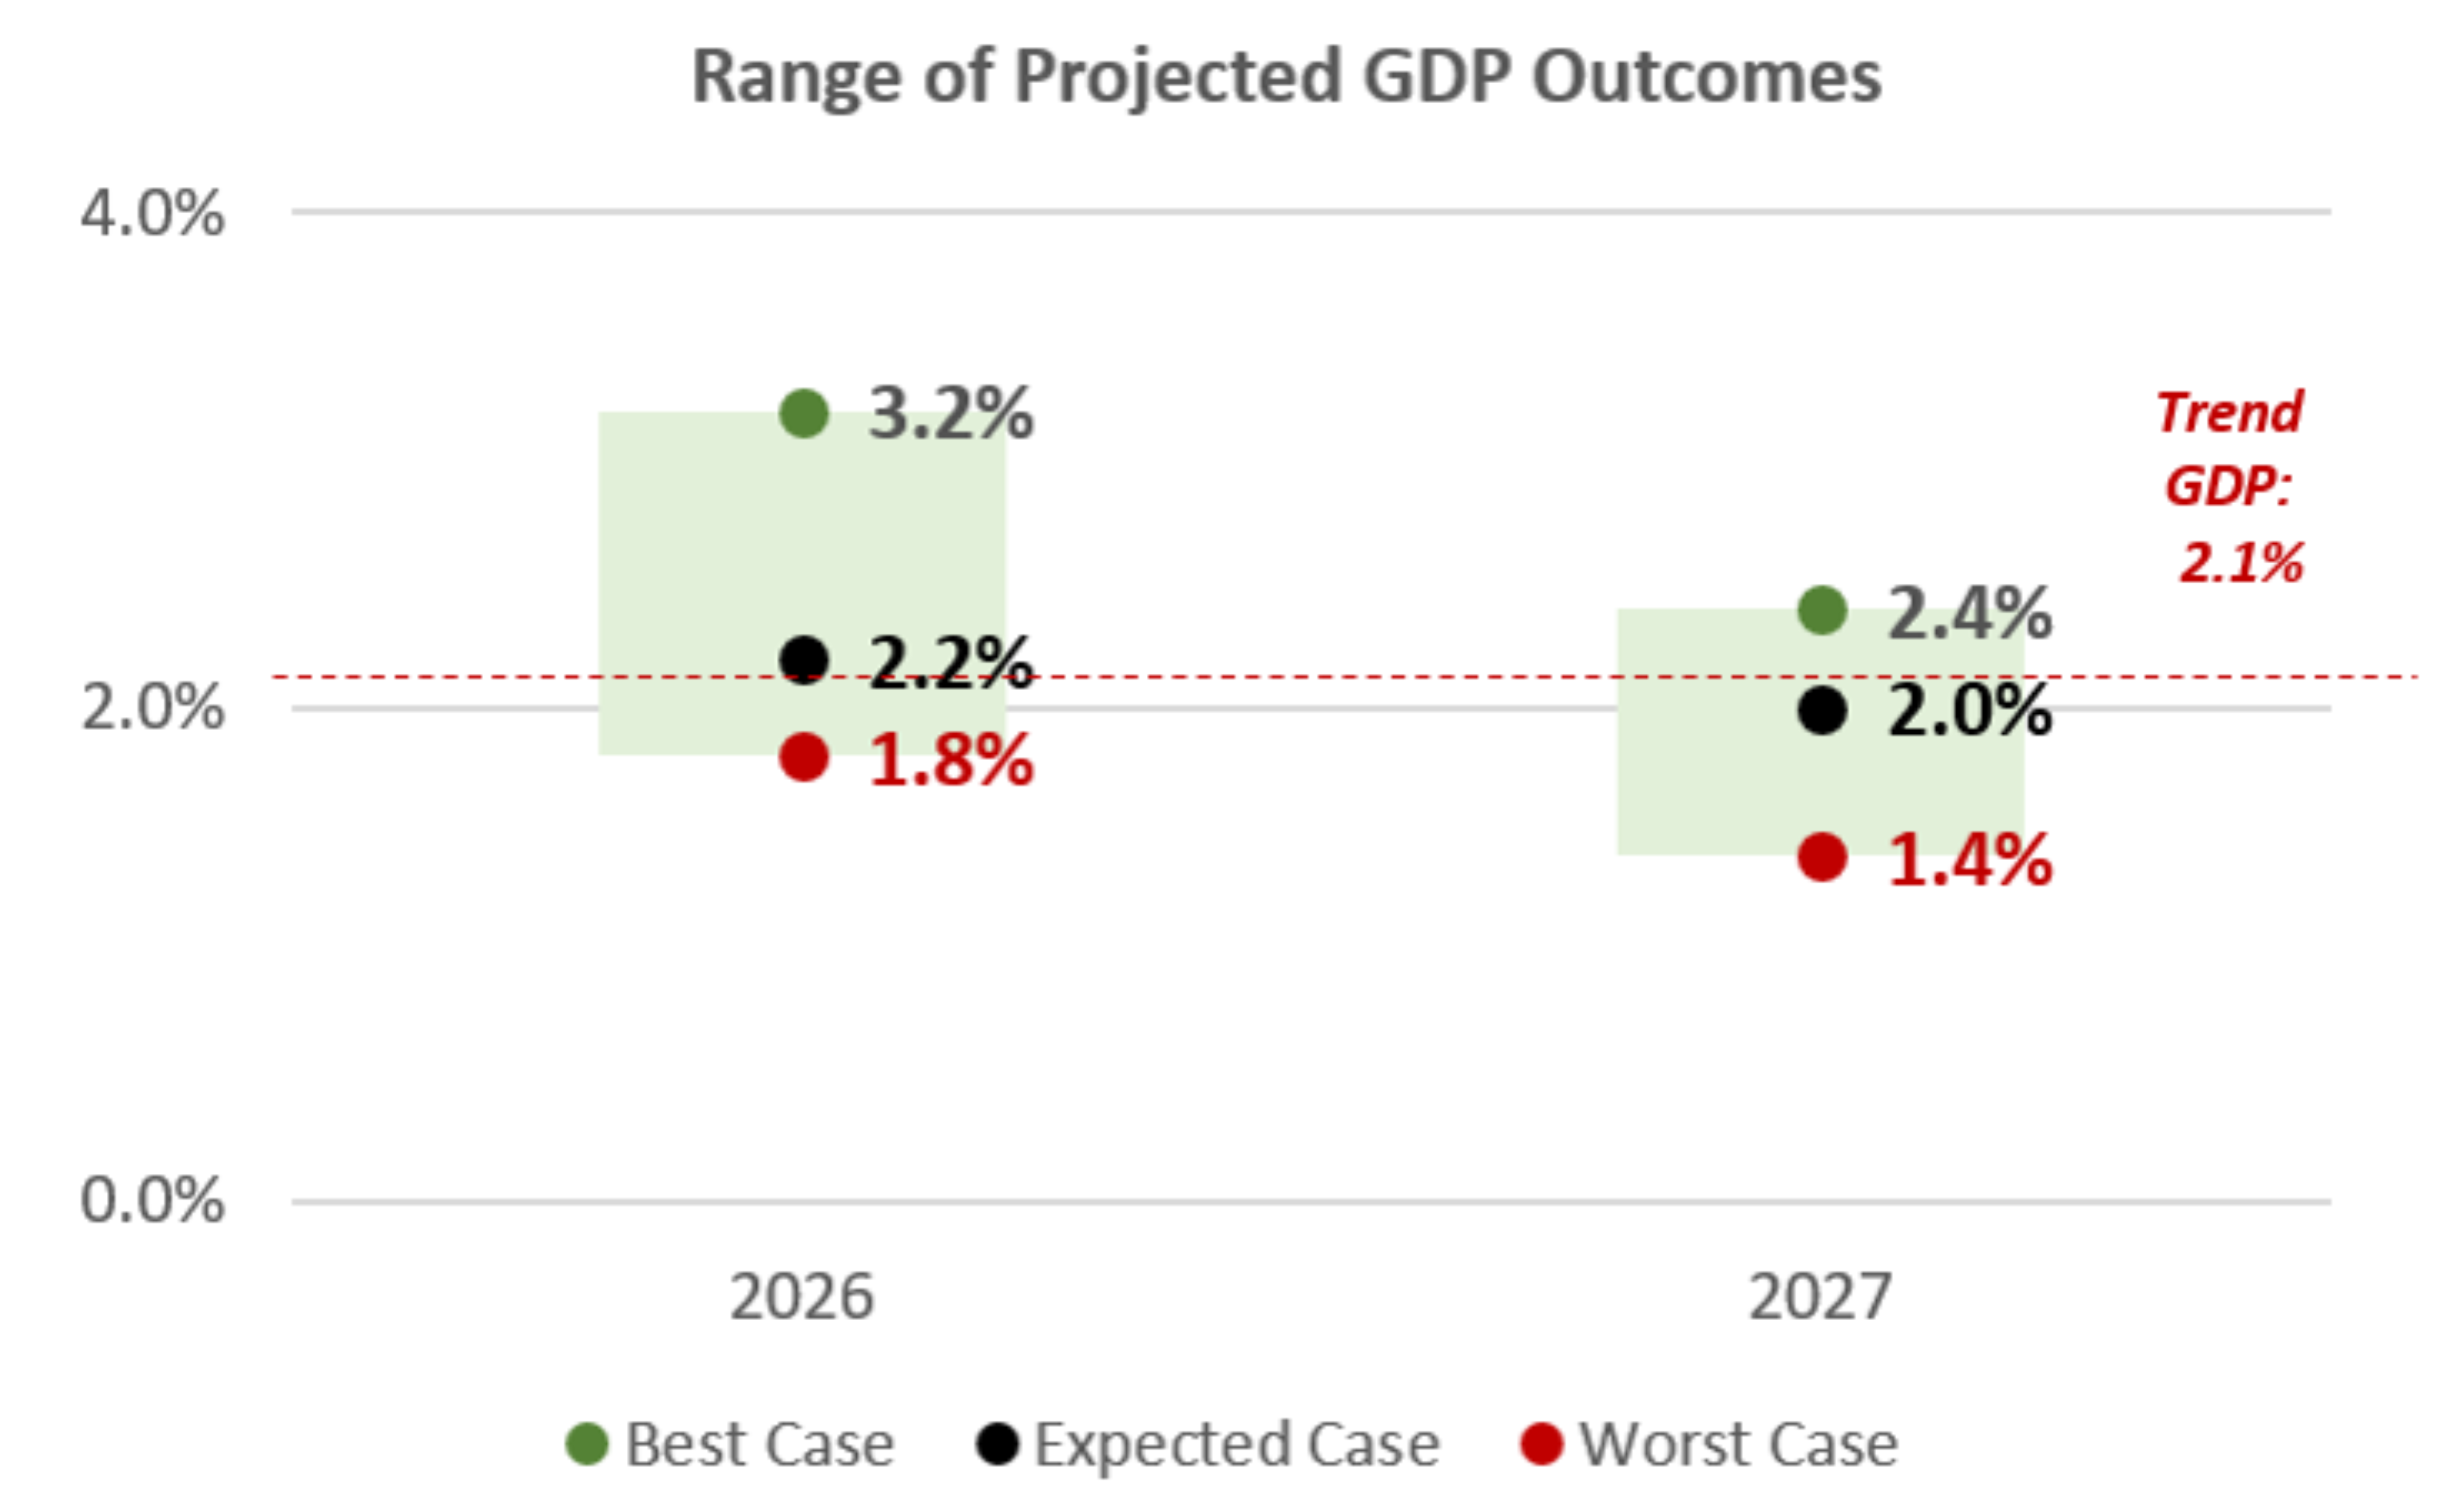
- Economic growth in the United States is expected to be slightly higher than the long-term trend rate of 2.0% in 2026.
- Consumer spending is expected to moderate and come in slightly below the long-term growth rate of 2.5%.
- Unemployment, currently at 4.2%, is expected to remain stable through the end of 2026.
- Wage growth is expected to continue moderating in 2026 towards its long-term growth rate (3.5-4.0%). Real wage growth will remain negative, however, until inflation begins easing.
- Inflation likely peaked in the first half of 2026 and is expected to decline in the second half of the year.
- PCE inflation, the Fed’s preferred measure of inflation, is expected to be around 3.3% by year-end 2026.
- The Fed is expected to increase its short-term policy rate one or two times in 2026, as inflation reaccelerated due to energy supply disruptions in the Middle East and strong employment growth.
- Expected Case
- 2026 Equity Market Preview
- Expected Case
- Volatility driven by geopolitical concerns has eased. However, volatility will likely remain elevated around the popular, and at times crowded, AI trade.
- Corporate earnings are expected to be strong in 2026, with estimates exceeding +20% earnings growth. This estimate strongly outpaces the previous two years of double-digit earnings growth.
- AI-related investment and demand will likely remain a key driver of performance. A broadening of earnings growth beyond the mega-cap tech sector is expected to continue across multiple asset classes and areas of the market.
- Expected Case
- 2026 Fixed Income Preview
- Expected Case
- Short-term interest rates, which are driven by the Fed’s monetary policy, may move higher before the end of the year.
- Intermediate and long-term interest rates, which are not significantly influenced by the Fed’s monetary policy, may prove to be volatile in the months and quarters ahead, as markets weigh concerns over U.S. debt, deficits and sticky inflation.
- Expected Case
Risks to the “Expected Case” in 2026
- Elevated Asset Class Valuations
- Equities and real estate make up a significant percentage of households’ total net worth. Equities and homes had significant price gains for the past five years, which has led to fairly expensive valuations. A reduction in asset values would likely lead to slower spending growth, weaker labor markets and slower economic growth.
- Unexpected Labor Market Weakness
- An unexpected softening of the labor market would create headwinds to consumer spending and lead to slower economic growth.
- Unexpected labor market weakness may create a more acute “affordability crisis” for low- and middle-income households.
- An Unexpected Pickup in Inflation
- Tariffs on imported goods could impact inflation as the effects are still working their way through the economy.
- Rising energy prices have historically pressured headline inflation. If the conflict in the Middle East escalates again or if oil supply remains disrupted for an extended period, inflation expectations may rise further.
- Mounting Concerns Over U.S. Debt and Deficits
- Mounting concerns over U.S. debt and deficits could lead to higher long-term interest rates.
- Unexpected Geopolitical Issues and Midterm Elections
- Unexpected geopolitical events can significantly influence financial markets over short periods of time.
- Uncertainty associated with U.S. foreign policy could have negative impacts on market volatility, global trade flows and the global economy.
- The lead up to midterm elections in the United States could present heightened headline risks, resulting in increased volatility over the short term.
- The “Unknown Unknowns”
- The most threatening risks to the “expected case” are always those that catch markets by surprise. The most recent examples of exogenous shocks are the emergence of COVID-19 in late 2019/early 2020 and the tariff announcements in early 2025.
2026 Expectations: Economic Growth
- U.S. economic growth is expected to continue its current growth path, remaining near trend levels through 2027.
- Unemployment is expected to remain stable and consumer spending is expected to remain fairly strong in 2026.
- While the probability of an economic contraction in the United States may be higher today due to energy-related supply disruptions overseas, the expectation for continued strength in consumer spending implies a low recession risk in 2026.
- Scenarios
- Best Case
- Economic activity in the United States will come in well above its long-term trend rate over the next two years.
- Expected Case
- Economic activity in the United States is near its long-term growth rate over the next two years.
- Worst Case
- Economic activity will fall below its long-term trend rate over the next two years.
- Best Case
2026 Expectations: Unemployment
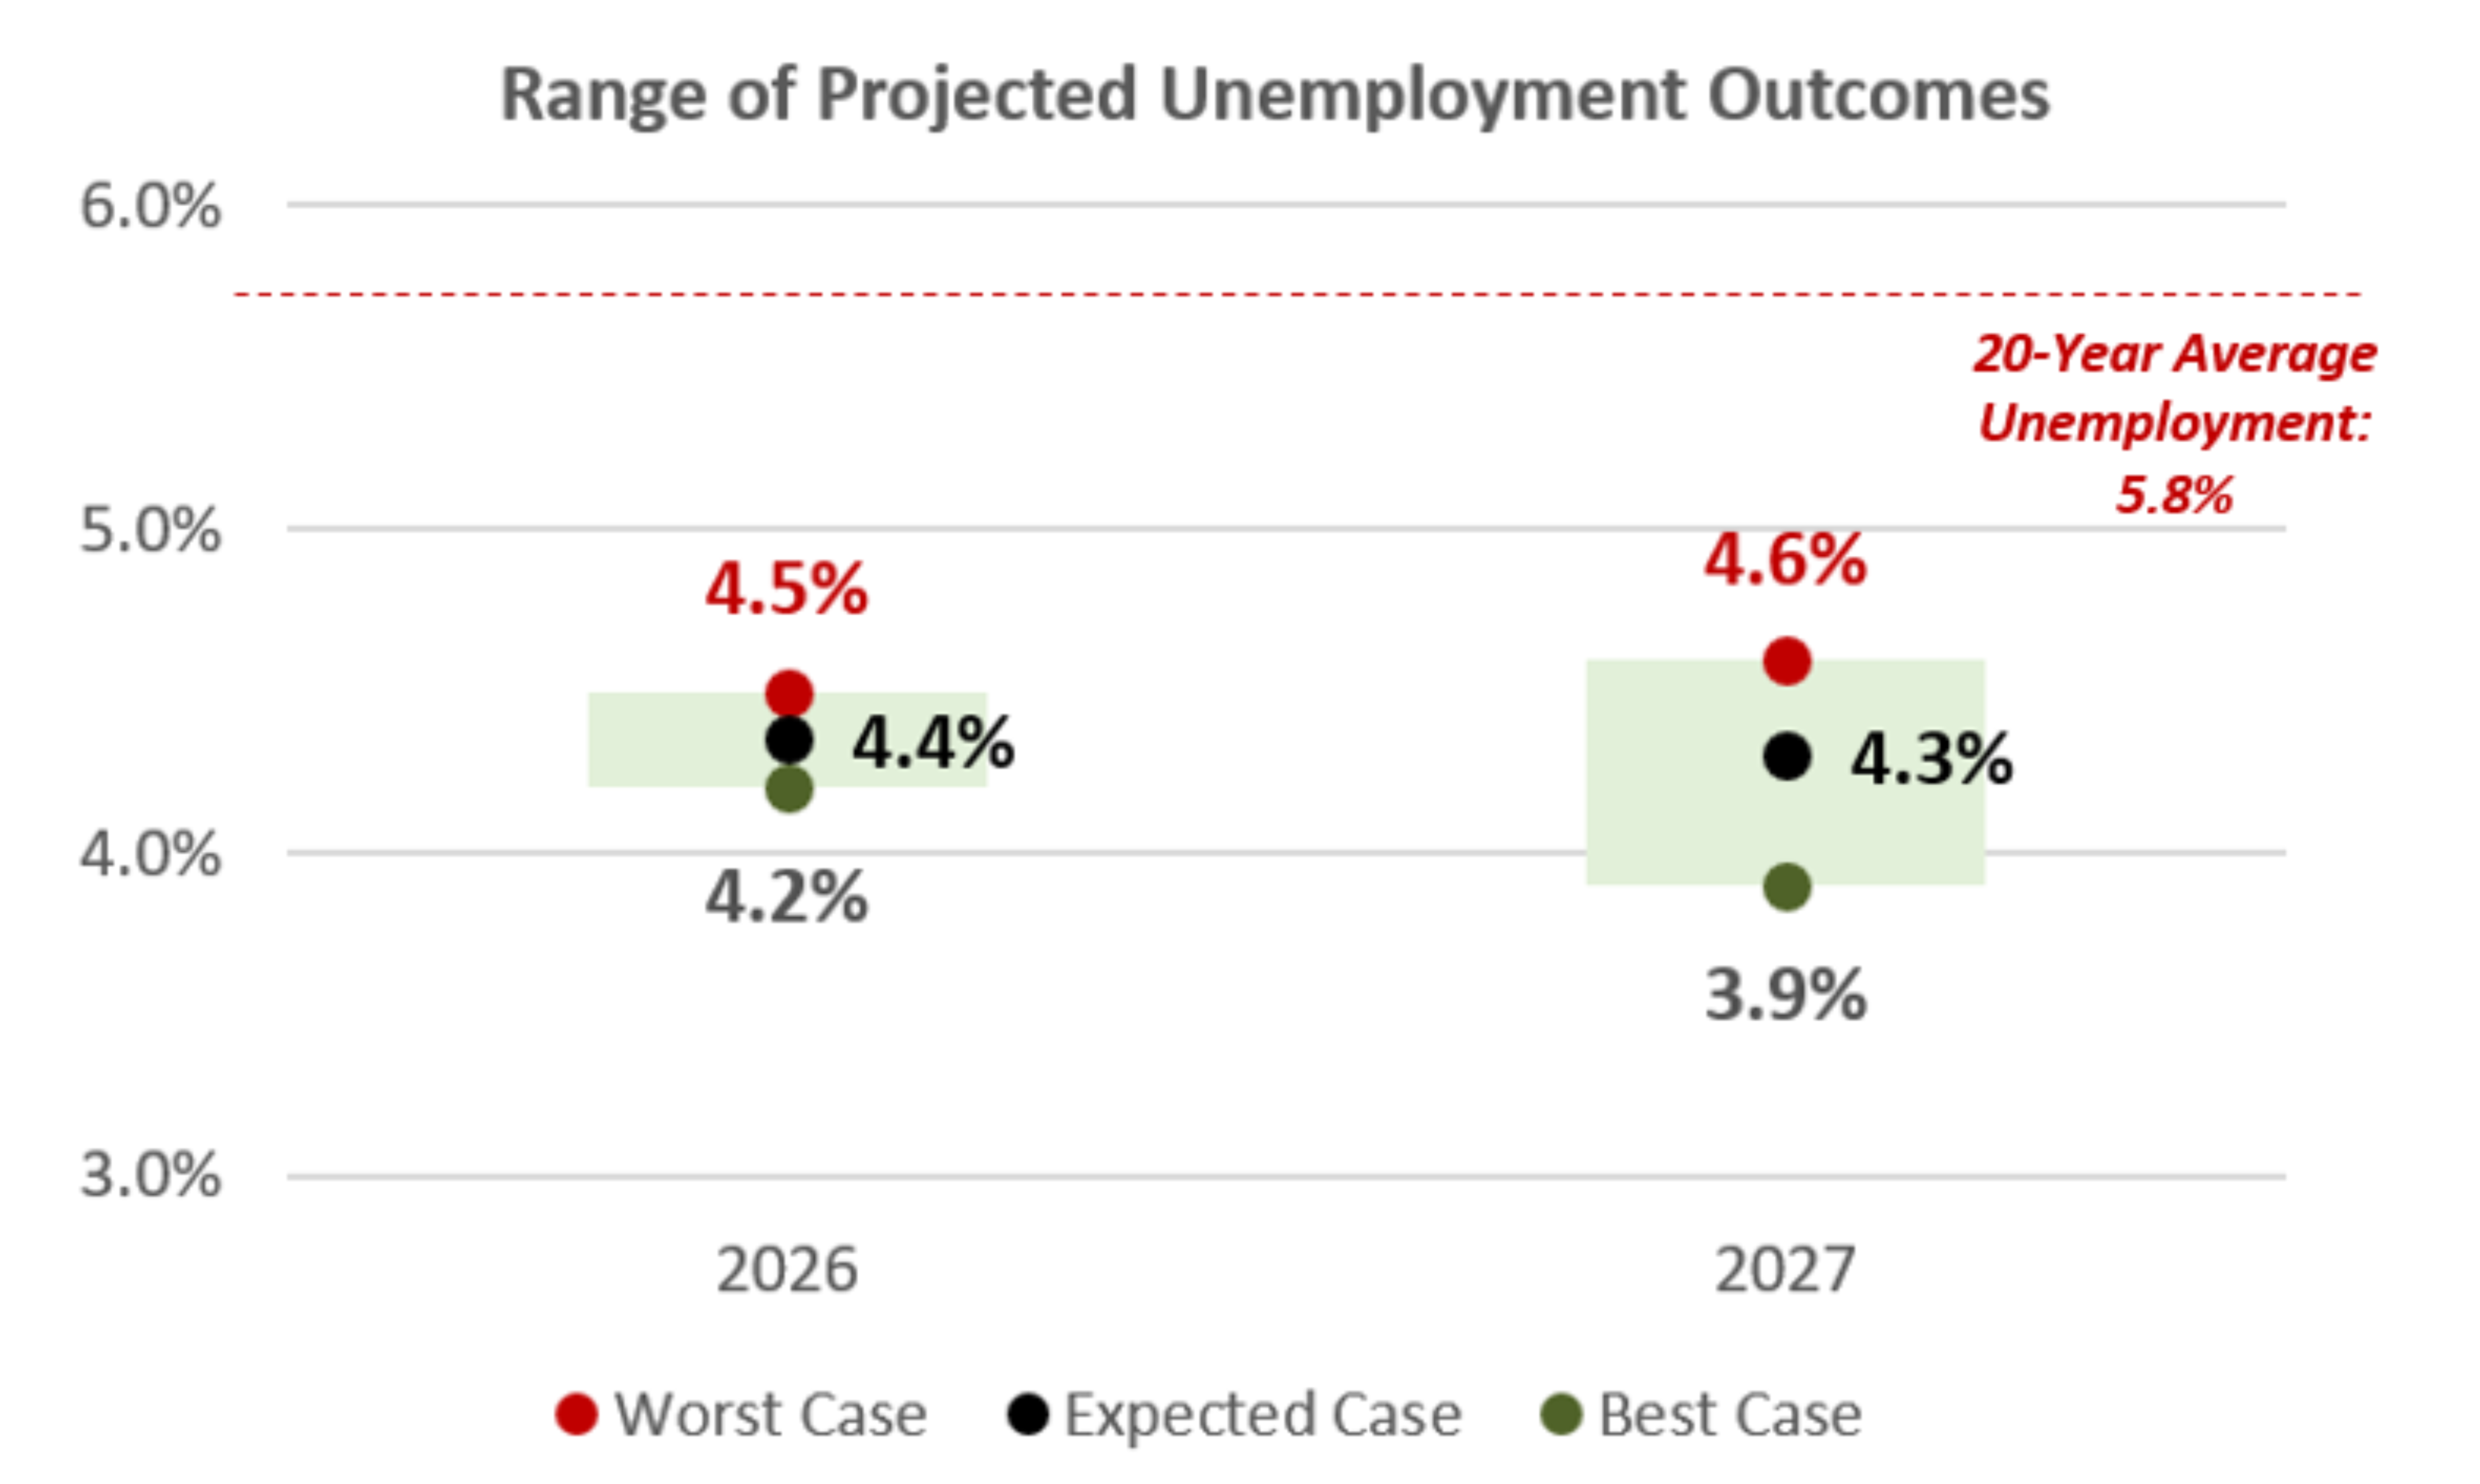
- Unemployment in the United States has declined from the start of the year and is now at 4.2%, well below its long-term average.
- Unemployment is expected to remain fairly stable through 2026.
- While few expect unemployment to increase meaningfully through 2027, the risk of a meaningful spike in unemployment cannot be ruled out.
- Scenarios
- Best Case
- Unemployment declines from its current level and remains near historical lows over the next two years.
- Expected Case
- Unemployment increases slightly from current levels of 4.2% as the U.S. economy grows and remains well below its longer-term trend rate.
- Worst Case
- Unemployment rises slightly through the end of 2027 as a result of meaningfully slower economic growth.
- Best Case
2026 Expectations: Inflation
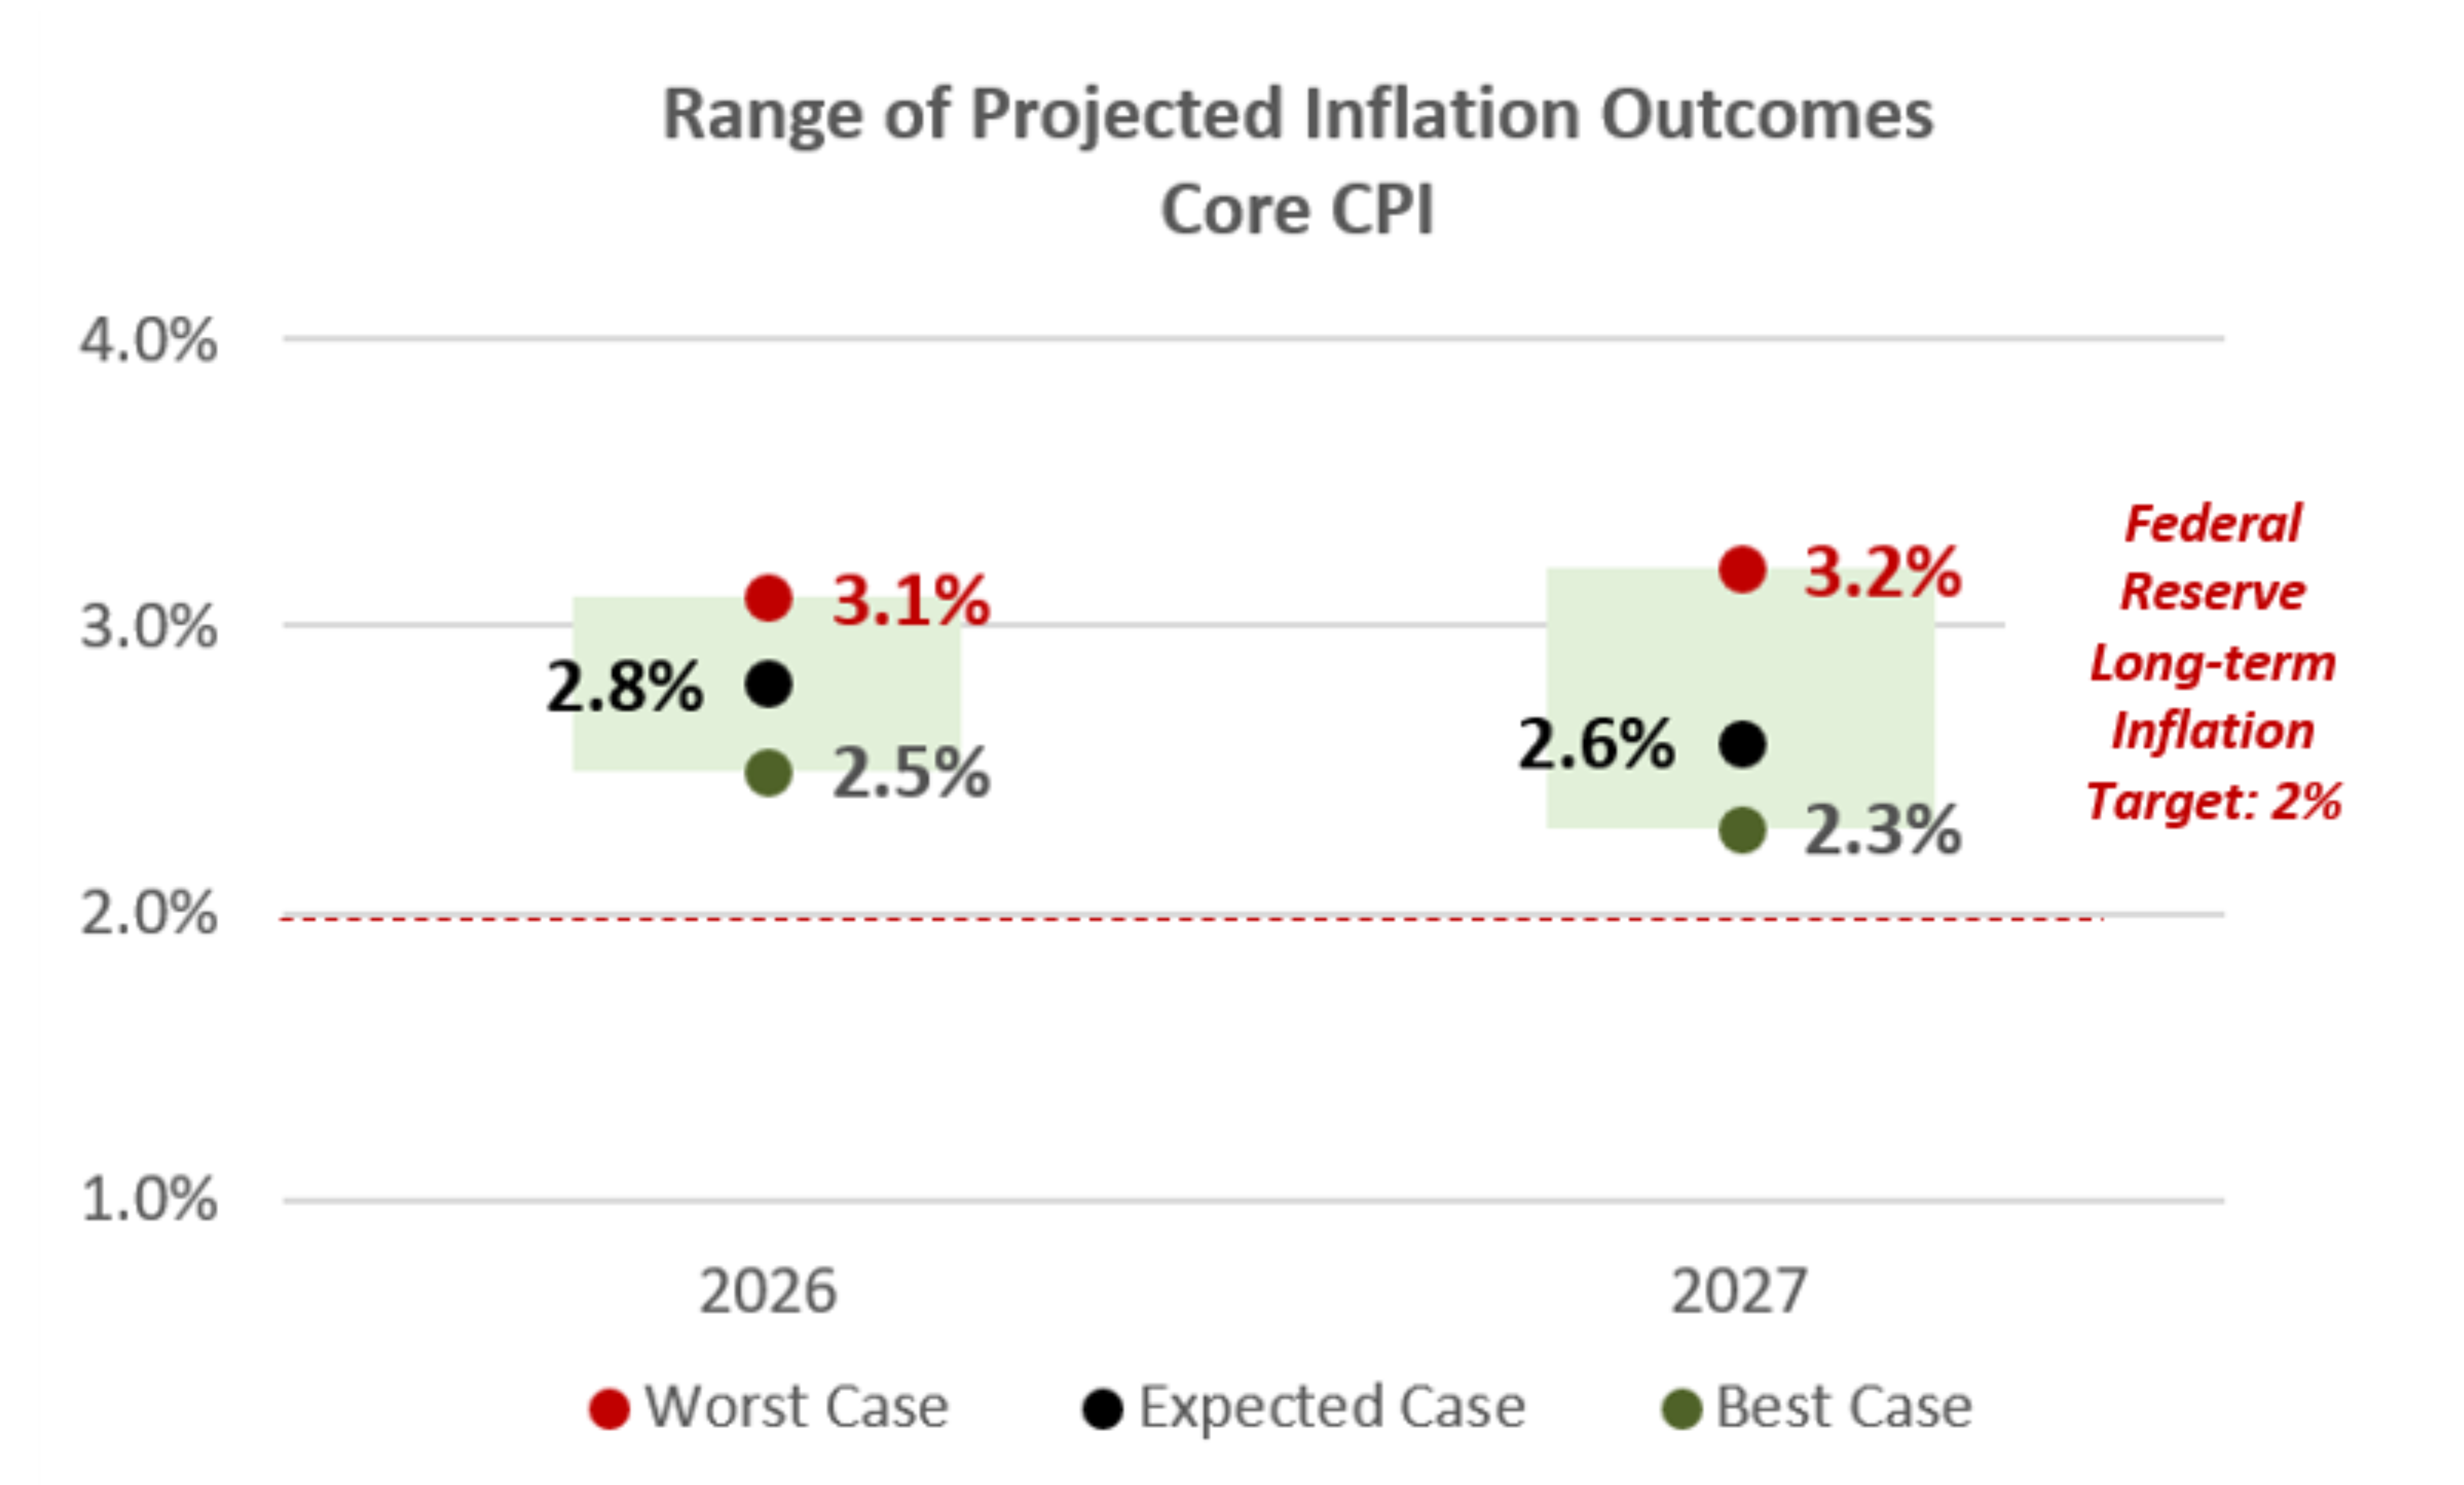
- Inflation moved higher in the first half of 2026 and is still approximately 1% higher than the Fed’s long-term target rate.
- After initially declining at the start of the year, inflation levels ticked higher, as energy supply chains were disrupted and caused ripple effects on downstream industries.
- Inflation levels may have peaked. With tensions easing in the Middle East and supply routes beginning to open, inflation levels are expected to ease going forward.
- Scenarios
- Best Case
- Inflation declines but remains above the Fed’s long-term inflation target of 2% by the end of 2026.
- Expected Case
- Inflation continues to moderate very slowly and is about 80 bps higher than the Fed’s long-term inflation target by the end of 2026.
- Worst Case
- Inflation continues to be sticky throughout the aggregate economy and is approximately 1.0% higher than the Fed’s long-term inflation target through the end of 2026.
- Best Case
2026 in Focus: Geopolitical Implications
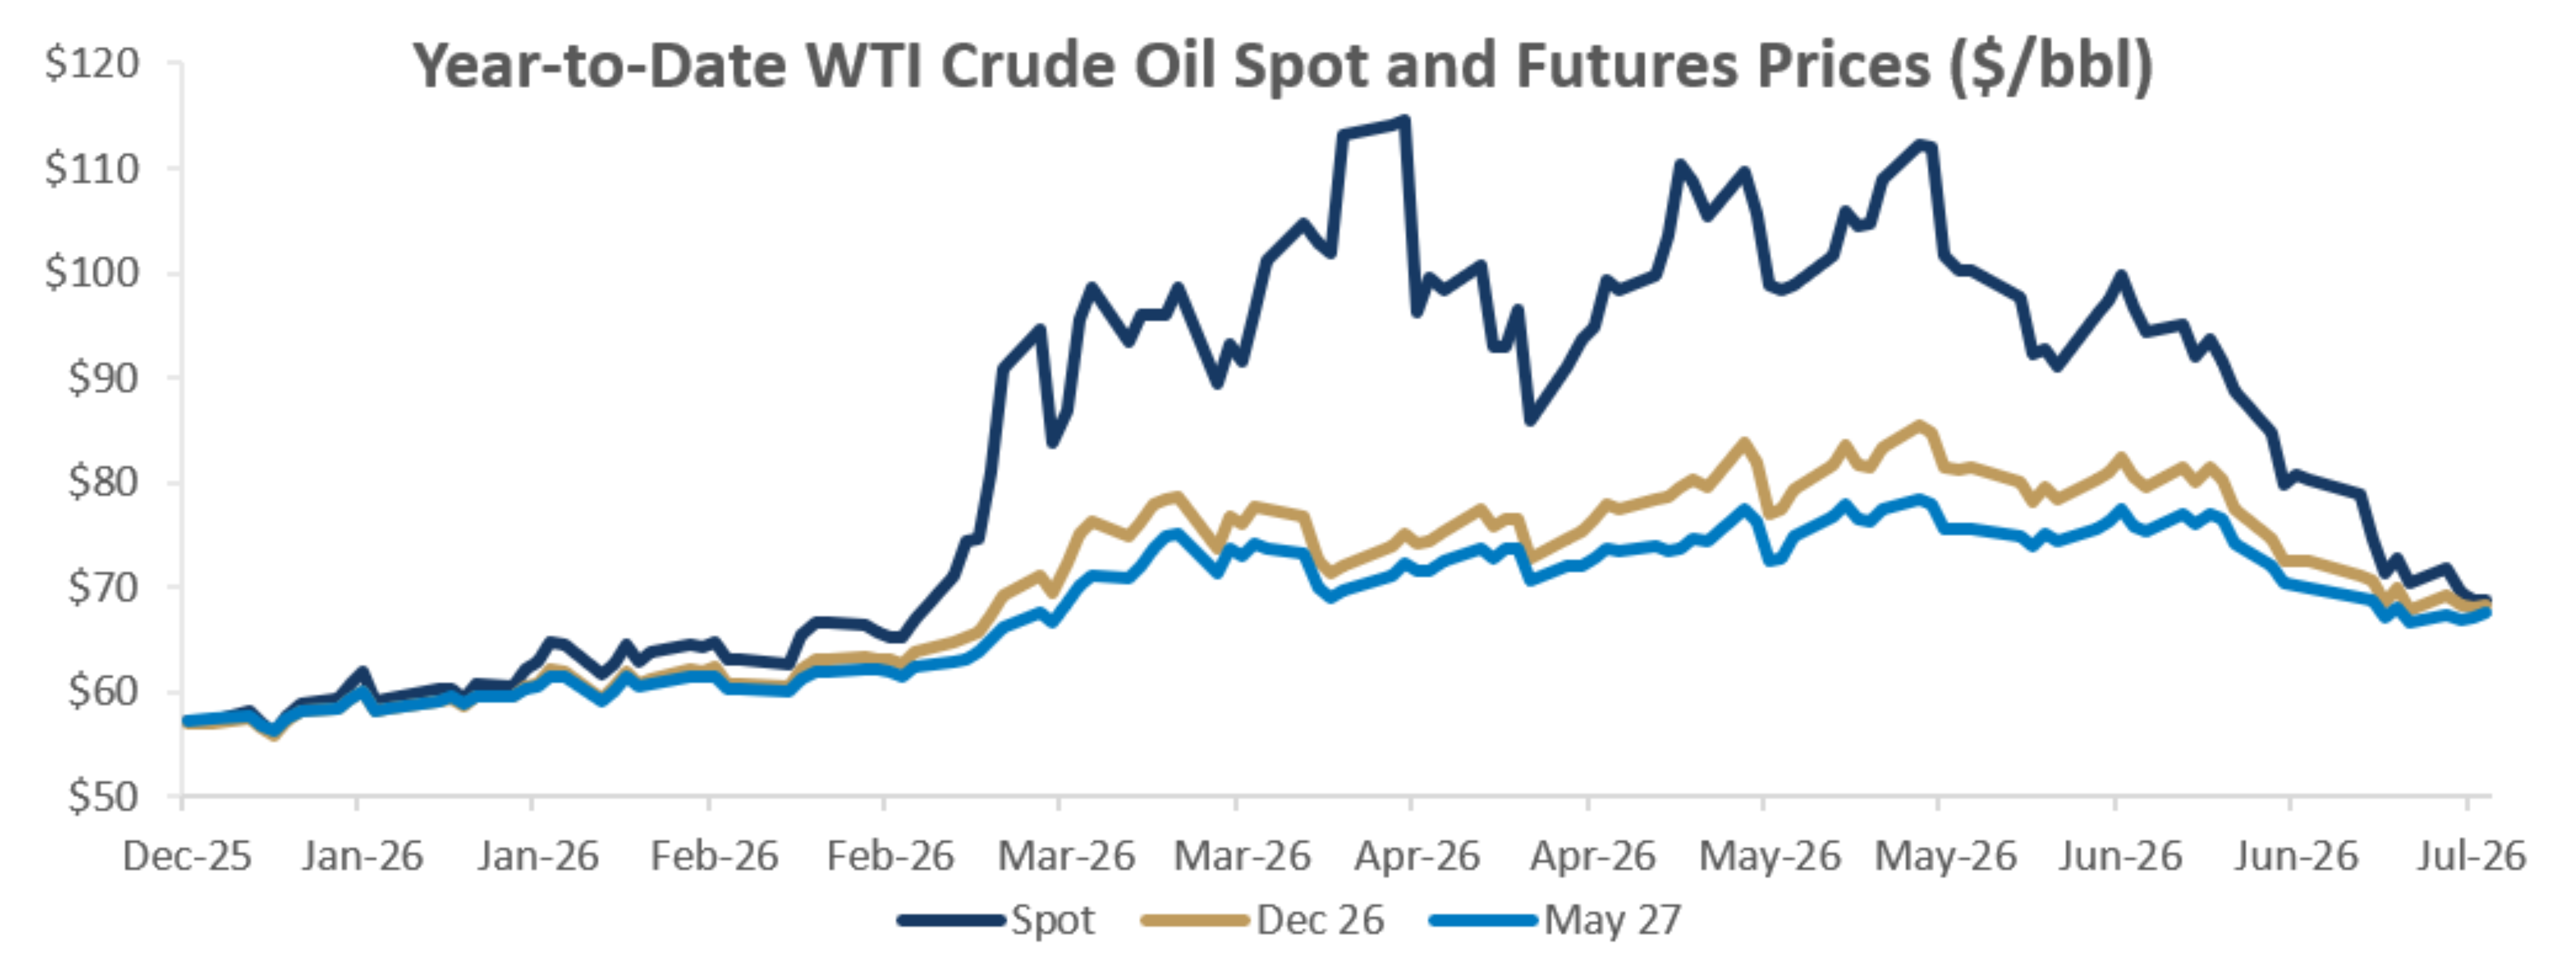
- The conflict in the Middle East has led to increased volatility across global capital markets year-to-date. A tentative deal has been reached, however, providing some relief to markets and investors.
- Energy prices declined towards the end of the quarter and as of June 30, were below the 20-year average price per barrel. As supply chains continue to normalize, energy prices and inflationary pressures stemming from higher energy costs are expected to ease further.
- Futures prices rose during the conflict but never priced in a prolonged supply shock, indicating that the market views the move as a temporary geopolitical risk premium rather than a durable inflationary shock.
- Even with the reprieve from peak prices, oil remains an upside risk to inflation, as spot and futures prices are still materially above beginning-of-year levels, leaving residual pressure on consumers and energy-sensitive parts of the economy.
- The situation overseas remains fragile, and energy prices will remain elevated until supply channels return to pre-conflict levels. Security prices may fluctuate with developing headlines on any progress in talks between the United States and Iran.
- Takeaway
- Volatility is at times fueled by uncertainty and fear. It is important to remain focused and not let near-term headlines and market swings affect your long-term outlook.
2026 in Focus: AI-Bubble Fears
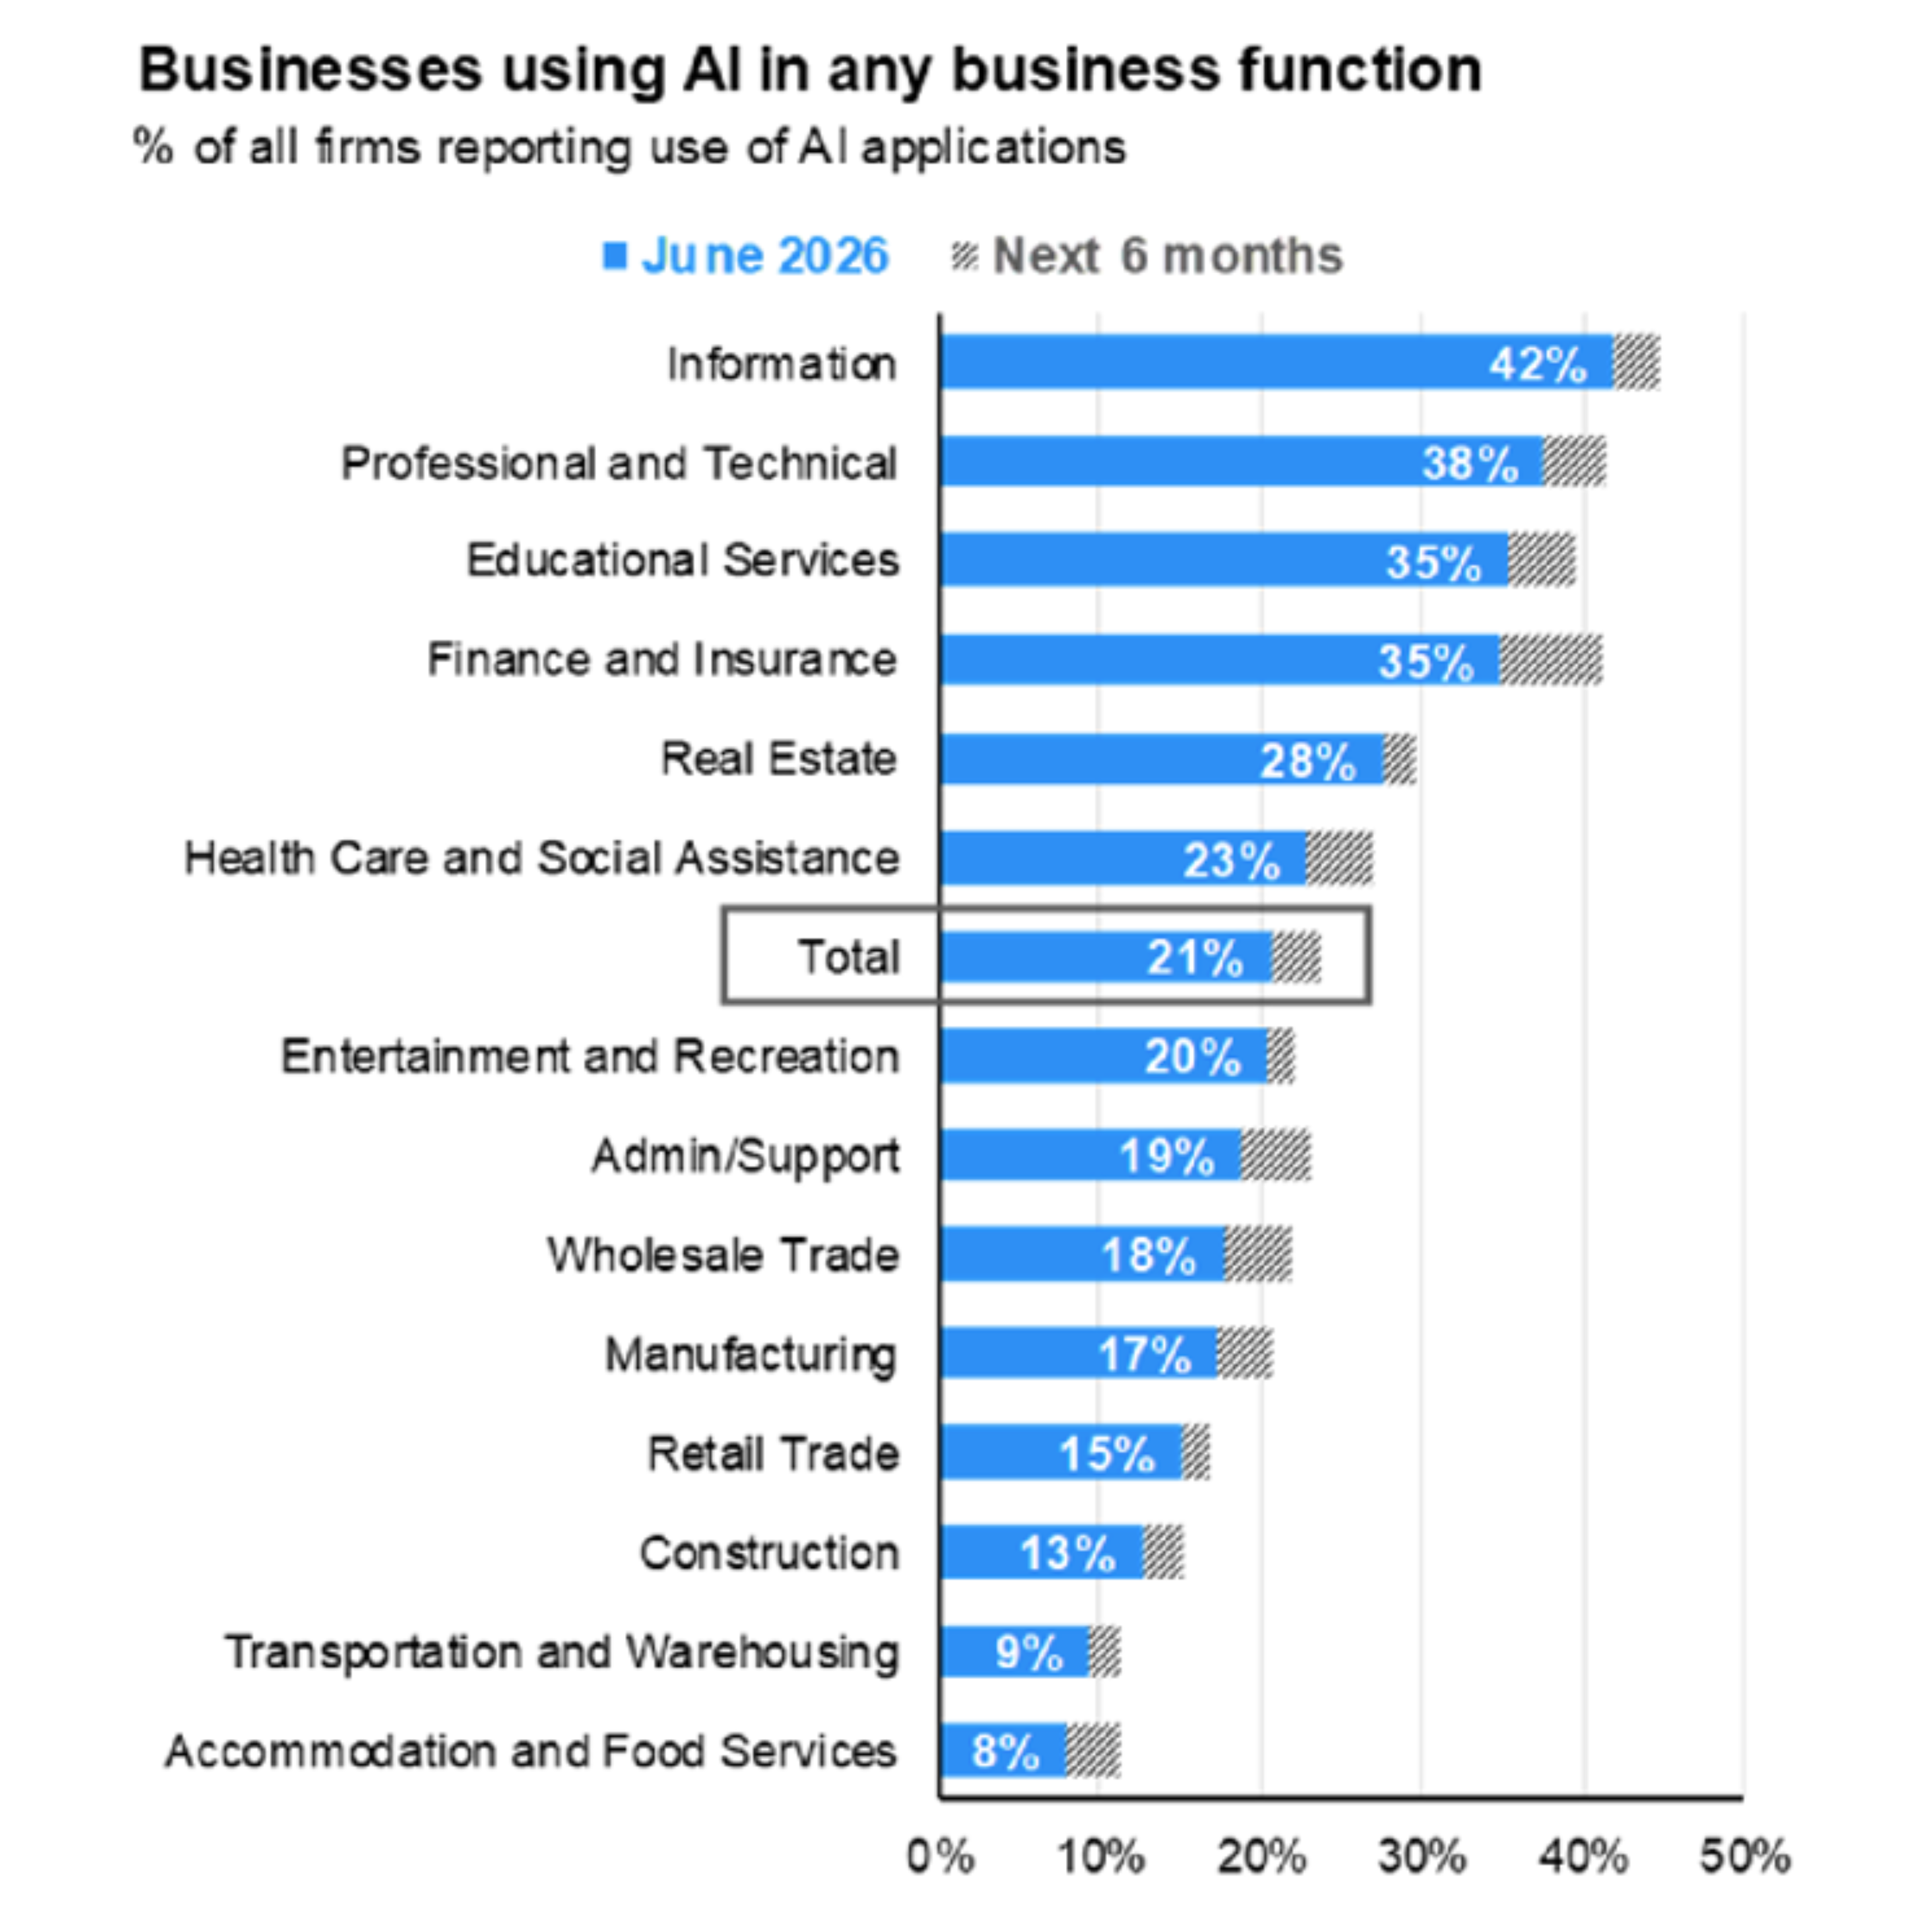
- A disproportionate share of equity market gains, especially in the United States, have been driven by companies most directly exposed to AI over the past couple of years.
- AI-related stocks are likely to remain a key driver of market performance, with periods of increased volatility along the way.
- Unlike past bubbles centered around tech, AI leaders have shown persistent revenue and earnings growth that are expected to continue as the AI cycle progresses.
- AI adoption rates across industries appear poised to accelerate in the quarters (and years) ahead.
- Takeaways
- AI is expected to be a transformational technology for the United States and global economy and is here to stay.
- Lofty valuations for AI stocks could lead to more downside risk than other parts of the stock market. However, any meaningful drawdown in AI stocks could present attractive investment opportunities for long-term investors.
2026 in Focus: Hyperscalers Driving Investment
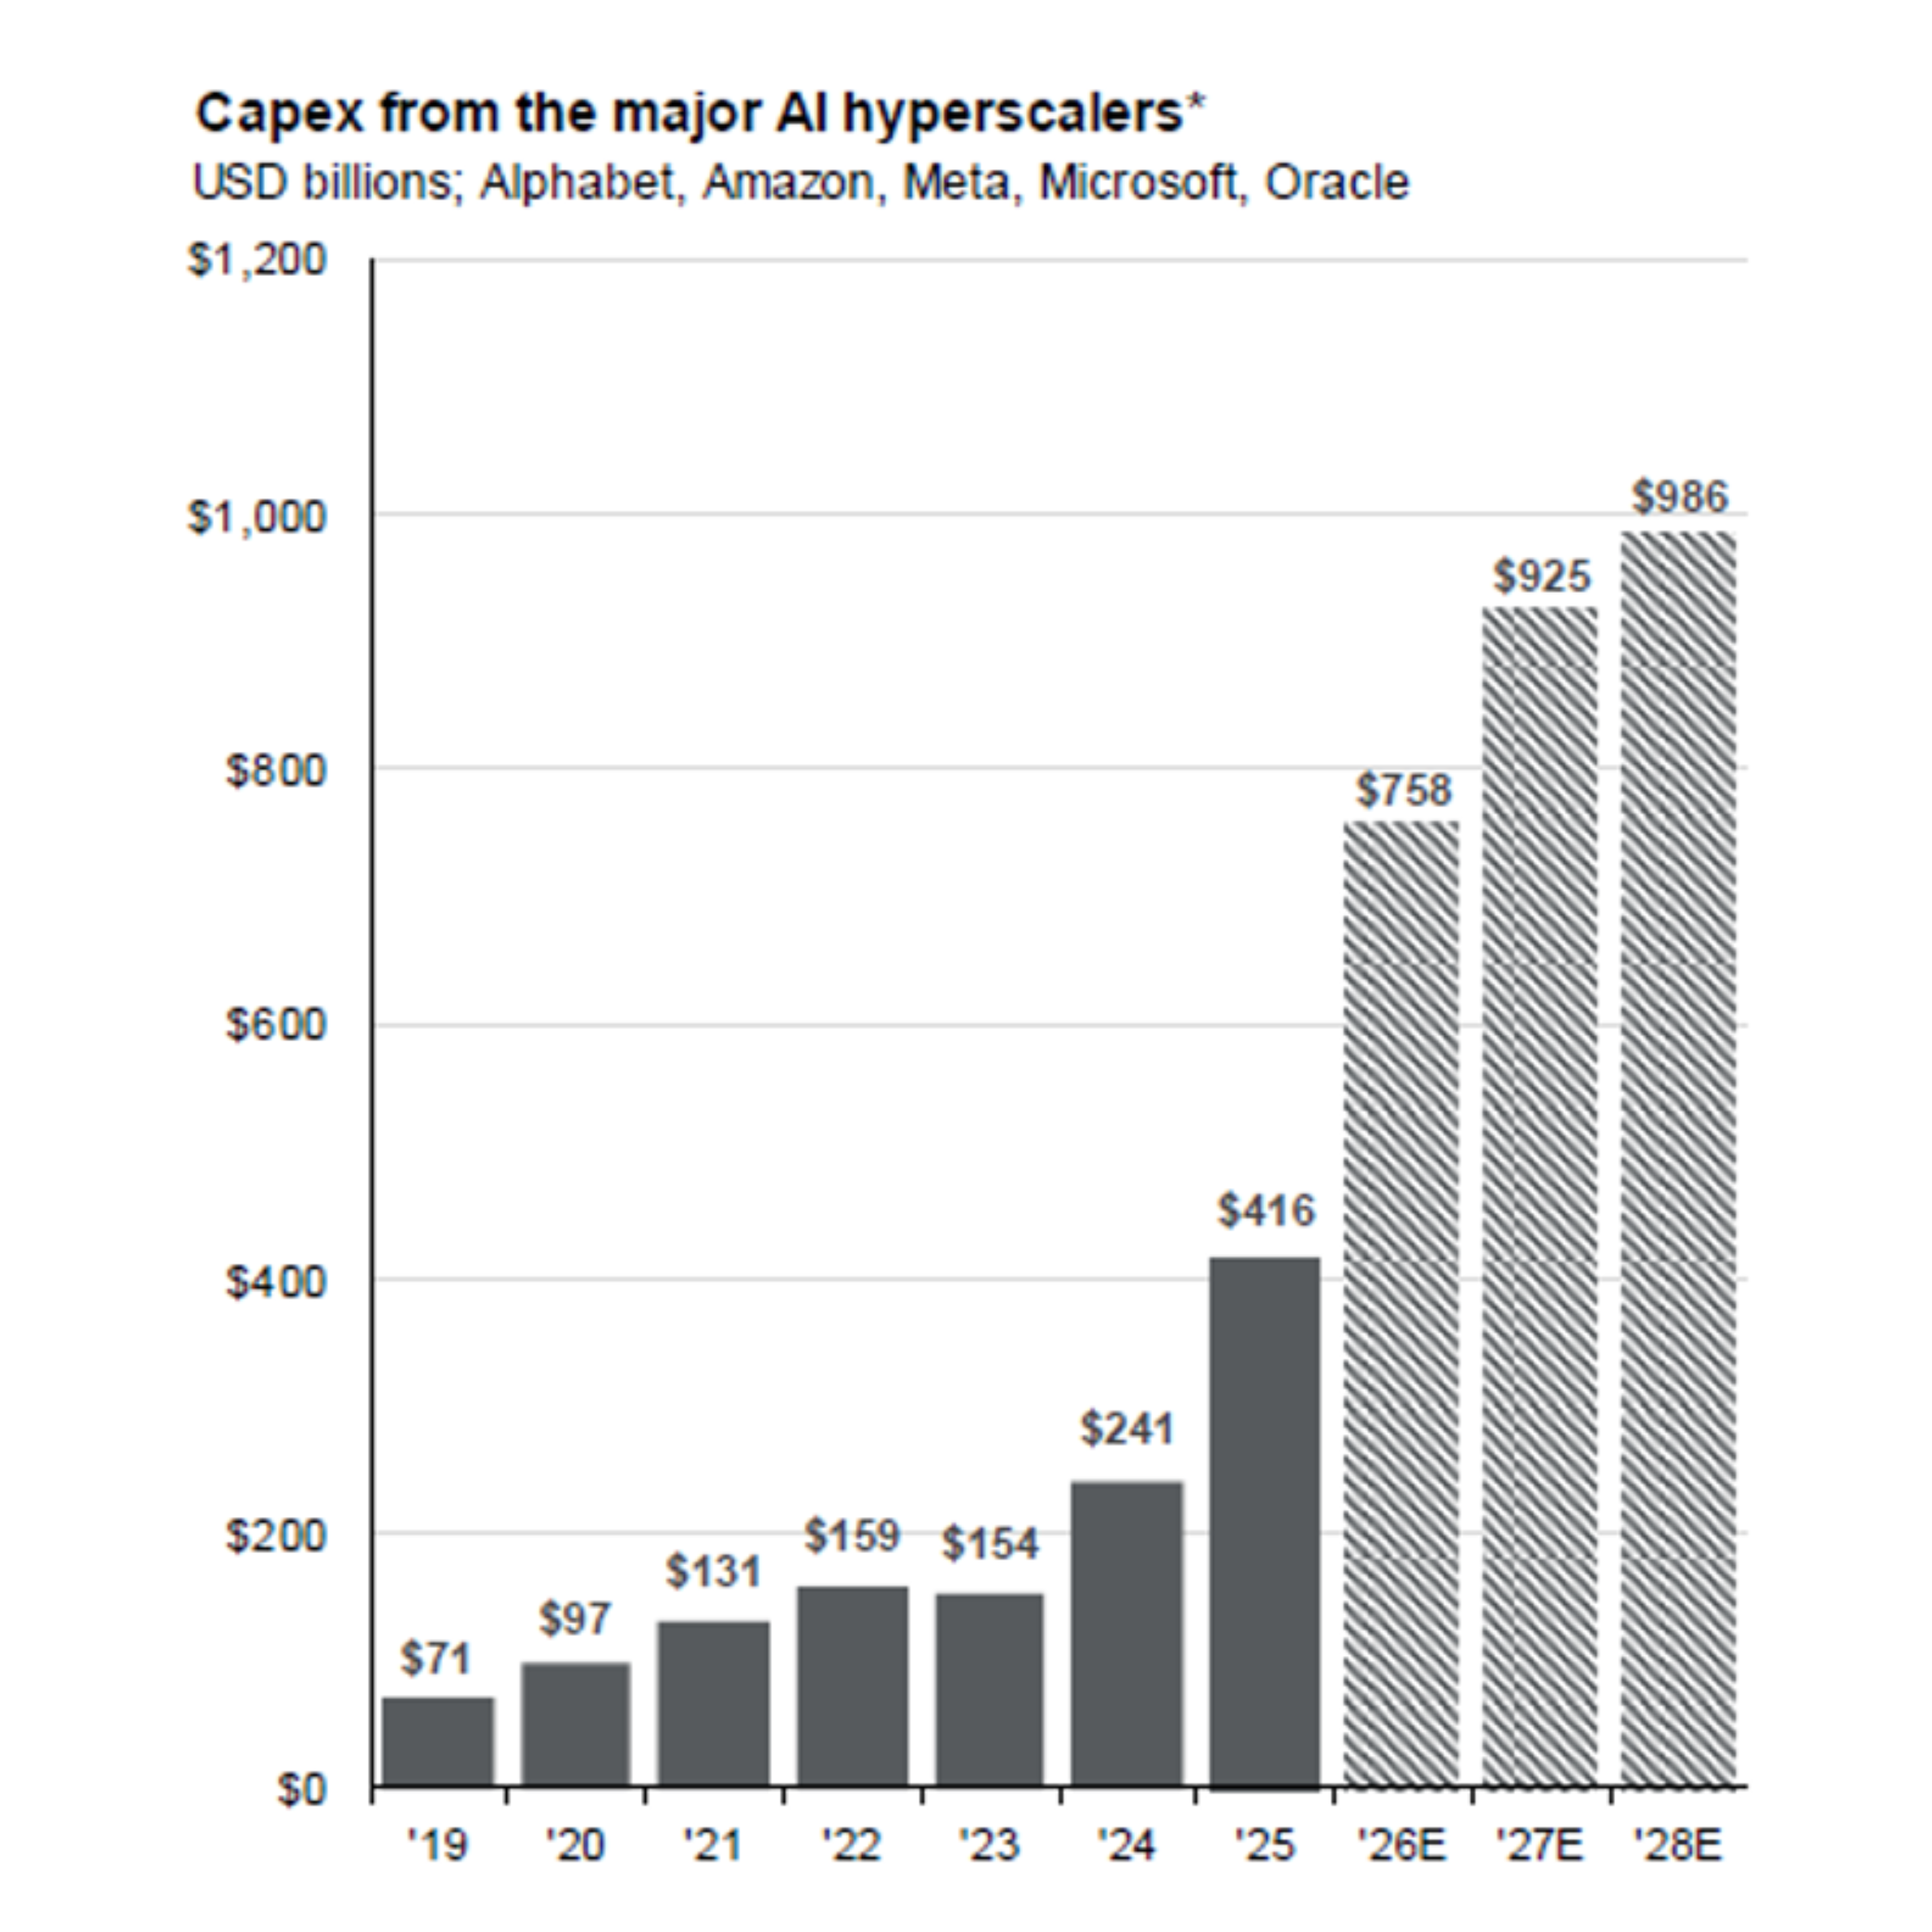
- Investment in AI has been accelerating, as major firms continue to commit hundreds of billions of dollars toward the infrastructure and computing capacity needed.
- The market has been cautious to reward several of the largest spenders, as it is waiting for more proof of returns on their investment.
- Unlike other historic infrastructure booms, these significant increases to capital expenditures have largely been financed by rising operating cash flows, as dominant businesses are reinvesting their profits into future aspirations.
- Takeaways
- With growing demand for AI, strong incentives and the ability to spend on the infrastructure, this trend does not look to be slowing down anytime soon.
- Demonstrated results or successful monetization of AI investment could help improve investor confidence.
2026 in Focus: Earnings Expectations
Source: FactSet data as of 6/30/2026.
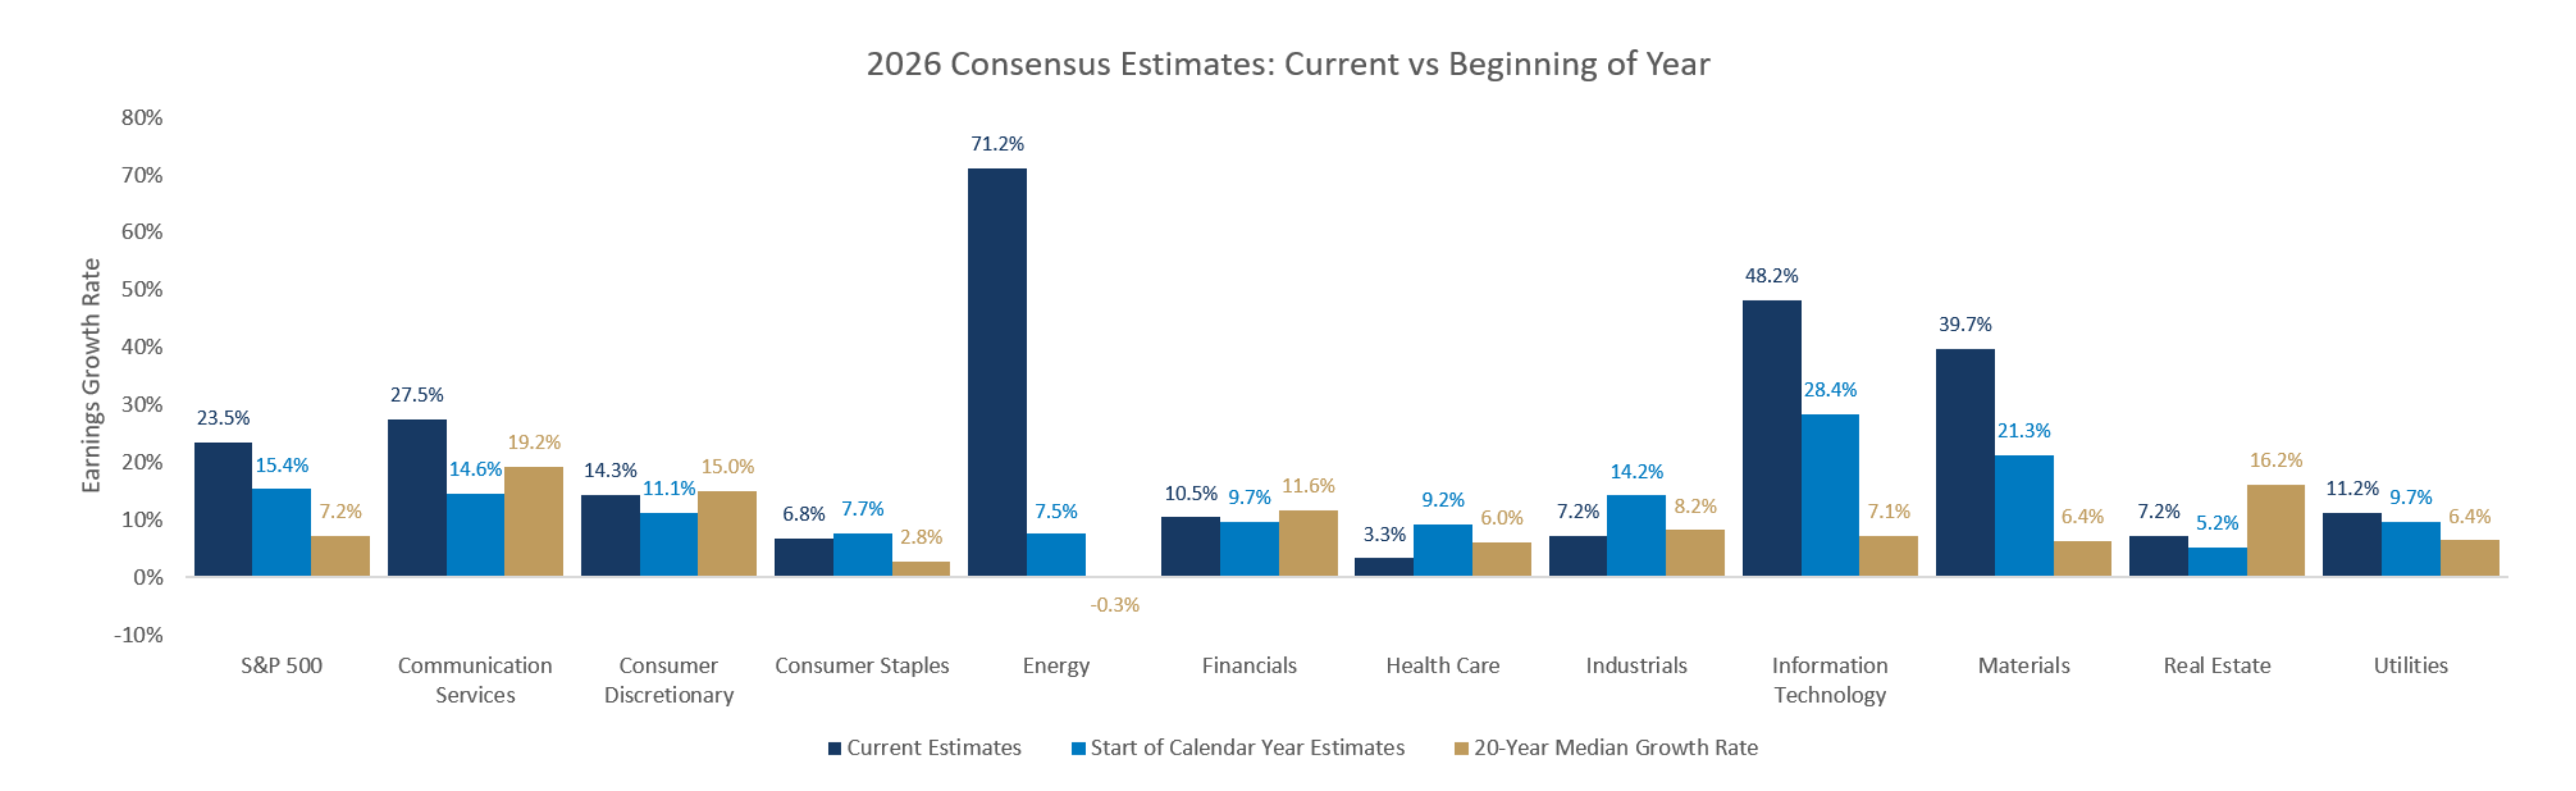
- Earnings estimates for the S&P 500 have continued to rise despite geopolitical conflict and uncertainty.
- 2026 year-end earnings estimates have increased since the beginning of the year in the consumer discretionary, energy, financials, information technology, materials, real estate and utilities sectors.
- Takeaway
- The information technology sector is expected to continue to report above-trend earnings growth in 2026. However, a broadening of earnings growth is expected beyond the mega-cap tech sector across multiple areas of the market. Investors may benefit form diversification across sectors.
Earnings as a Key Market Driver
Source: FactSet data as of 6/30/2026.
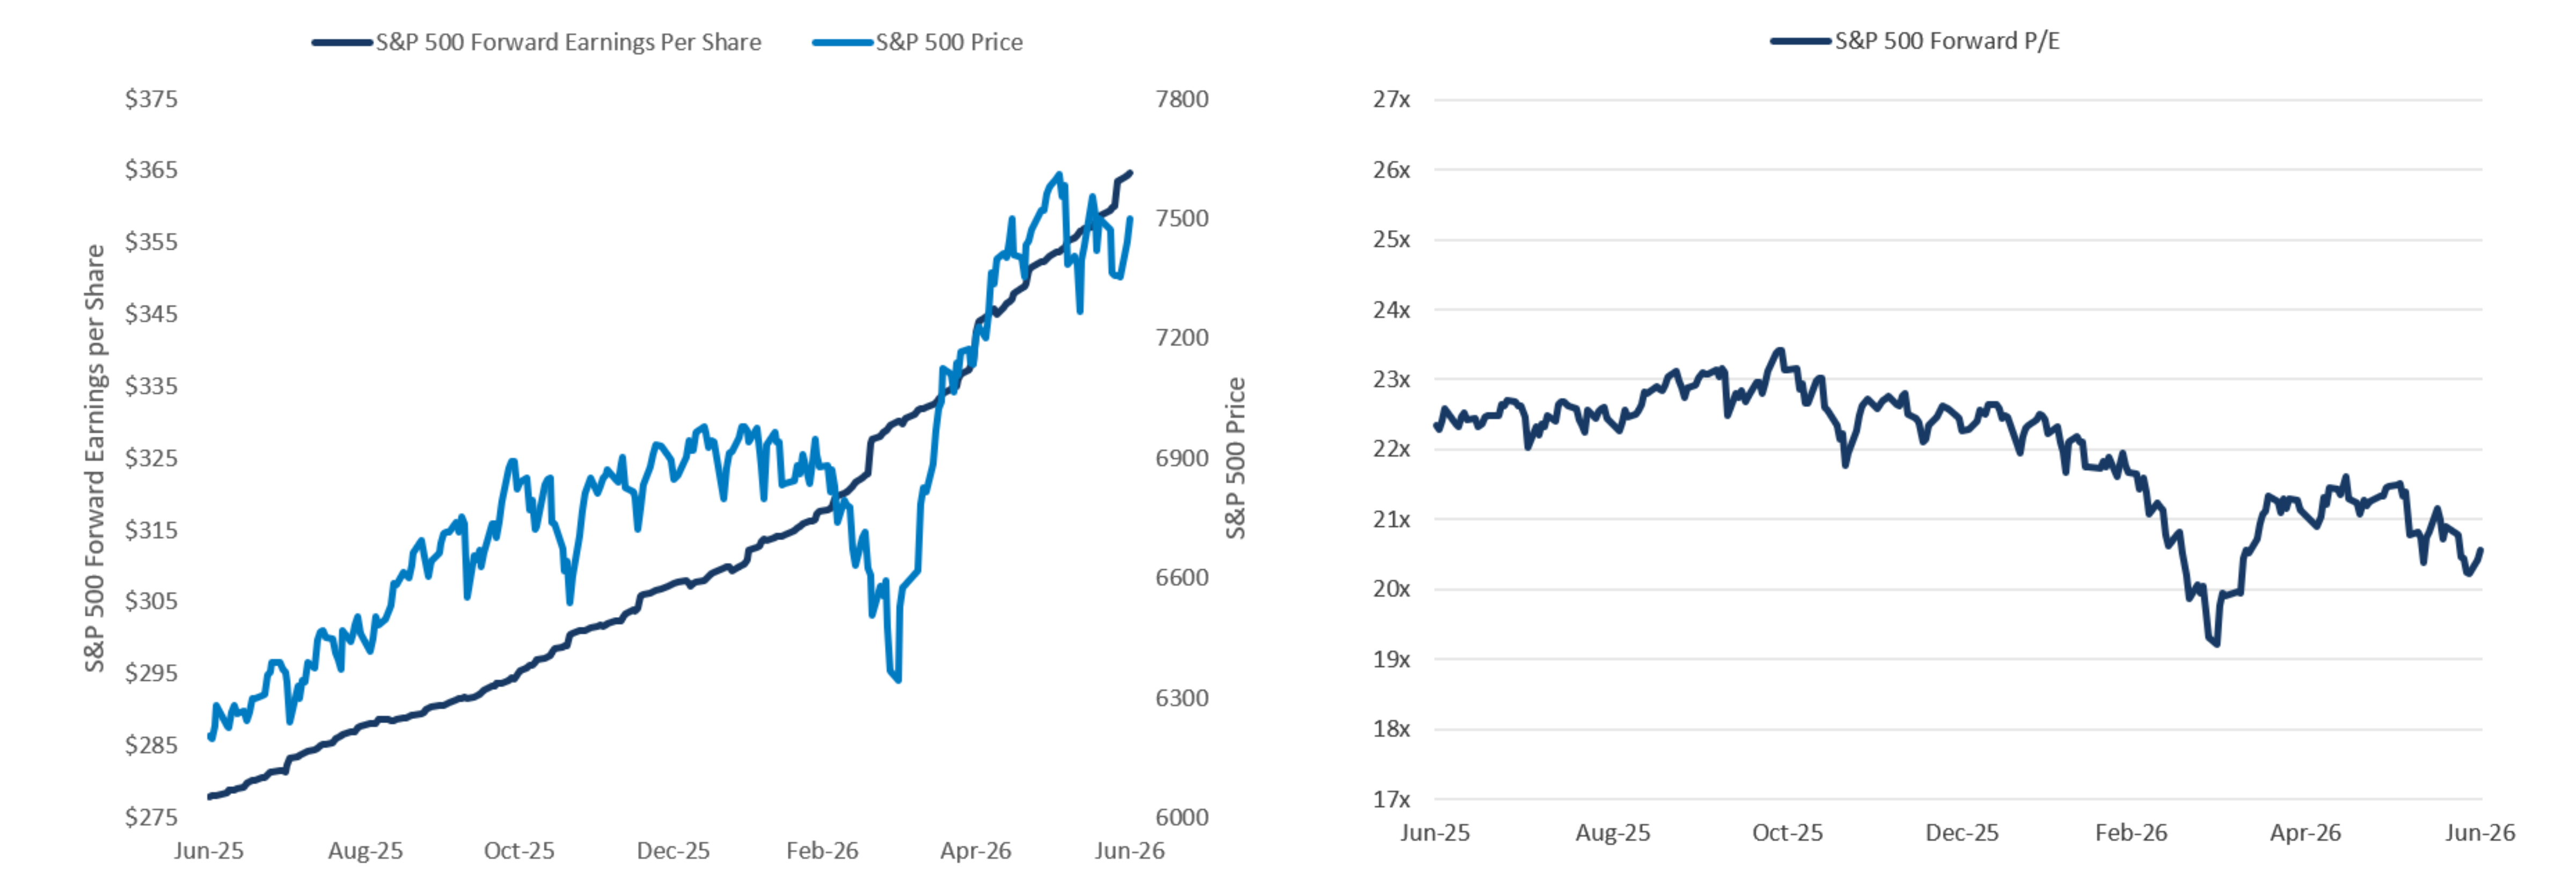
- Earnings have provided key support for market recovery after March lows.
- Forward earnings estimates have continued to move higher, helping offset valuation concerns and supporting the rebound in equity prices.
- Takeaway
- The equity market rally has been more earnings-driven than multiple-driven, but the market is increasingly dependent on those expectations being met.
Expectations Historically Elevated & Still Climbing
Source: FactSet data as of 6/30/2026.
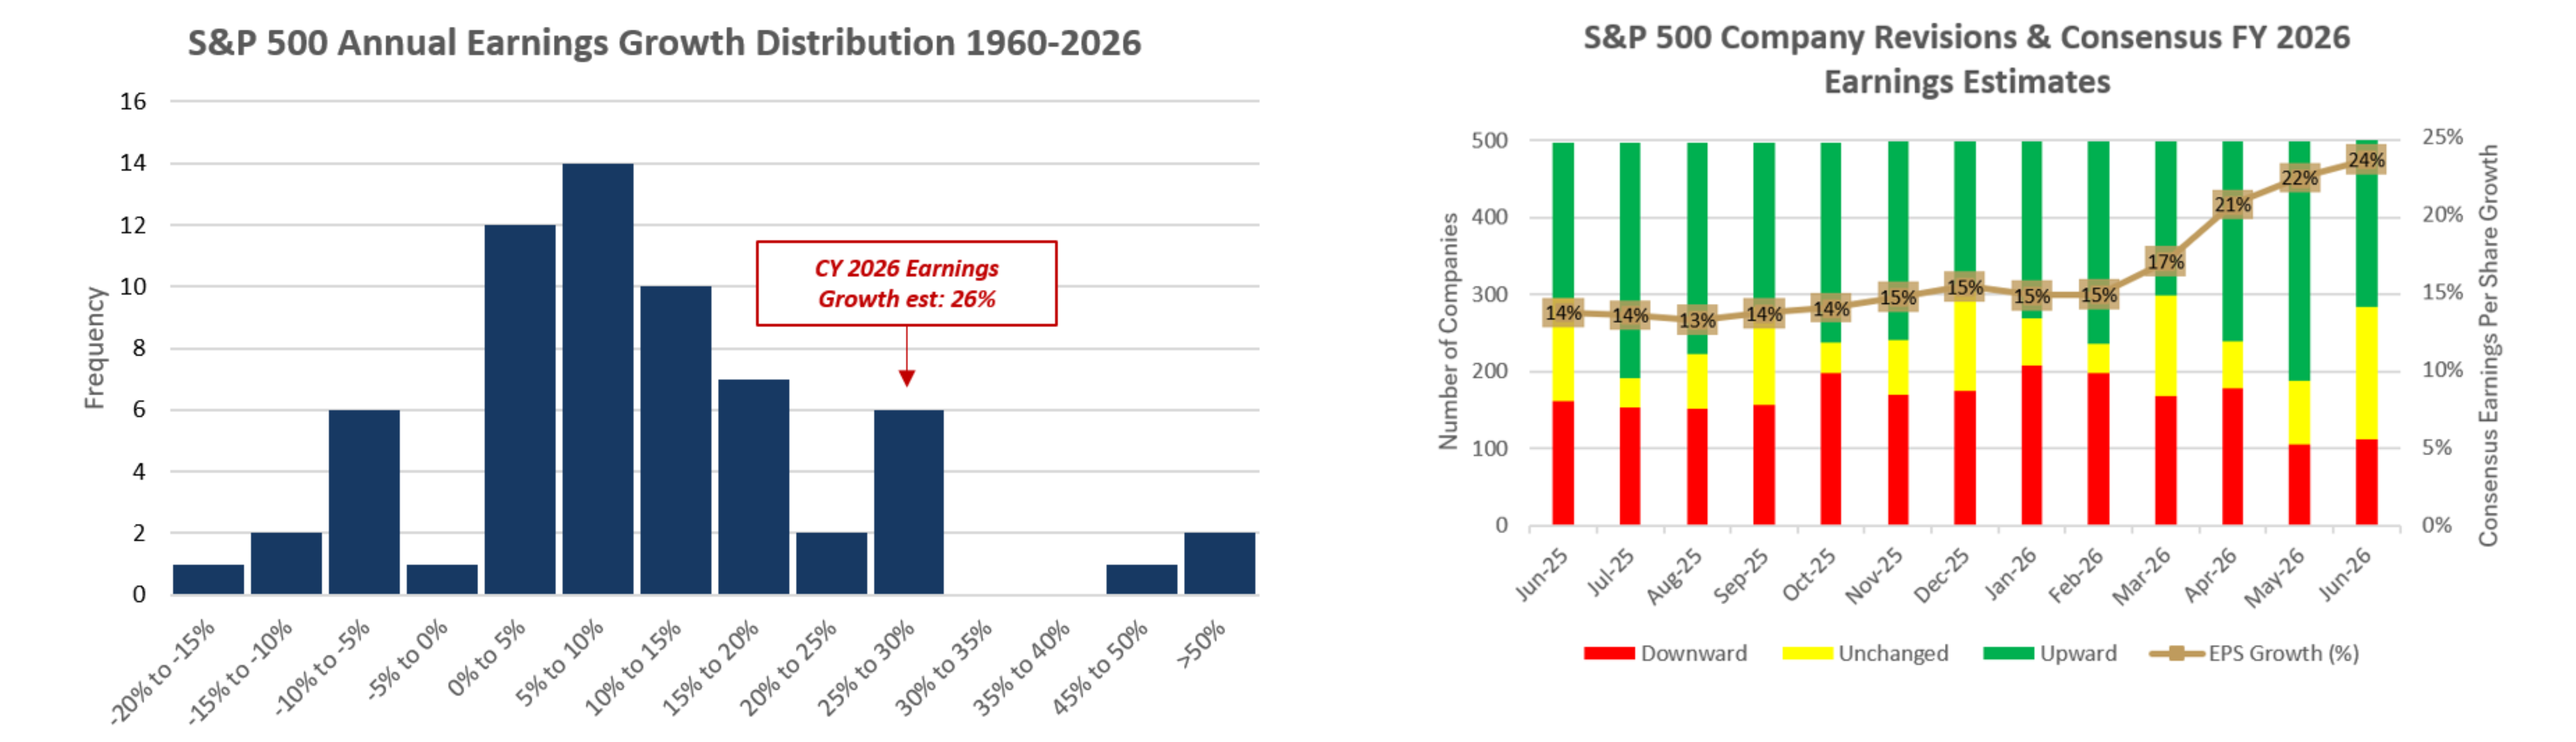
- Current earnings expectations are high relative to history.
- Since 1960, annual S&P 500 earnings growth has averaged roughly 8%, while current calendar year expectations are near 26%.
- Earnings growth above 20-25% has been uncommon outside unusual periods, such as recessions, tax-related distortions or sharp cyclical rebounds.
- Analyst revisions have become more constructive, but that also raises the bar for performance. The risk of earnings sustaining these growth levels is elevated.
- Takeaway
- Due to elevated expectations, markets may become more sensitive to signs that earnings growth is slowing or revisions are beginning to fade.
Earnings Have Been Broadly Positive — So Has Performance
Source: FactSet data as of 6/30/2026.
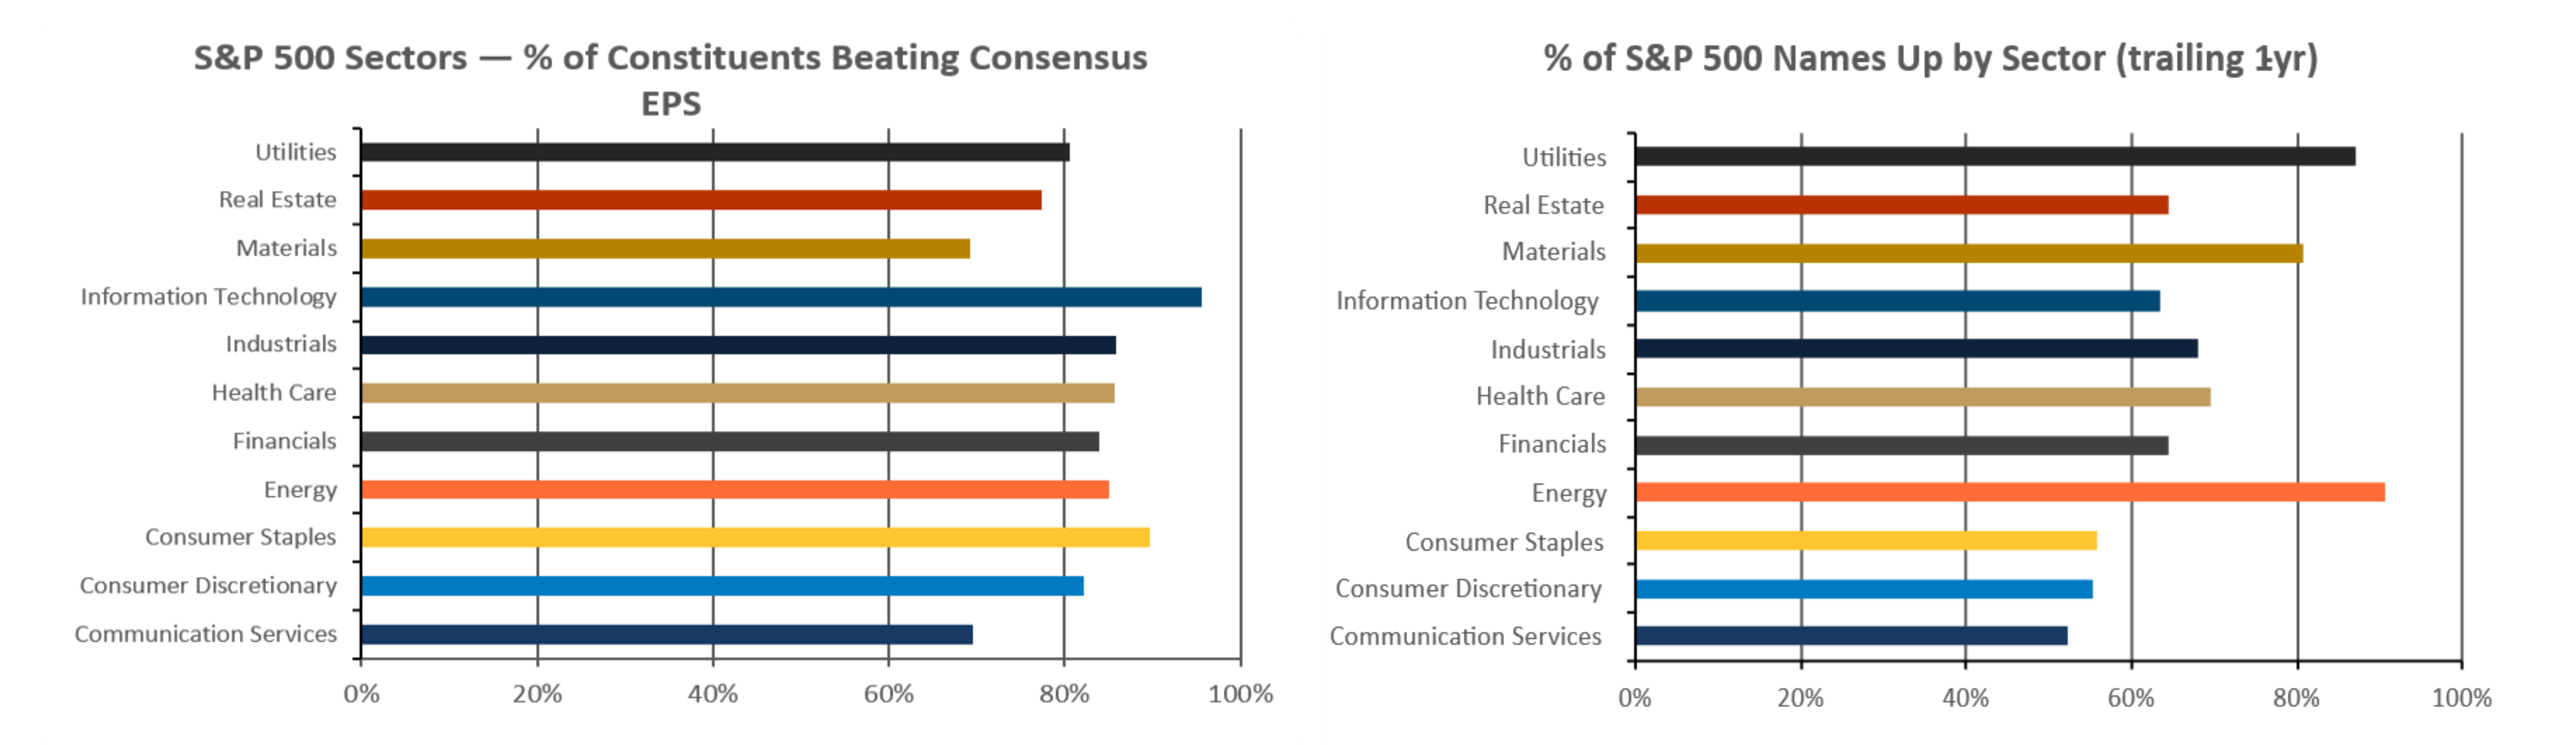
- Earnings strength has been broad across sectors.
- Most S&P 500 sectors saw most constituents beat consensus earnings per share estimates, suggesting the earnings backdrop has been supported beyond just the largest index companies.
- Performance breadth has also improved.
- Every sector has numerous companies exhibiting positive price performance over the trailing year, indicating that market gains have broadened across sectors rather than being driven by only a narrow group of stocks.
- Takeaway
- Broad earnings beats and market participation have created market resilience in the face of macroeconomic headwinds. Going forward, the key test is whether this breadth can continue as earnings expectations remain elevated.
Relative Valuations: U.S. Large Cap Comparison
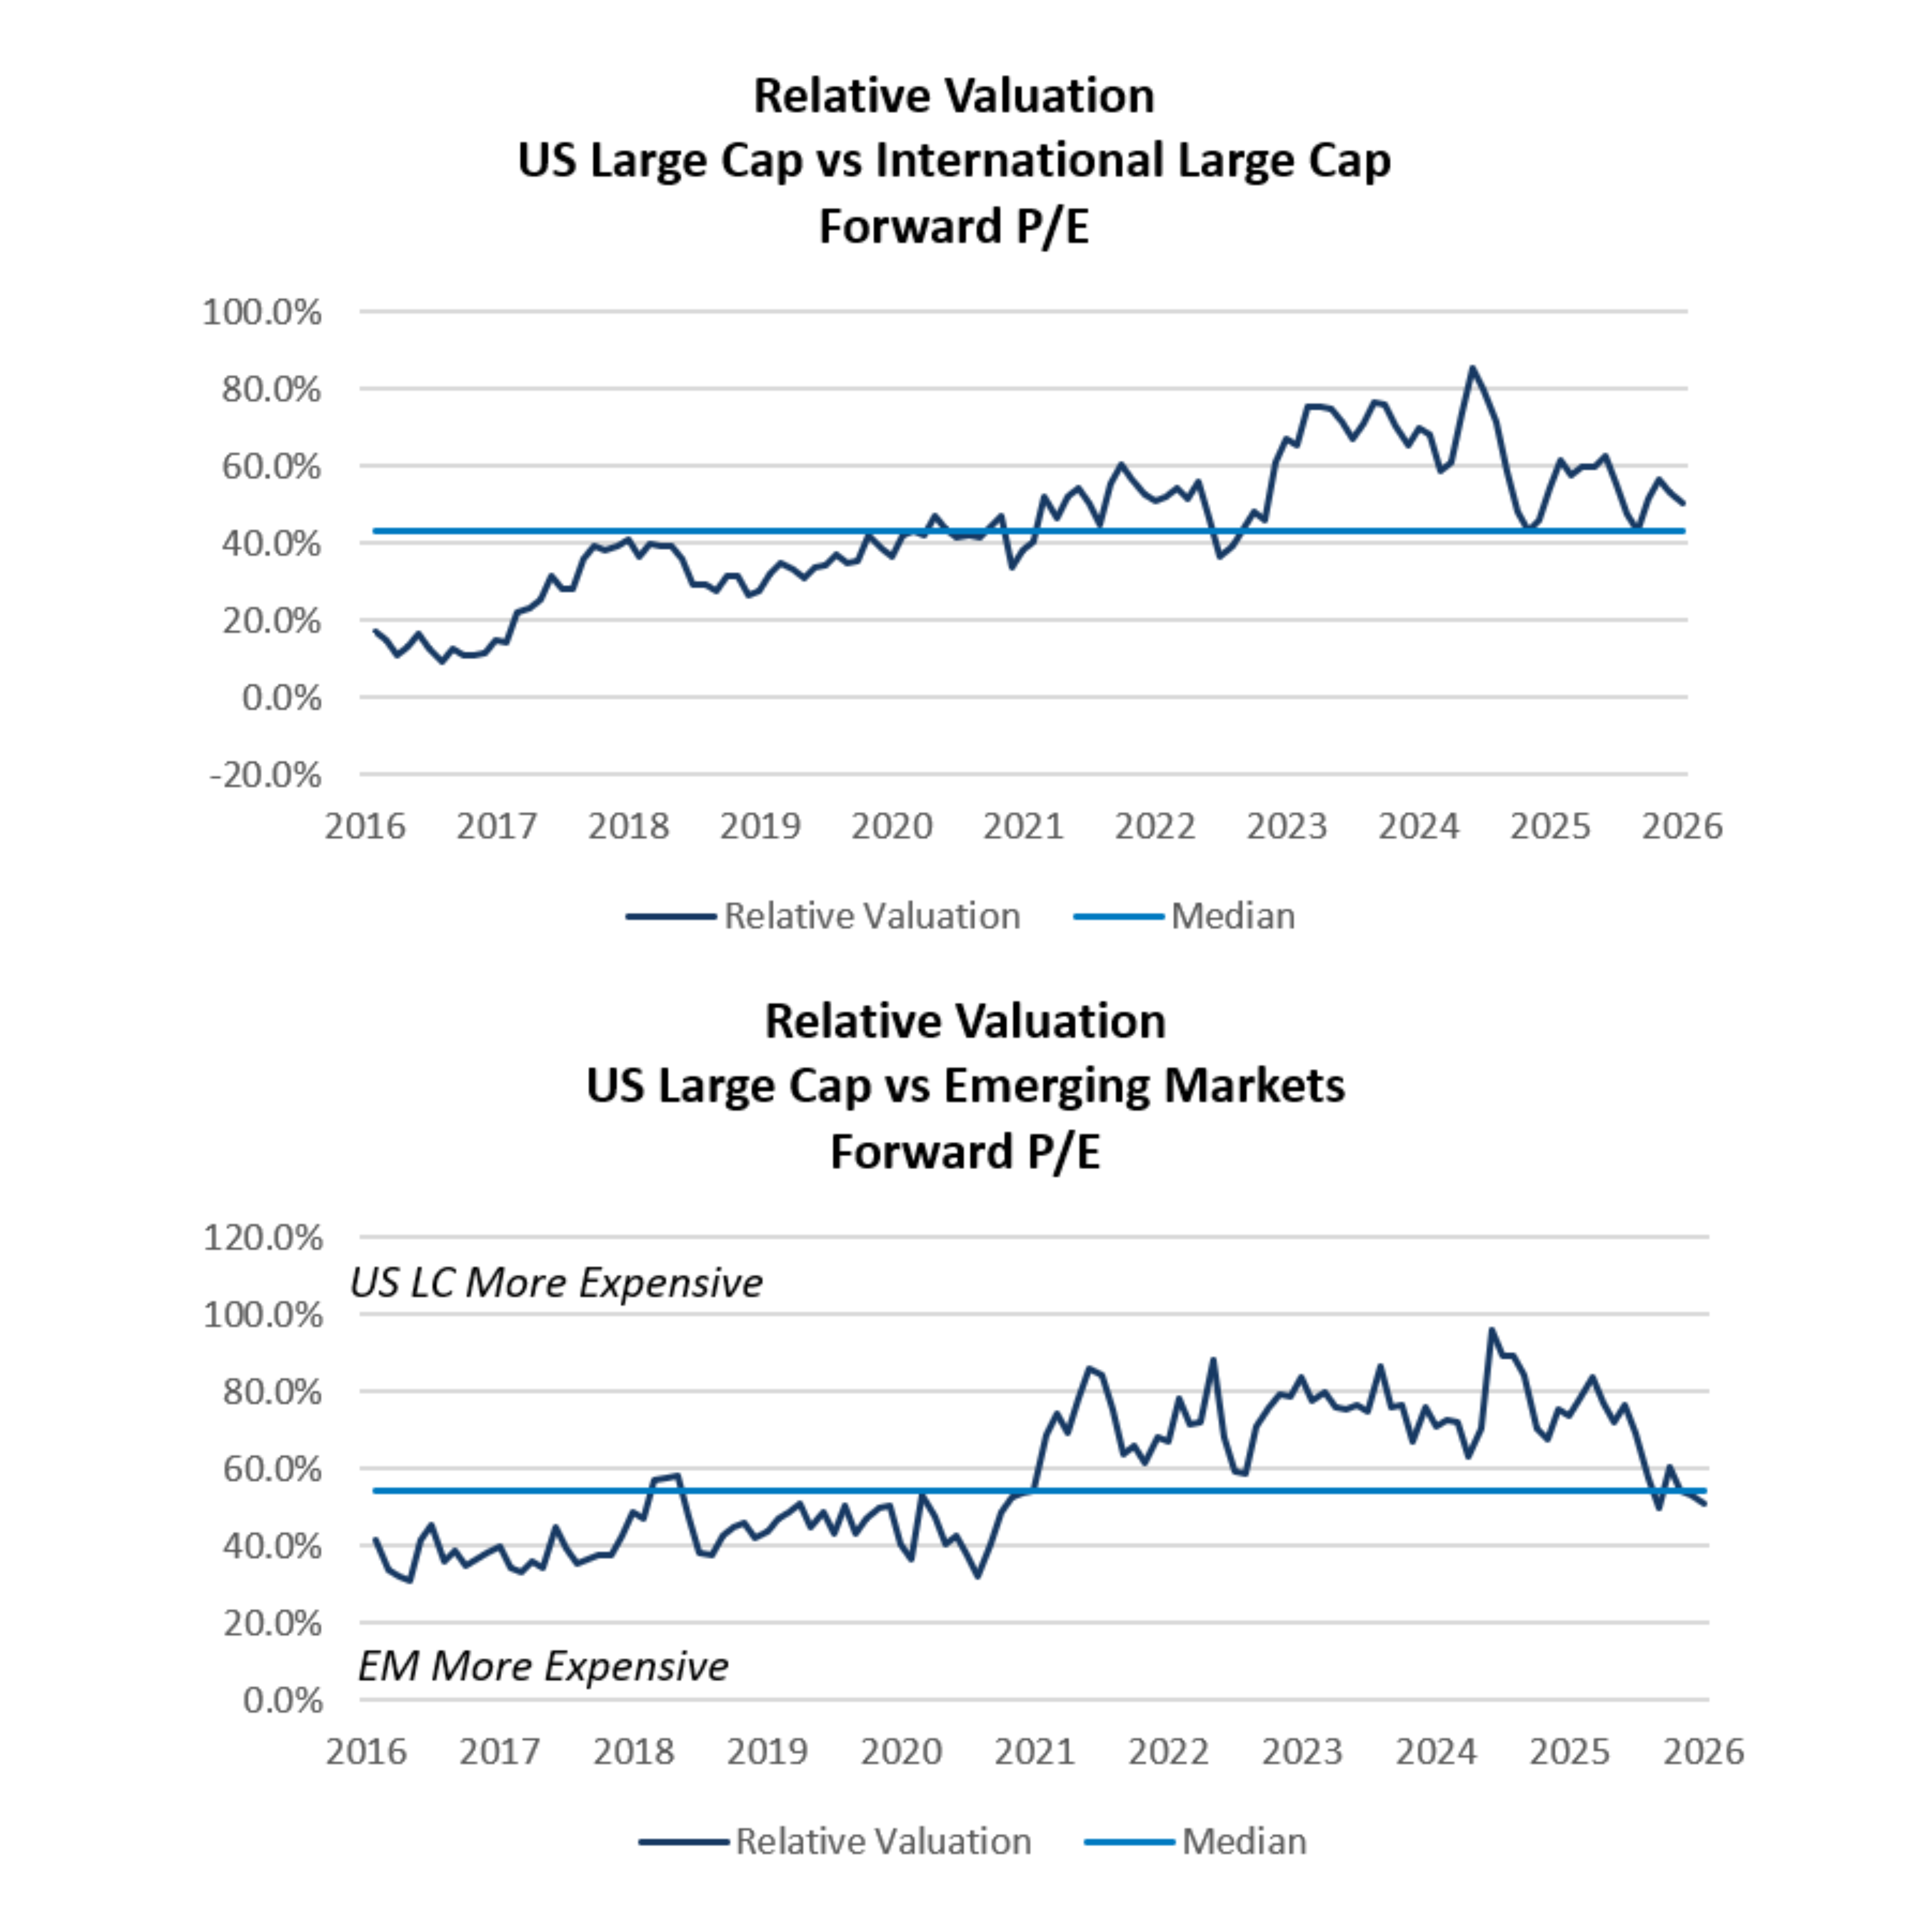
- Despite recent outperformance by equities outside the United States, fundamental valuation metrics suggest that U.S. equities are still “expensive” relative to international equities.
- Emerging market equities have experienced significant outperformance over the last year and are beginning to appear “more expensive” than U.S. large cap stocks on a fundamental basis.
- Takeaway
- Diversification outside the U.S. is prudent, and we recommend investors continue to have an allocation to international equity and EM equity.
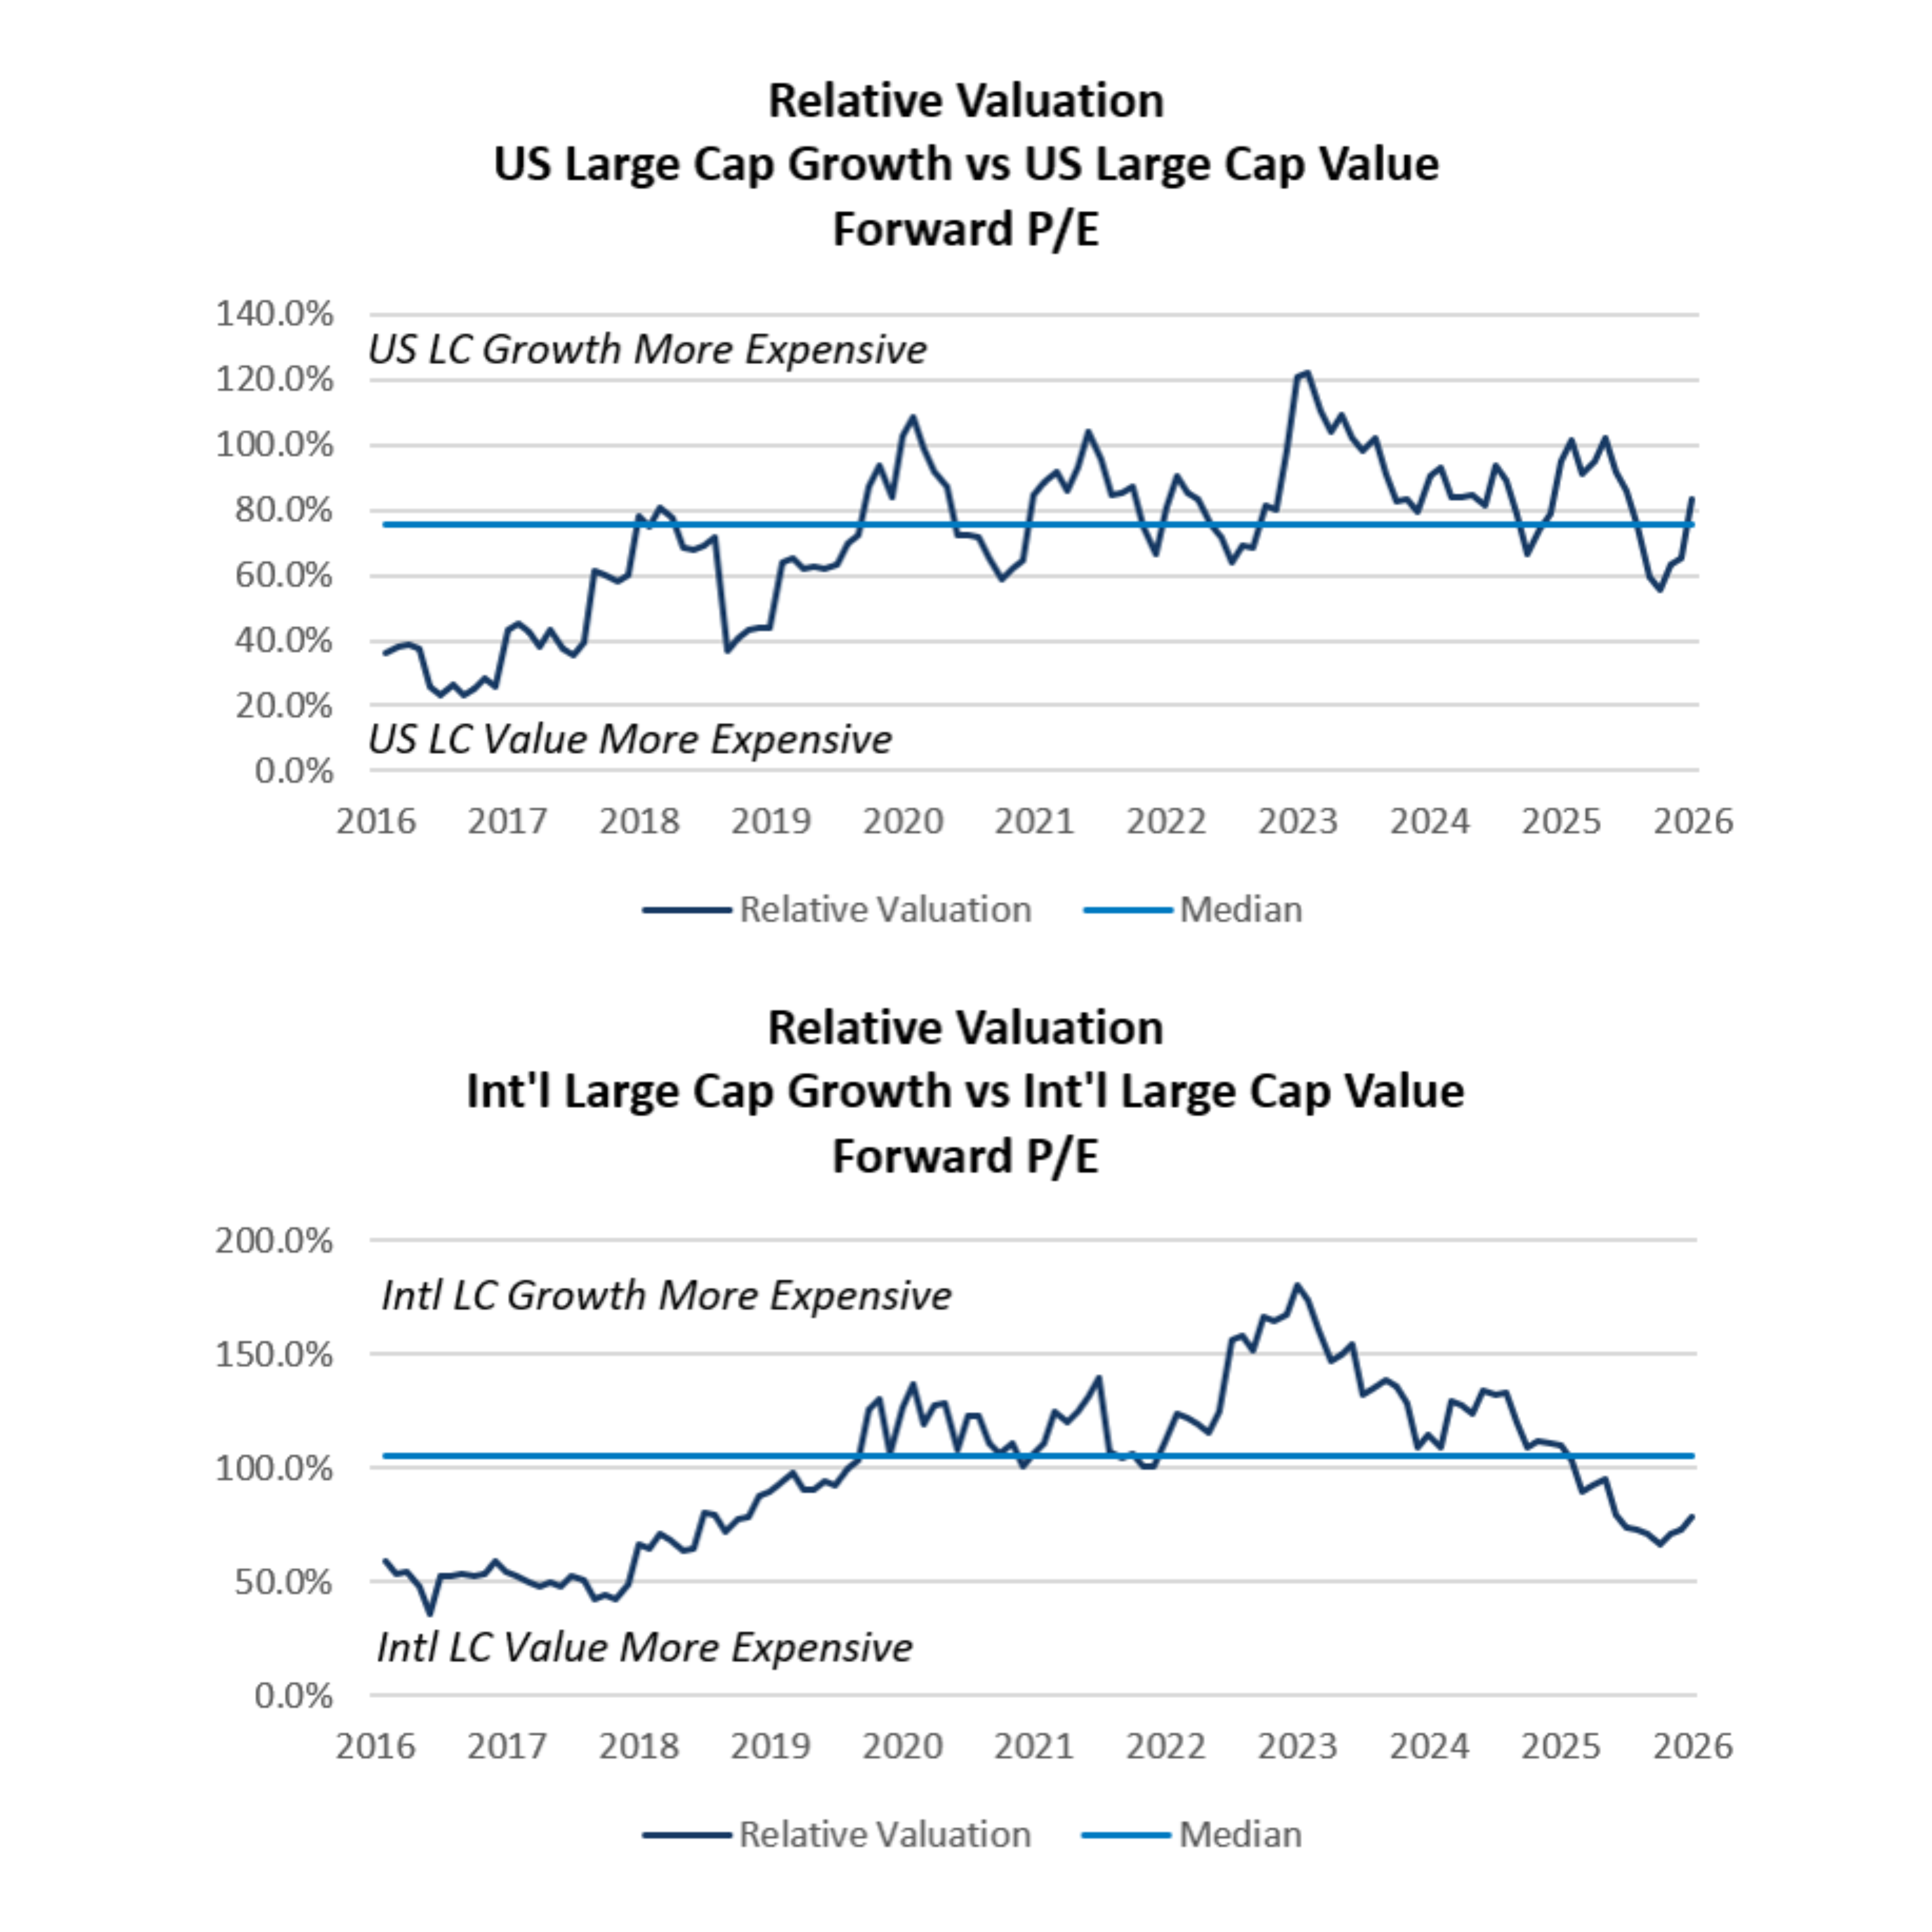
Relative Valuations: Growth vs. Value Comparison
- After U.S. growth stocks experienced meaningful declines in the first quarter, performance reversed swiftly in the second quarter and relative valuations are now near the 10-year average levels.
- On a fundamental valuation basis, international value stocks are currently “more expensive” than international growth stocks.
- International value stock valuations have increased recently, as investors homed in on low multiples, higher earnings expectations and thematic rotations out of growth equities.
- Takeaway
- A slight overweight to U.S. value relative to U.S. growth is recommended given current fundamental valuations and the potential for trade-related volatility to continue.
Fixed Income: Treasuries
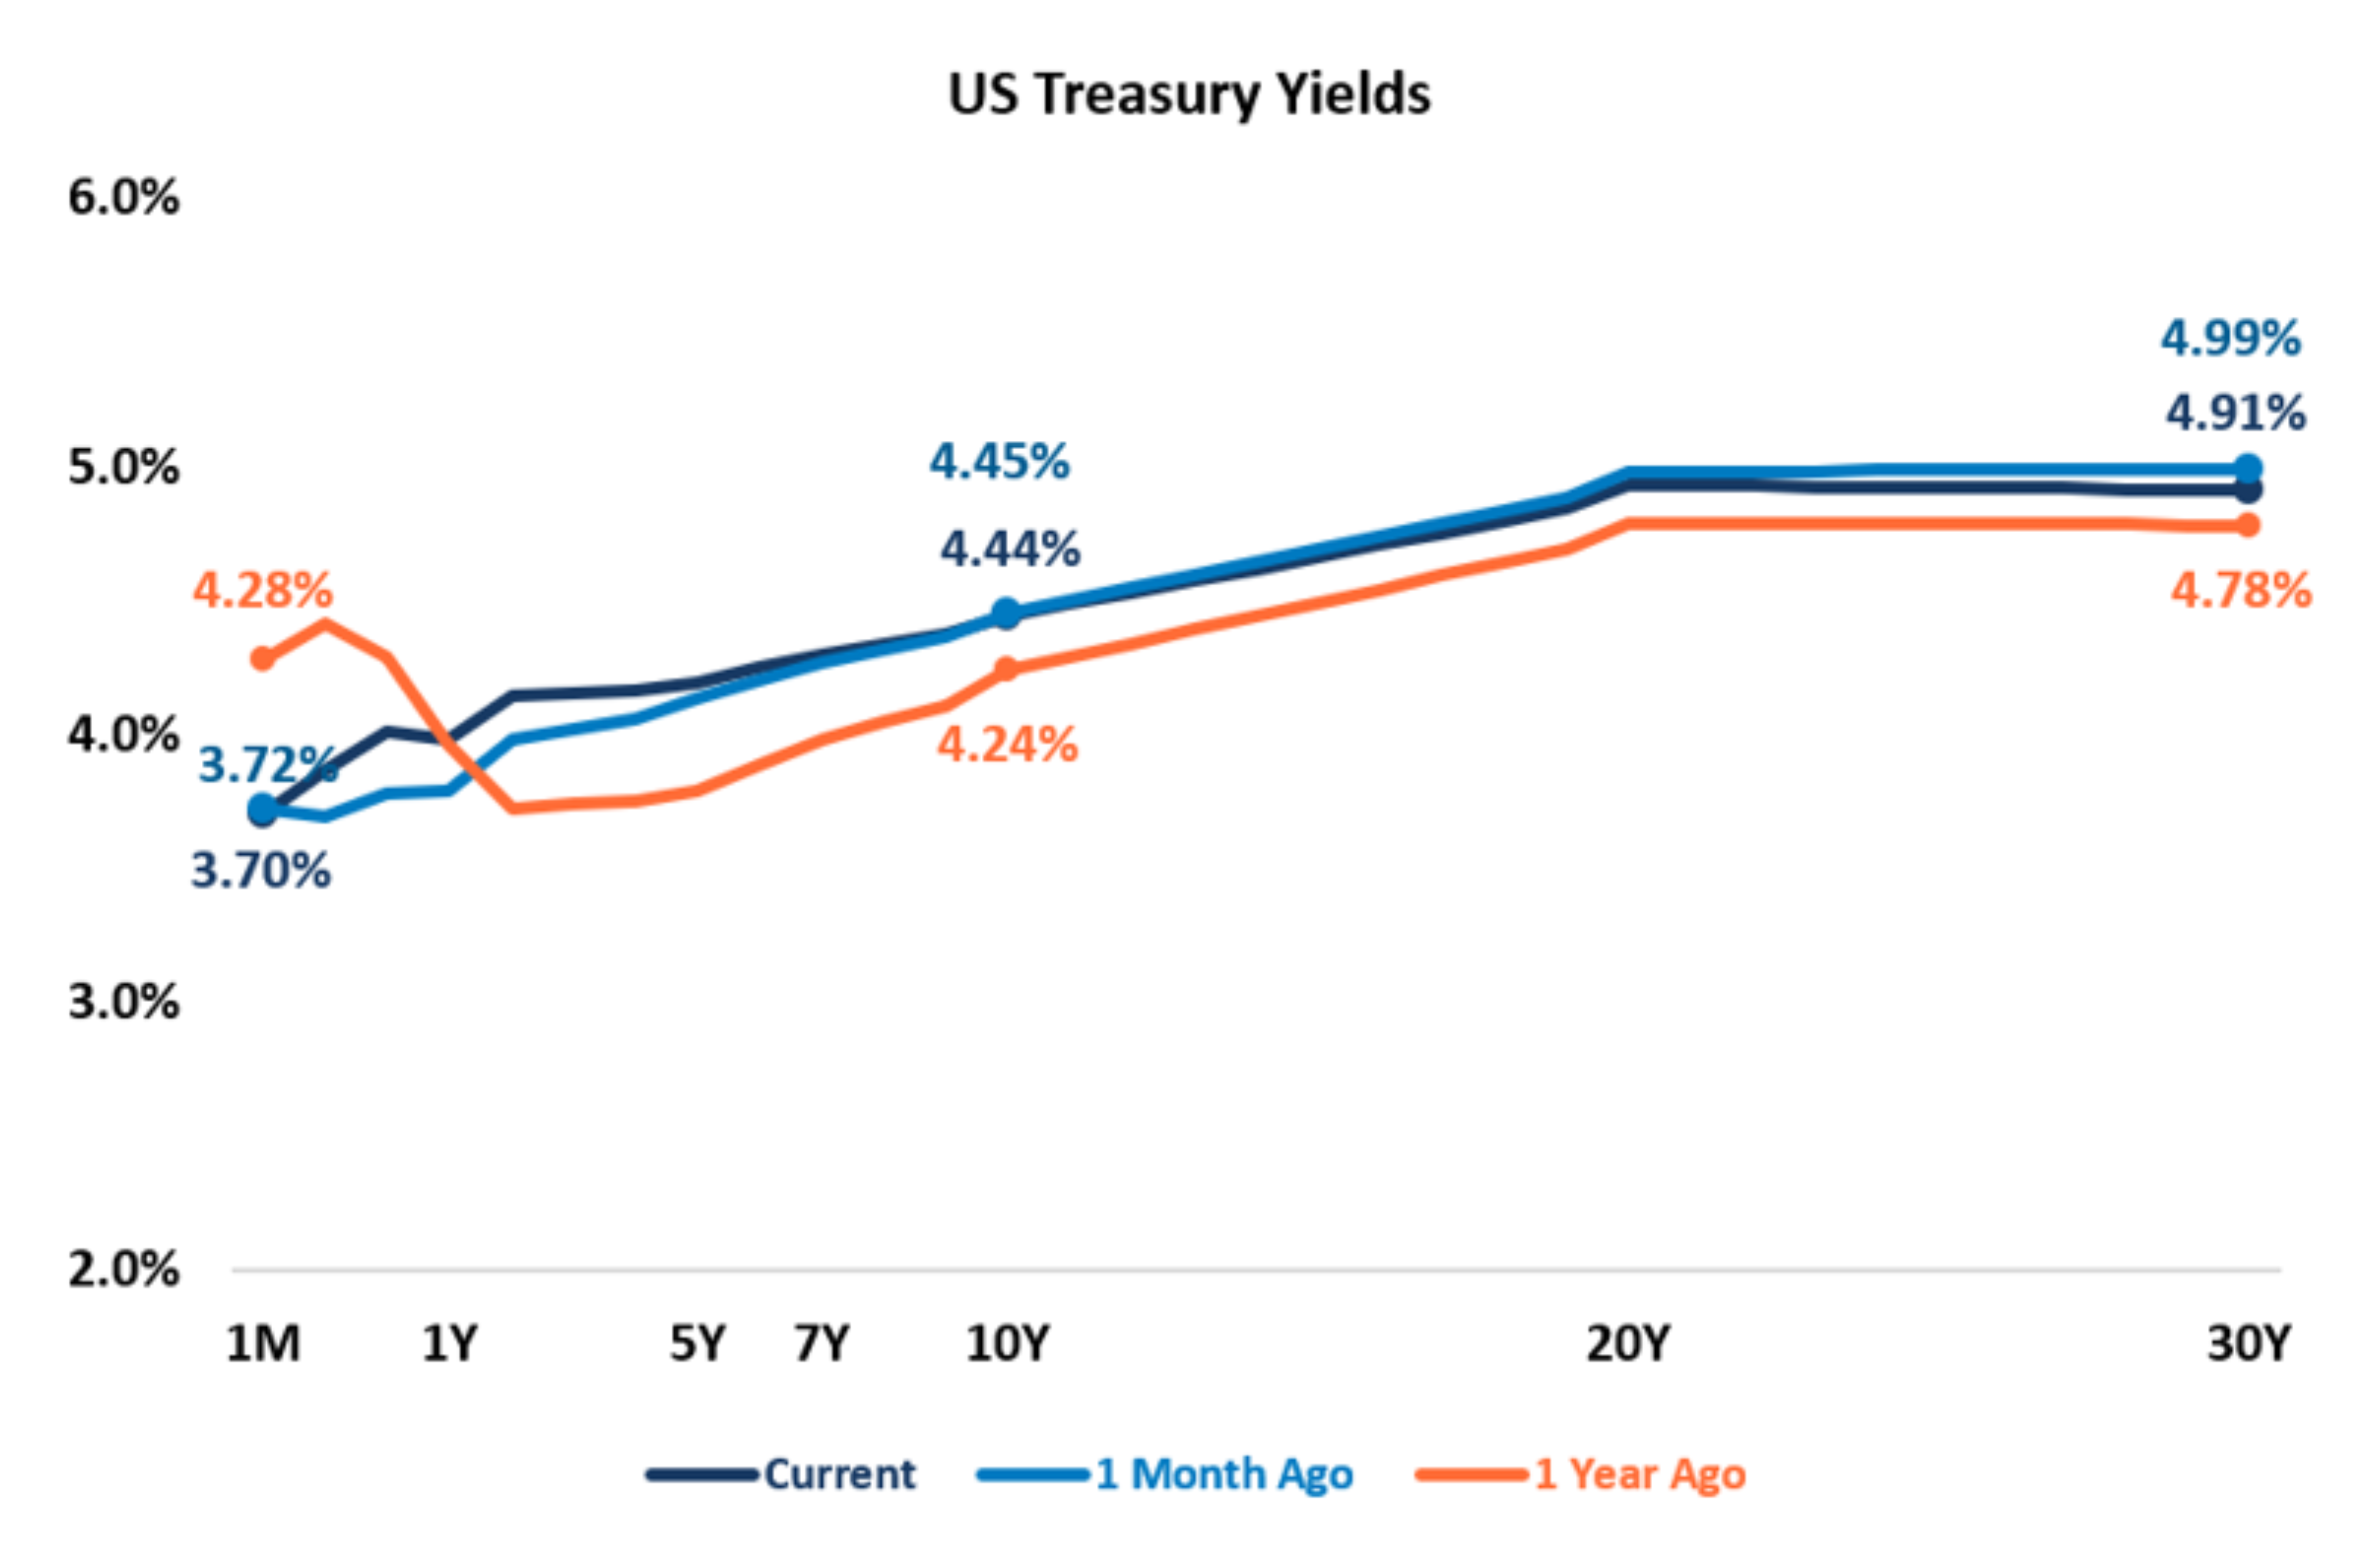
- The U.S. Treasury yield curve has shifted materially over the past year and experienced more dramatic volatility swings of late as rate expectations shifted and concerns over the health of the U.S. economy increase.
- The yield curve is no longer inverted as a final Fed cut in late 2025 lowered the front end, and longer-term yields have moved higher with the risk of persistent inflation.
- The yield curve is likely to remain positively sloped through the rest of the year, though the degree of steepness depends largely on the path of inflation and the Fed’s monetary policy.
- If inflation remains sticky, the Fed is likely to raise rates at least once before the end of the year.
- If inflation comes down materially, the chances of a rate hike decreases.
- Long-term yields could spike should concerns over U.S. debt and deficits escalate.
- Takeaways
- Inflation is likely the key determinant of the Fed’s path on monetary policy decisions in the near term.
- Increasing duration in fixed income portfolios may be appropriate, especially for long-term investors invested exclusively in short-duration fixed income assets.
Long-Term Investors Should Stay Invested
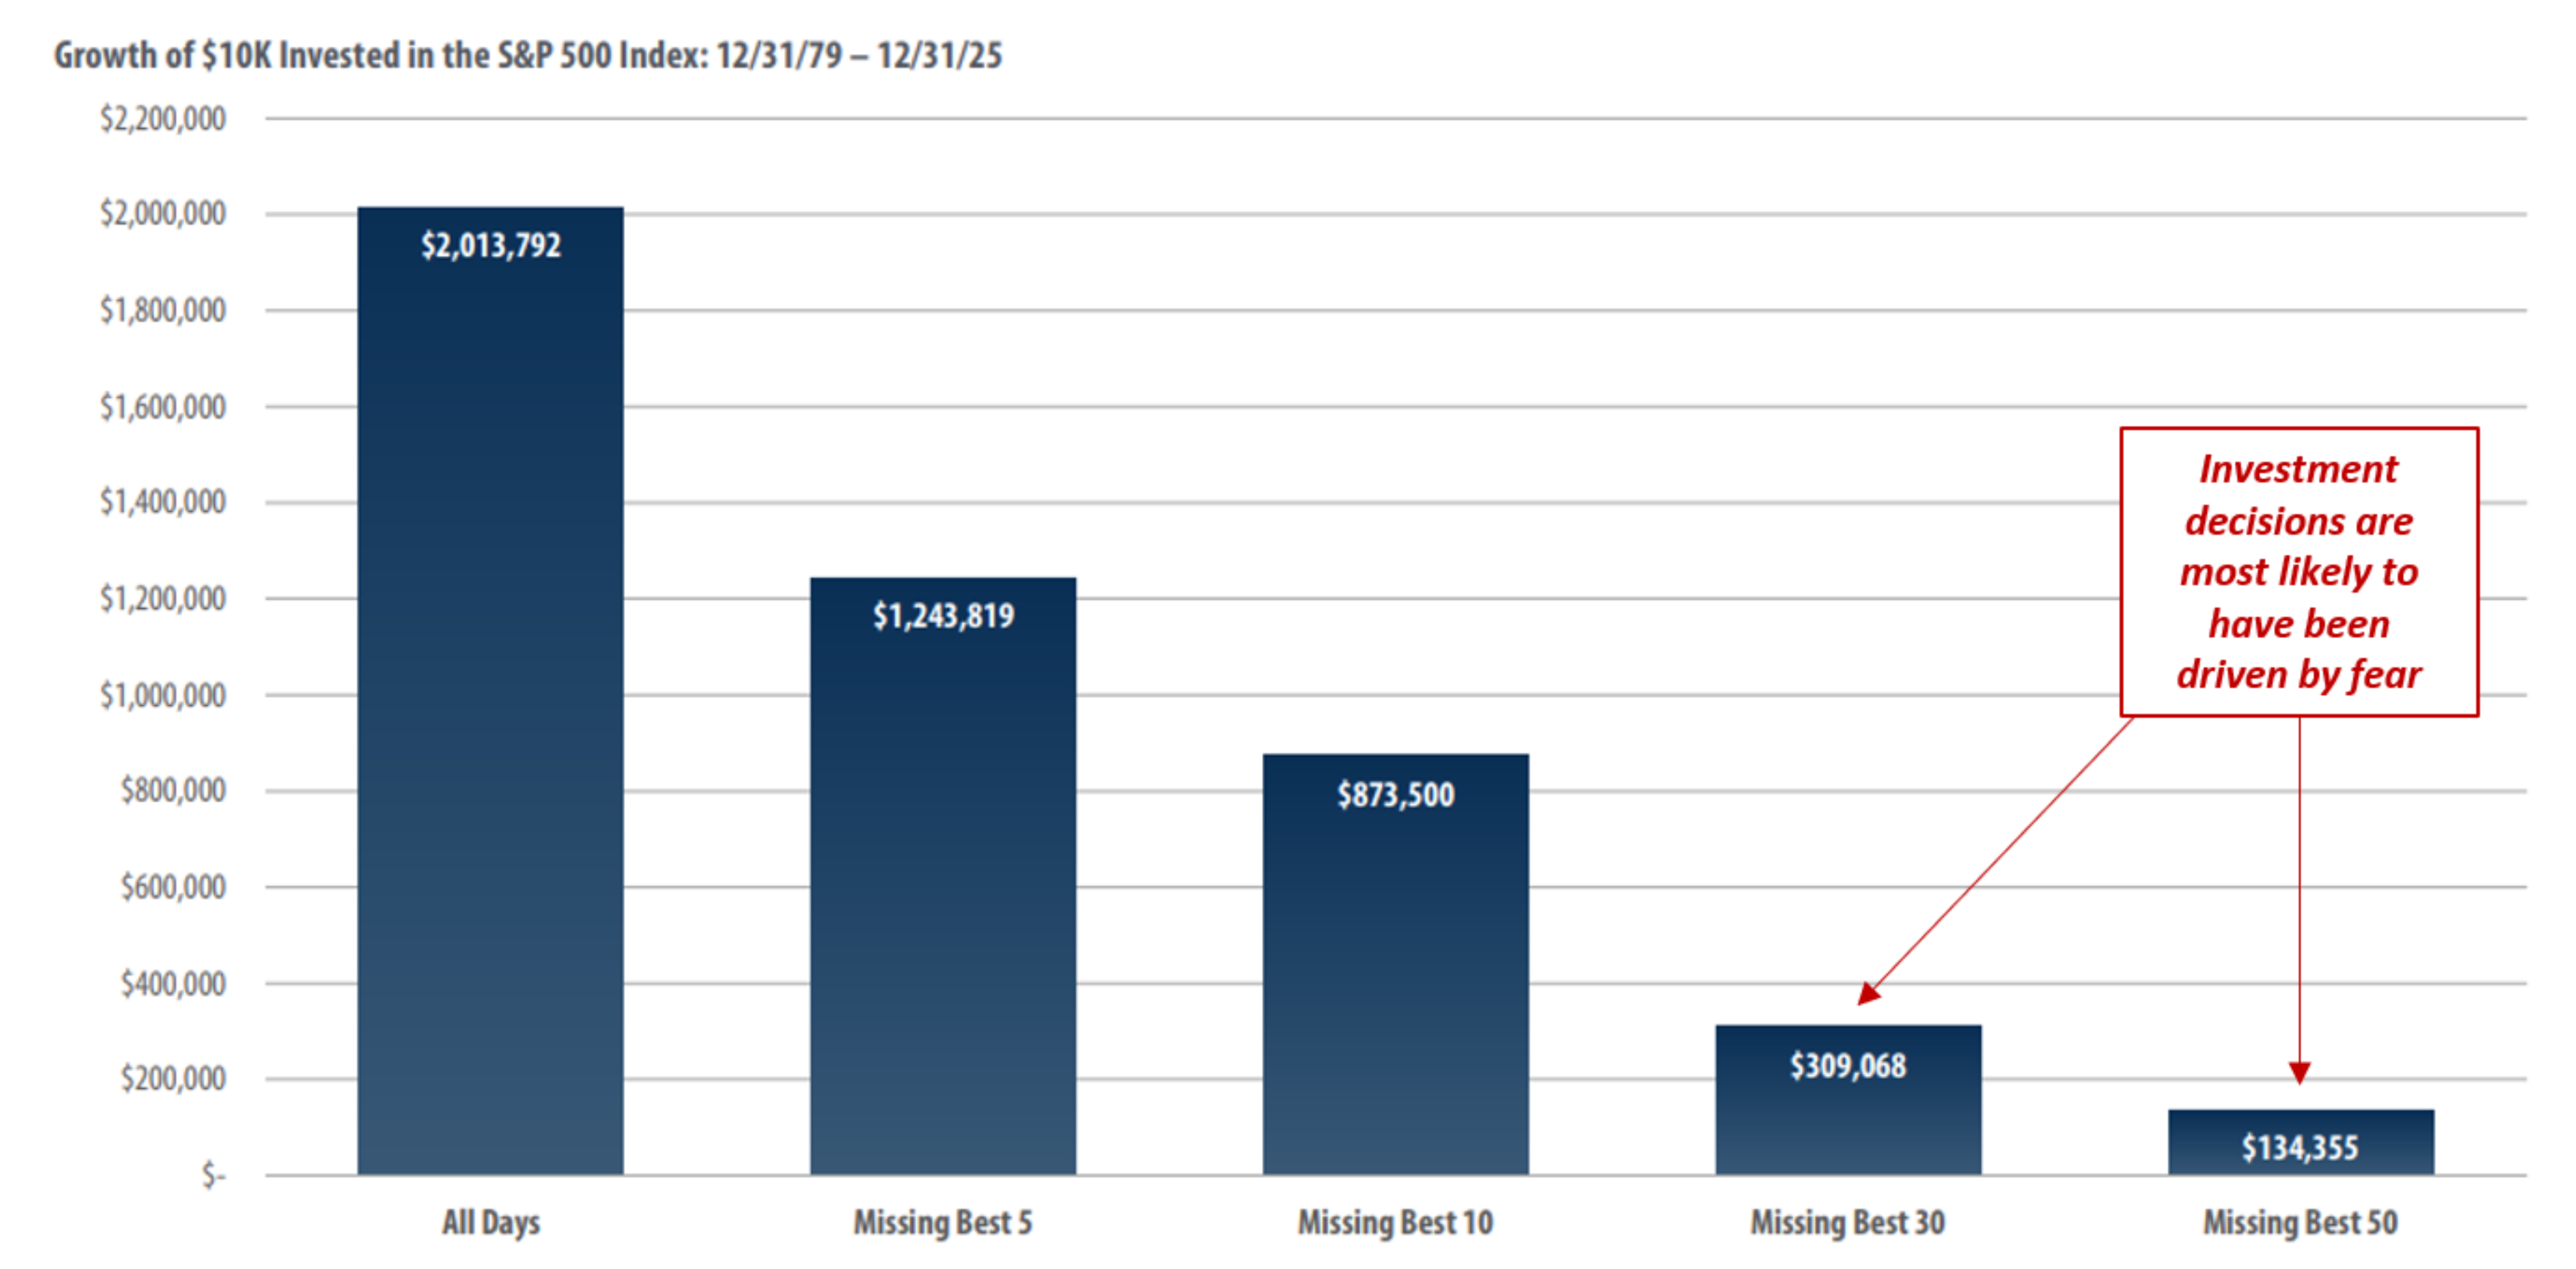
- The chart highlights how a $10k investment in the S&P 500 would grow over the next 45 years.
- If the investor missed the best 30 days of market performance, the investment portfolio would be worth more than $1.3M less than if the investor had stayed in the market.
- Takeaways
- The market’s best performance days typically occur during periods of elevated volatility.
- Regardless of what may be in store for the macroeconomy and capital markets, long-term investors should avoid the temptation to exit out of markets during periods of elevated uncertainty.
- Riding out market volatility is the best way to build wealth over the long term.
Equity Market Volatility
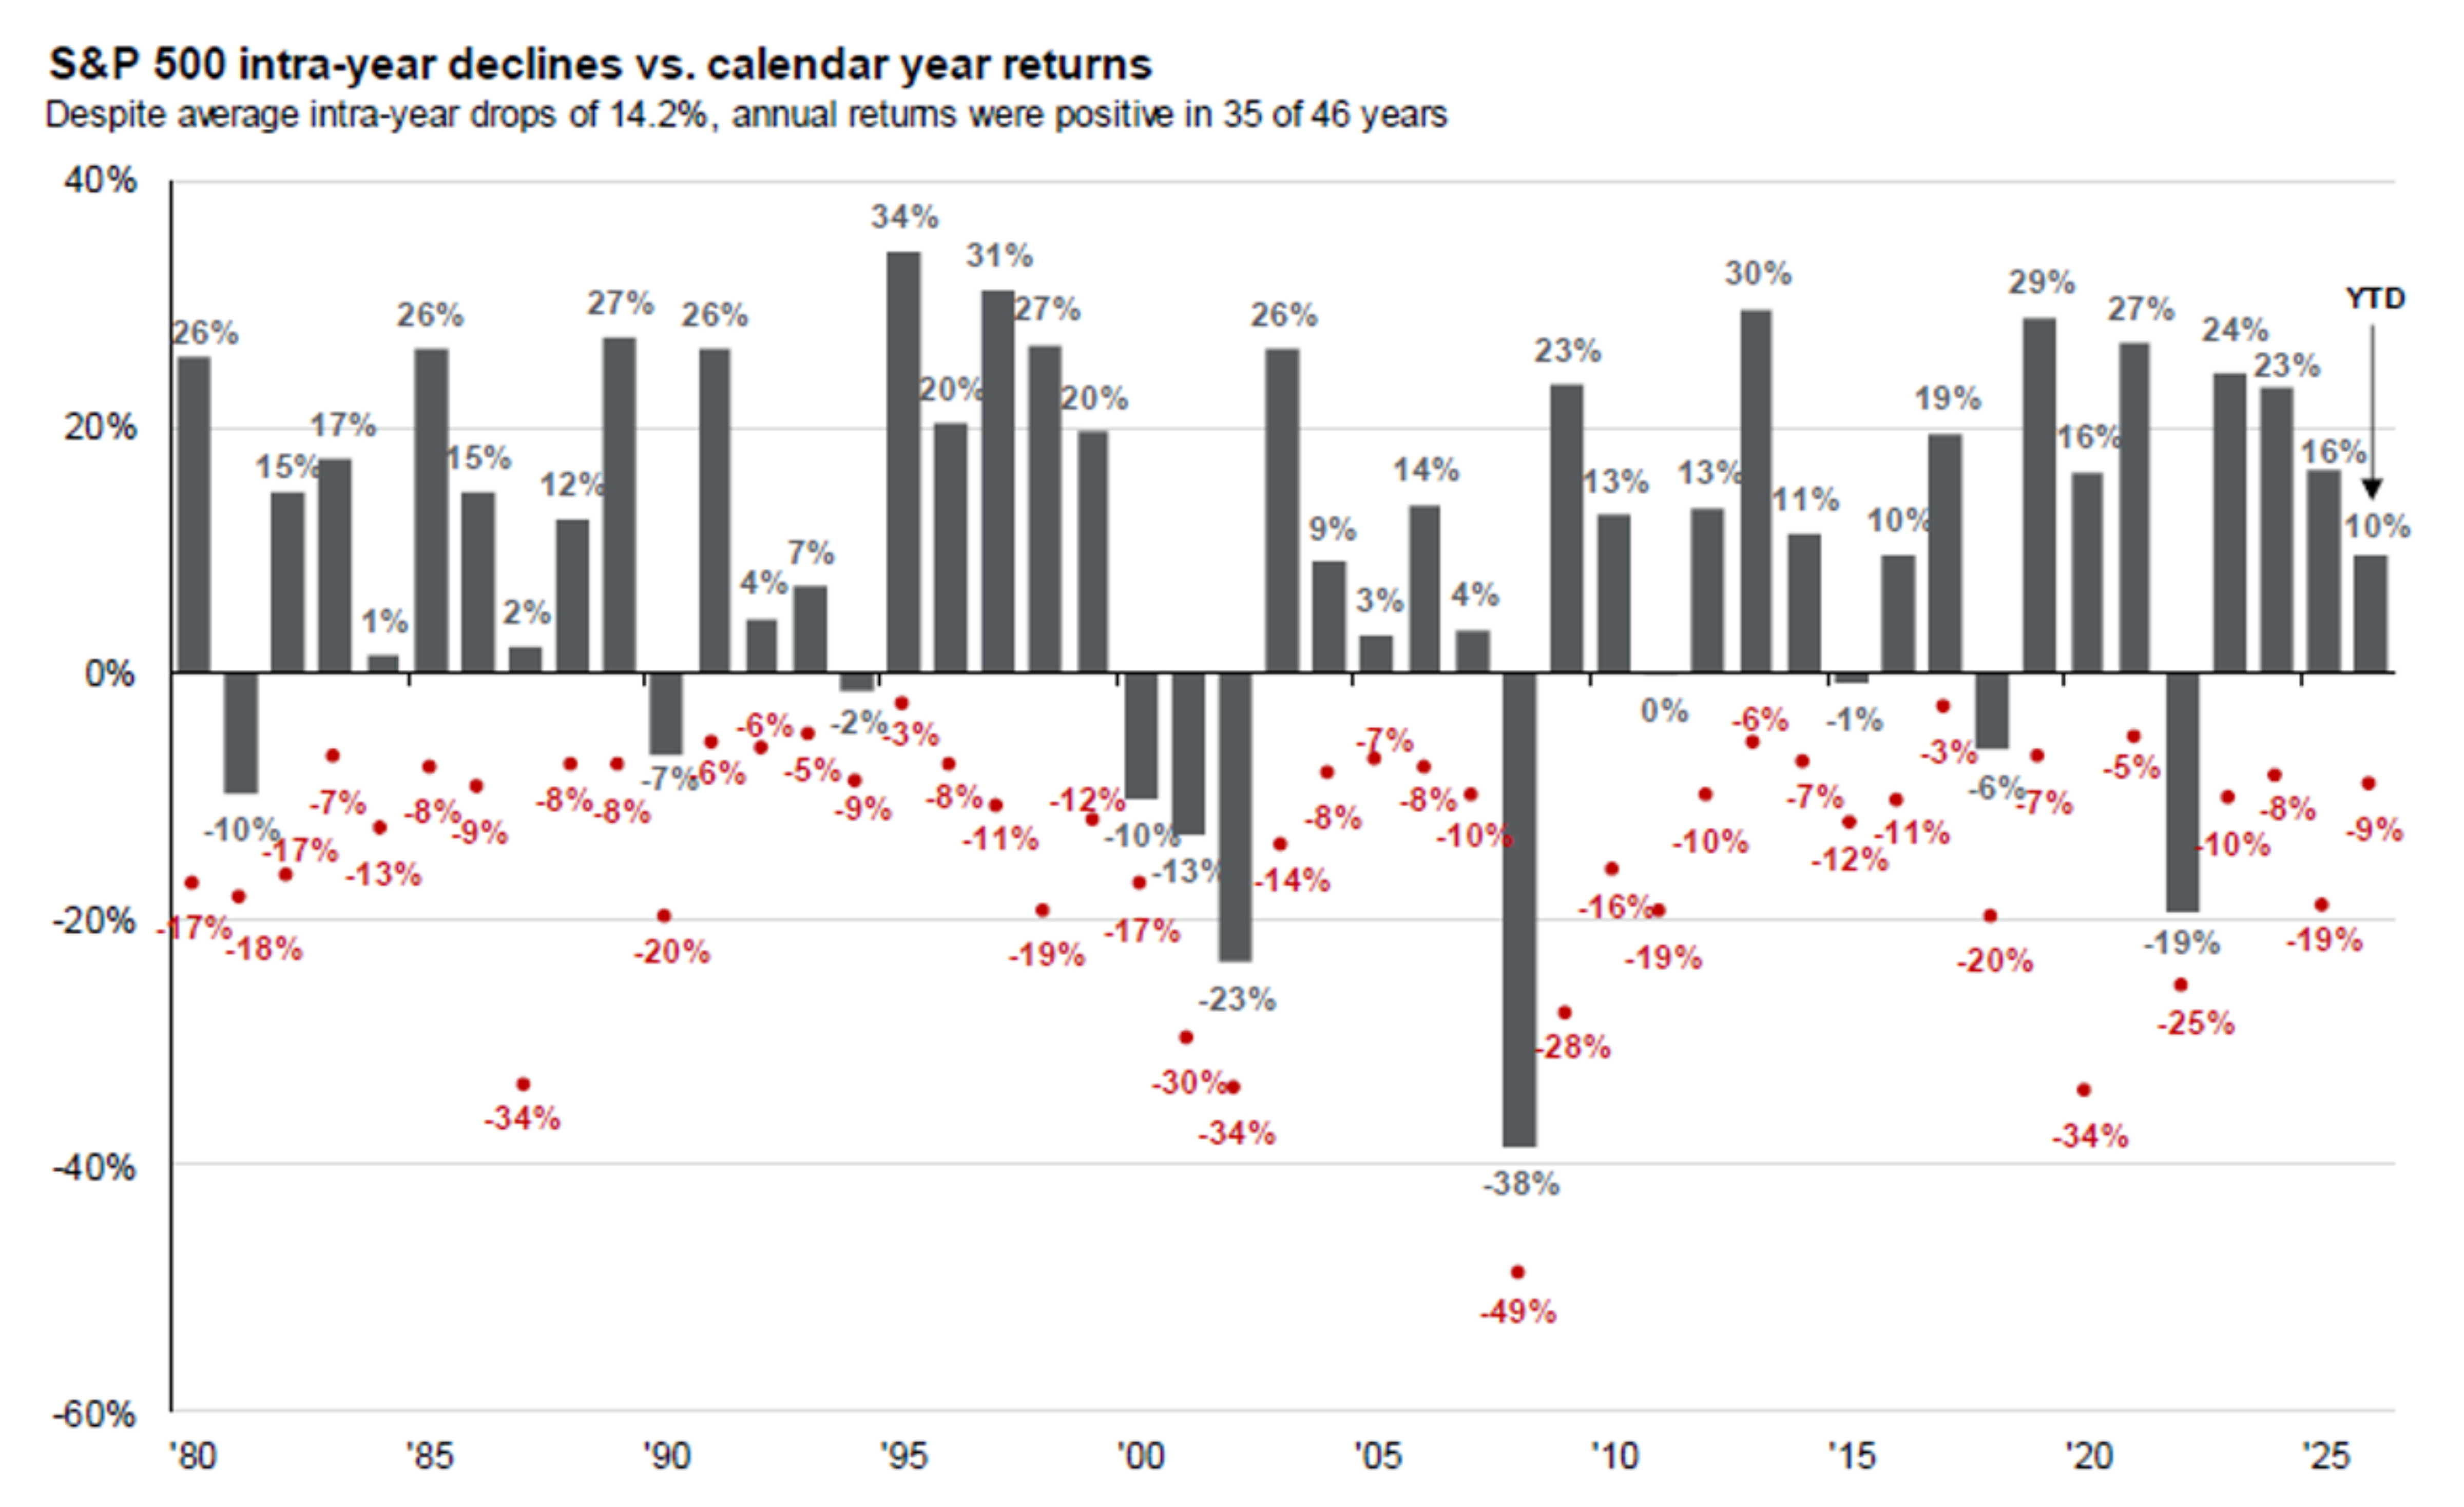
- The chart illustrates annual S&P 500 performance since 1980 (shown in columns above) and the intra-year declines during each year (shown by the red dots).
- Ex: In 2020, the S&P 500 experienced an intra-year decline of -34% before finishing up 16% for the year.
- Over the past 45 years, the S&P 500 has experienced an average intra-year decline of 14%. Despite that, the S&P 500 had positive annual performance in 34 of the last 46 years.
- Takeaway
- As painful as market volatility can be, equity market selloffs are normal, and investors are rewarded for patience.
Playbook Summary
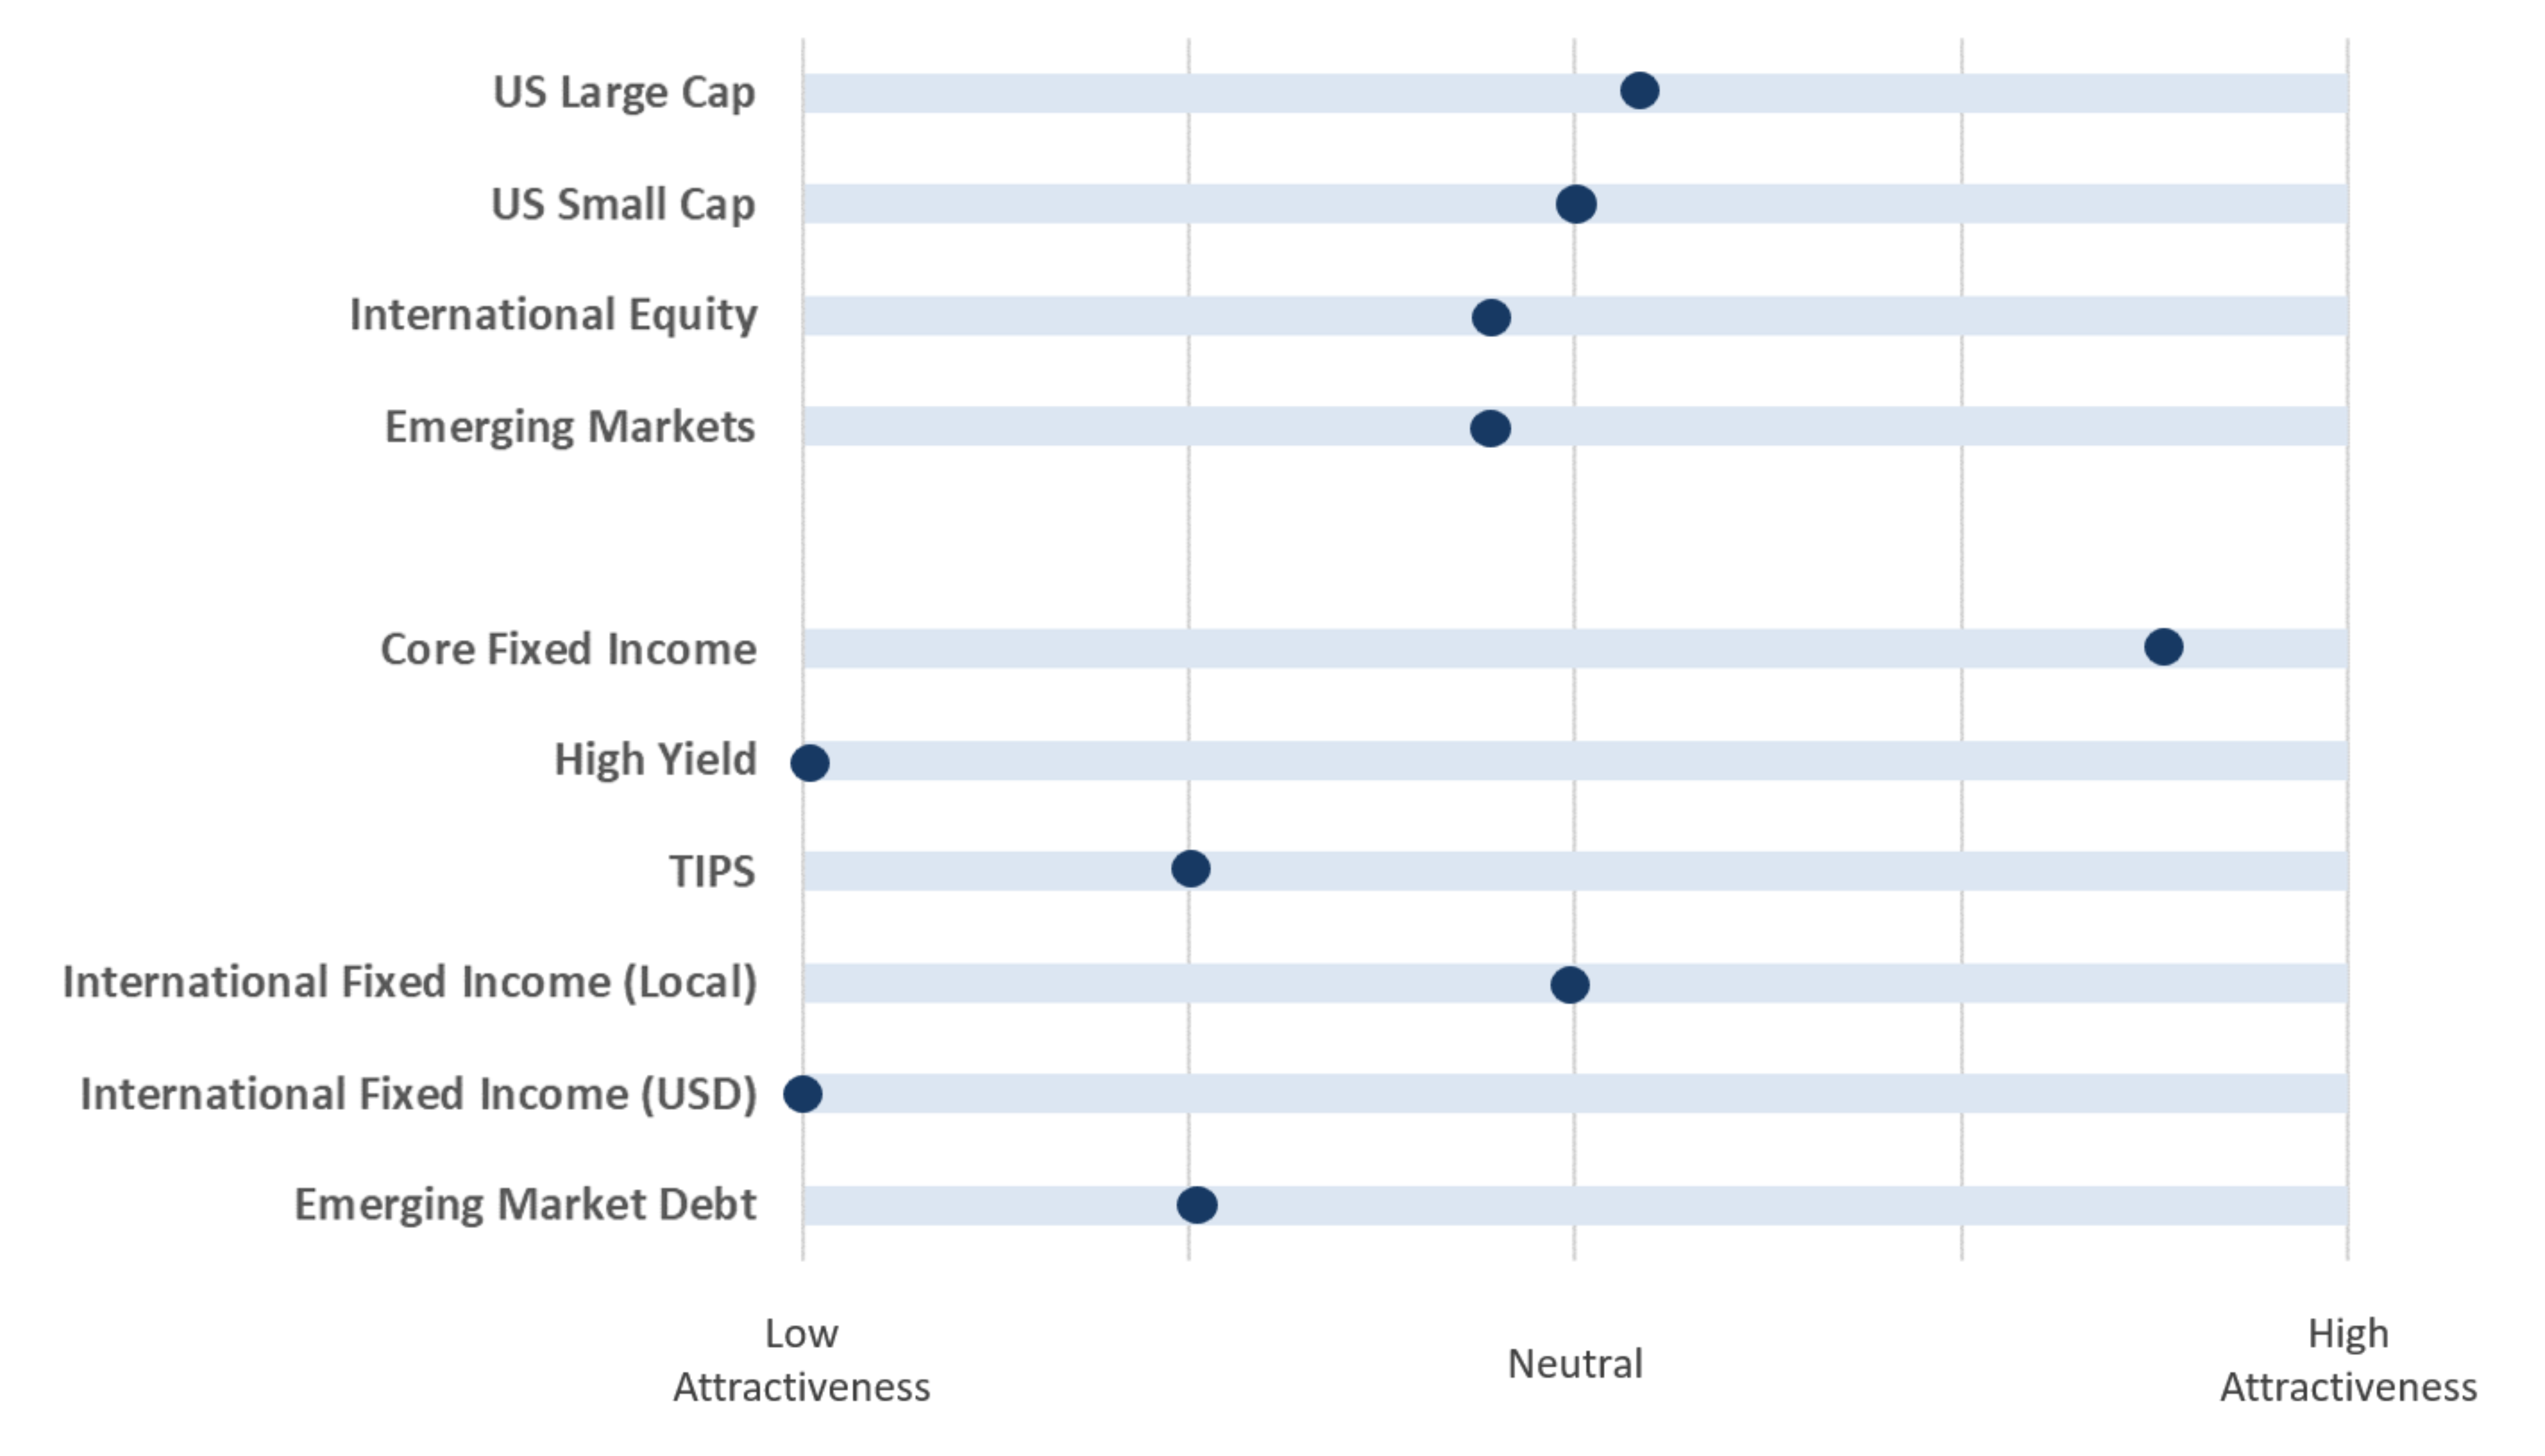
- The table to the left indicates where each major investment asset class falls on the distribution of attractiveness (from low to high). This table is meant to provide a standardized and comparable view of the level of opportunity in each asset class category.
- In subsequent quarters, we will discuss any movement along the scale for each asset class and the driving forces behind the change in outlook.
Disclosures
Investment services offered by Enterprise Bank & Trust are not deposits, obligations, or guaranteed by the bank or its affiliates. The information provided represents the opinions of Enterprise Bank & Trust and is not intended to forecast future events or guarantee future results. Past performance does not guarantee future returns. This information is for educational purposes only. Investors should consult with their investment professionals for advice concerning their particular situation.
Investments are: *Not FDIC insured *May lose value *Not financial institution guaranteed *Not a deposit *Not insured by any federal government agency.

