
June 2026 Market Update

Economic Highlights
United States
- The May employment report beat expectations with upward revisions to the prior months' reports. The headline reading of 172,000 new jobs was well ahead of the 80,000 expectation, and the March and April reports saw total upward revisions of 93,000. The unemployment rate held steady at 4.3% and the broader U6 unemployment rate declined to 8.1%. Average hourly earnings increased 0.3% M/M and 3.4% Y/Y. Leisure and hospitality led all sectors with 70,000 jobs, well above the 14,000 per month average over the past year. Health care, which has been the leading sector, contributed 35,000 new hires, about in line with its average. Local government added 55,000 and social assistance added 12,000. Broader economic growth has been solid, with 3% growth expected in Q2.
- U.S. consumer prices rose at their fastest pace in three years based on the May CPI report. Headline inflation increased 0.5% M/M or 4.2% Y/Y while Core CPI registered a gain of 0.2% M/M or 2.9% Y/Y. Most of the inflation surge came from a 3.9% jump in energy prices, putting the 12-month increase at 23.5%. Food accelerated just 0.2% and shelter costs rose 0.3%, half the gain of April. The Federal Reserve’s preferred PCE Index showed headline inflation of 4.1% in May, with core inflation at 3.4%.
- U.S. retail sales increased more than expected in May, with households boosting purchases of motor vehicles even as they paid more for gasoline, but a slowdown is likely as the cushion from larger tax refunds against higher prices diminishes. Retail sales jumped 0.9% last month after a downwardly revised 0.4% gain in April. Sales advanced 6.9% on a year-over-year basis in May. The rise is in stark contrast with consumer sentiment, which has tanked amid anxiety over inflation. Core retail sales jumped 0.7% in May, up from the 0.5% rate in the previous month.
- New orders for durable goods fell 4.5% M/M in May, the first monthly fall in three months, following an upwardly revised 8.5% gain in April. The fall in May durable goods orders was driven by a 51.8% M/M plunge in orders for nondefense aircraft and parts, following a 167.4% surge in April and a 23.0% slump in March. Non-defense capital goods orders excluding aircraft, a closely watched proxy for business spending, increased 1.6% last month after an upwardly revised 0.7% decline in April.
Non-U.S. Developed
- The eurozone flash composite PMI showed continued weakness in service sector activity in June. The headline PMI reading of 49.5 in June was up from 48.5 in May but still sits below the 50 level that separates expansion from contraction. Activity in the service sector rose to a three-month high at 48.9, and the manufacturing PMI came in at a four-month low of 51.3. There were signs of inflationary pressures softening, with input costs rising at the slowest pace since the outbreak of war in the Middle East and output charges increasing at the weakest rate in three months. Economists believe the current PMI readings suggest an economic picture that is teetering on recession.
- Japan's government has drafted an economic blueprint targeting more than 1% real and 3% nominal annual growth, backed by $2.29 trillion in combined investment through 2040, while urging the Bank of Japan to keep rates supportive of the growth agenda. The Japanese economy expanded at an annualized clip of 2.1% last quarter and the BOJ raised its target lending rate to 1% to counter rising inflation from the Iran conflict.
Emerging Markets
- China’s factory activity picked up pace in June, with the official manufacturing PMI expanding to 50.3 in June from 50.0 in May. This was better than anticipated and likely driven by demand for AI hardware and exports. The sub-index for new orders climbed to 51.2 in June from 49.9 in May, and the sub-index on production also expanded to 51.4 from 51.2. The smaller-company focused RatingDog China Manufacturing PMI inched down to a three-month low of 51.7 in June 2026 from 51.8 in May.
- China’s manufacturing engine has remained resilient this year, with surging demand for AI technology offsetting the drag from Middle East turmoil, even as domestic demand remains weak. China’s non-manufacturing PMI, which tracks construction and services activity, rose to 50.2 from 50.1 in May. Construction’s business activity index continued to contract in June, edging up 0.2 percentage points to 49.0 from the prior month.
- Retail sales in China, a gauge of consumption, declined in May for the first time since December 2022, dropping 0.6% from a year earlier. Industrial production was a bright spot in May, while real estate spending and investment exhibited weakness.
- Many economists have raised their growth forecasts for South Korea over the past few months as the country continues to ride the wave of global AI spending. Economists now expect 4% GDP growth for the current fiscal year, up from about 1% at the start of the year. Taiwan has experienced a similar growth boom, primarily led by the surge in semiconductor exports to fuel the AI infrastructure buildout.
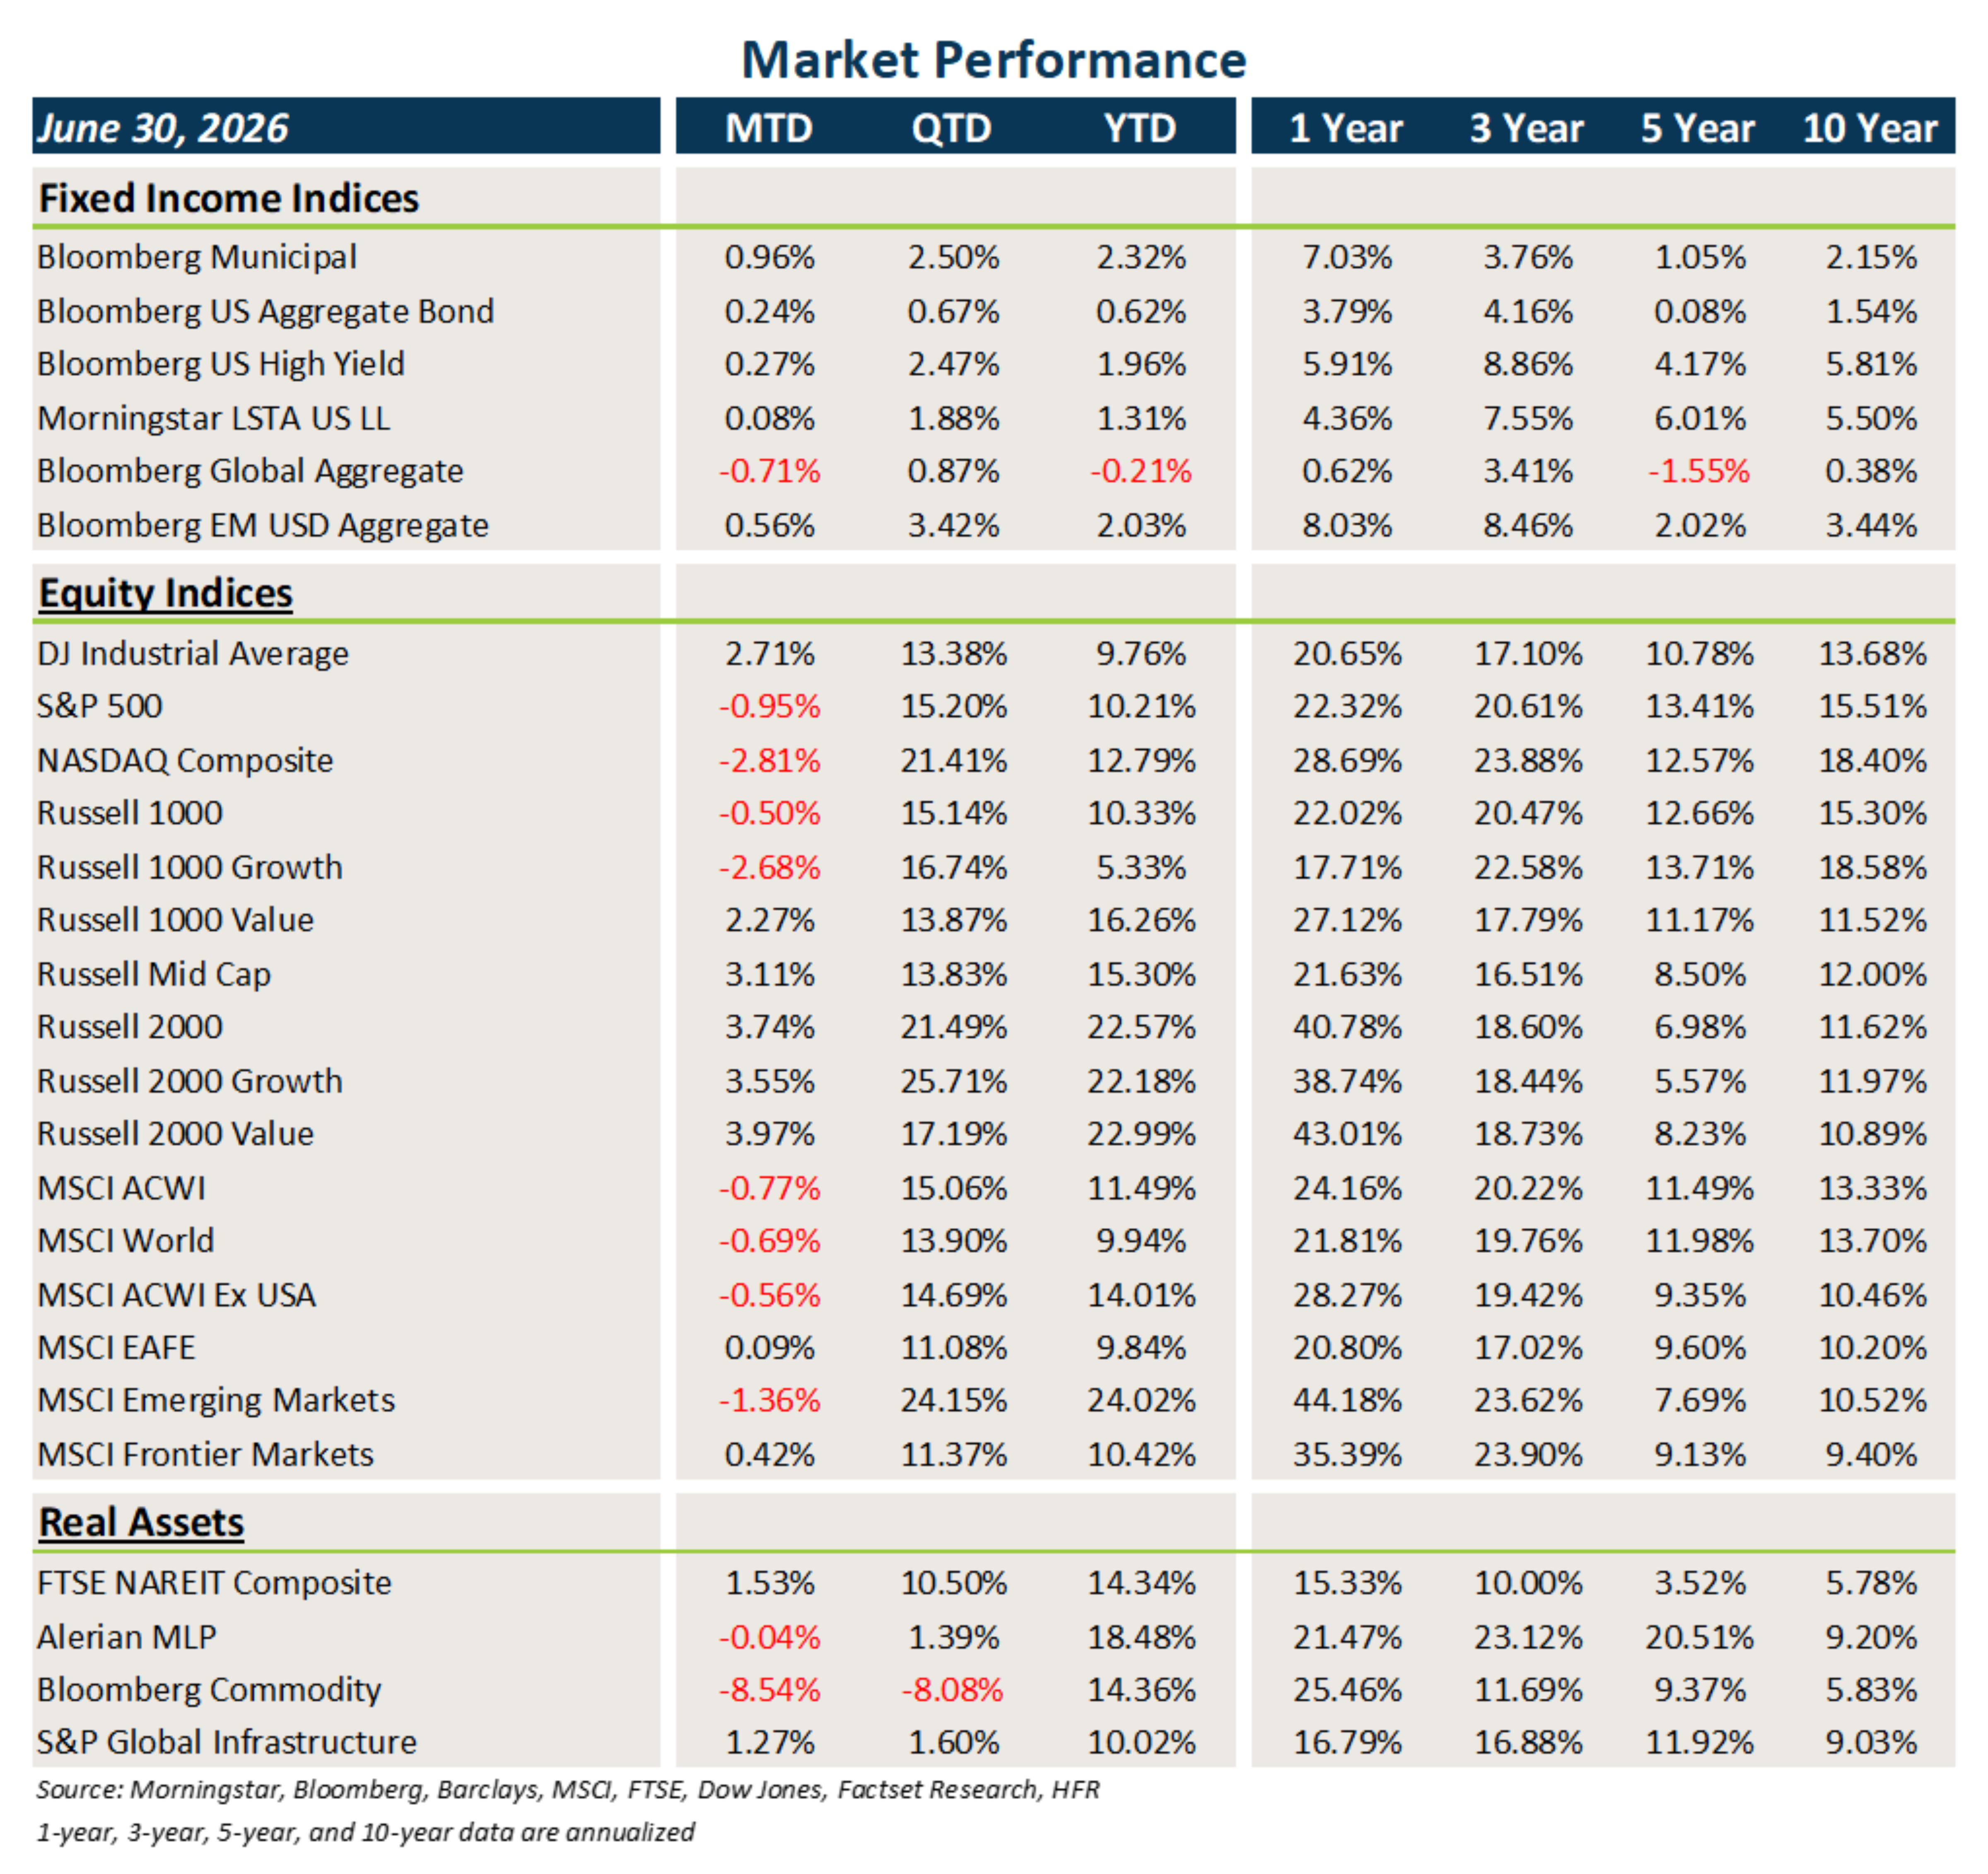
Market Performance (as of 6/30/26)
Fixed Income
- Interest rate volatility subsided a bit in June, and this was positive for core fixed income and municipal bonds that generally benefited from lower rates.
- It was generally another month of clipping coupons in credit markets, as tight spreads may limit total return potential.
- Bonds outside the U.S. faced the headwind of the stronger USD, which ultimately hurt returns.
U.S. Equities
- U.S. equities were a mixed bag last month, with gains in small caps and losses in large caps, particularly the Mag 7 stocks.
- Value beat growth across all market caps, and small caps outpaced large caps.
- Many of the Mag 7 stocks have struggled a bit this year, allowing for a positive broadening out of equity markets.
Non-U.S. Equities
- EAFE equities posted slight gains in June, led by beaten-down value stocks.
- Small caps underperformed large caps outside the U.S. and, in general, value beat growth.
- The strong USD cost EAFE investors 231 bps of performance in June and EM investors 133 bps.
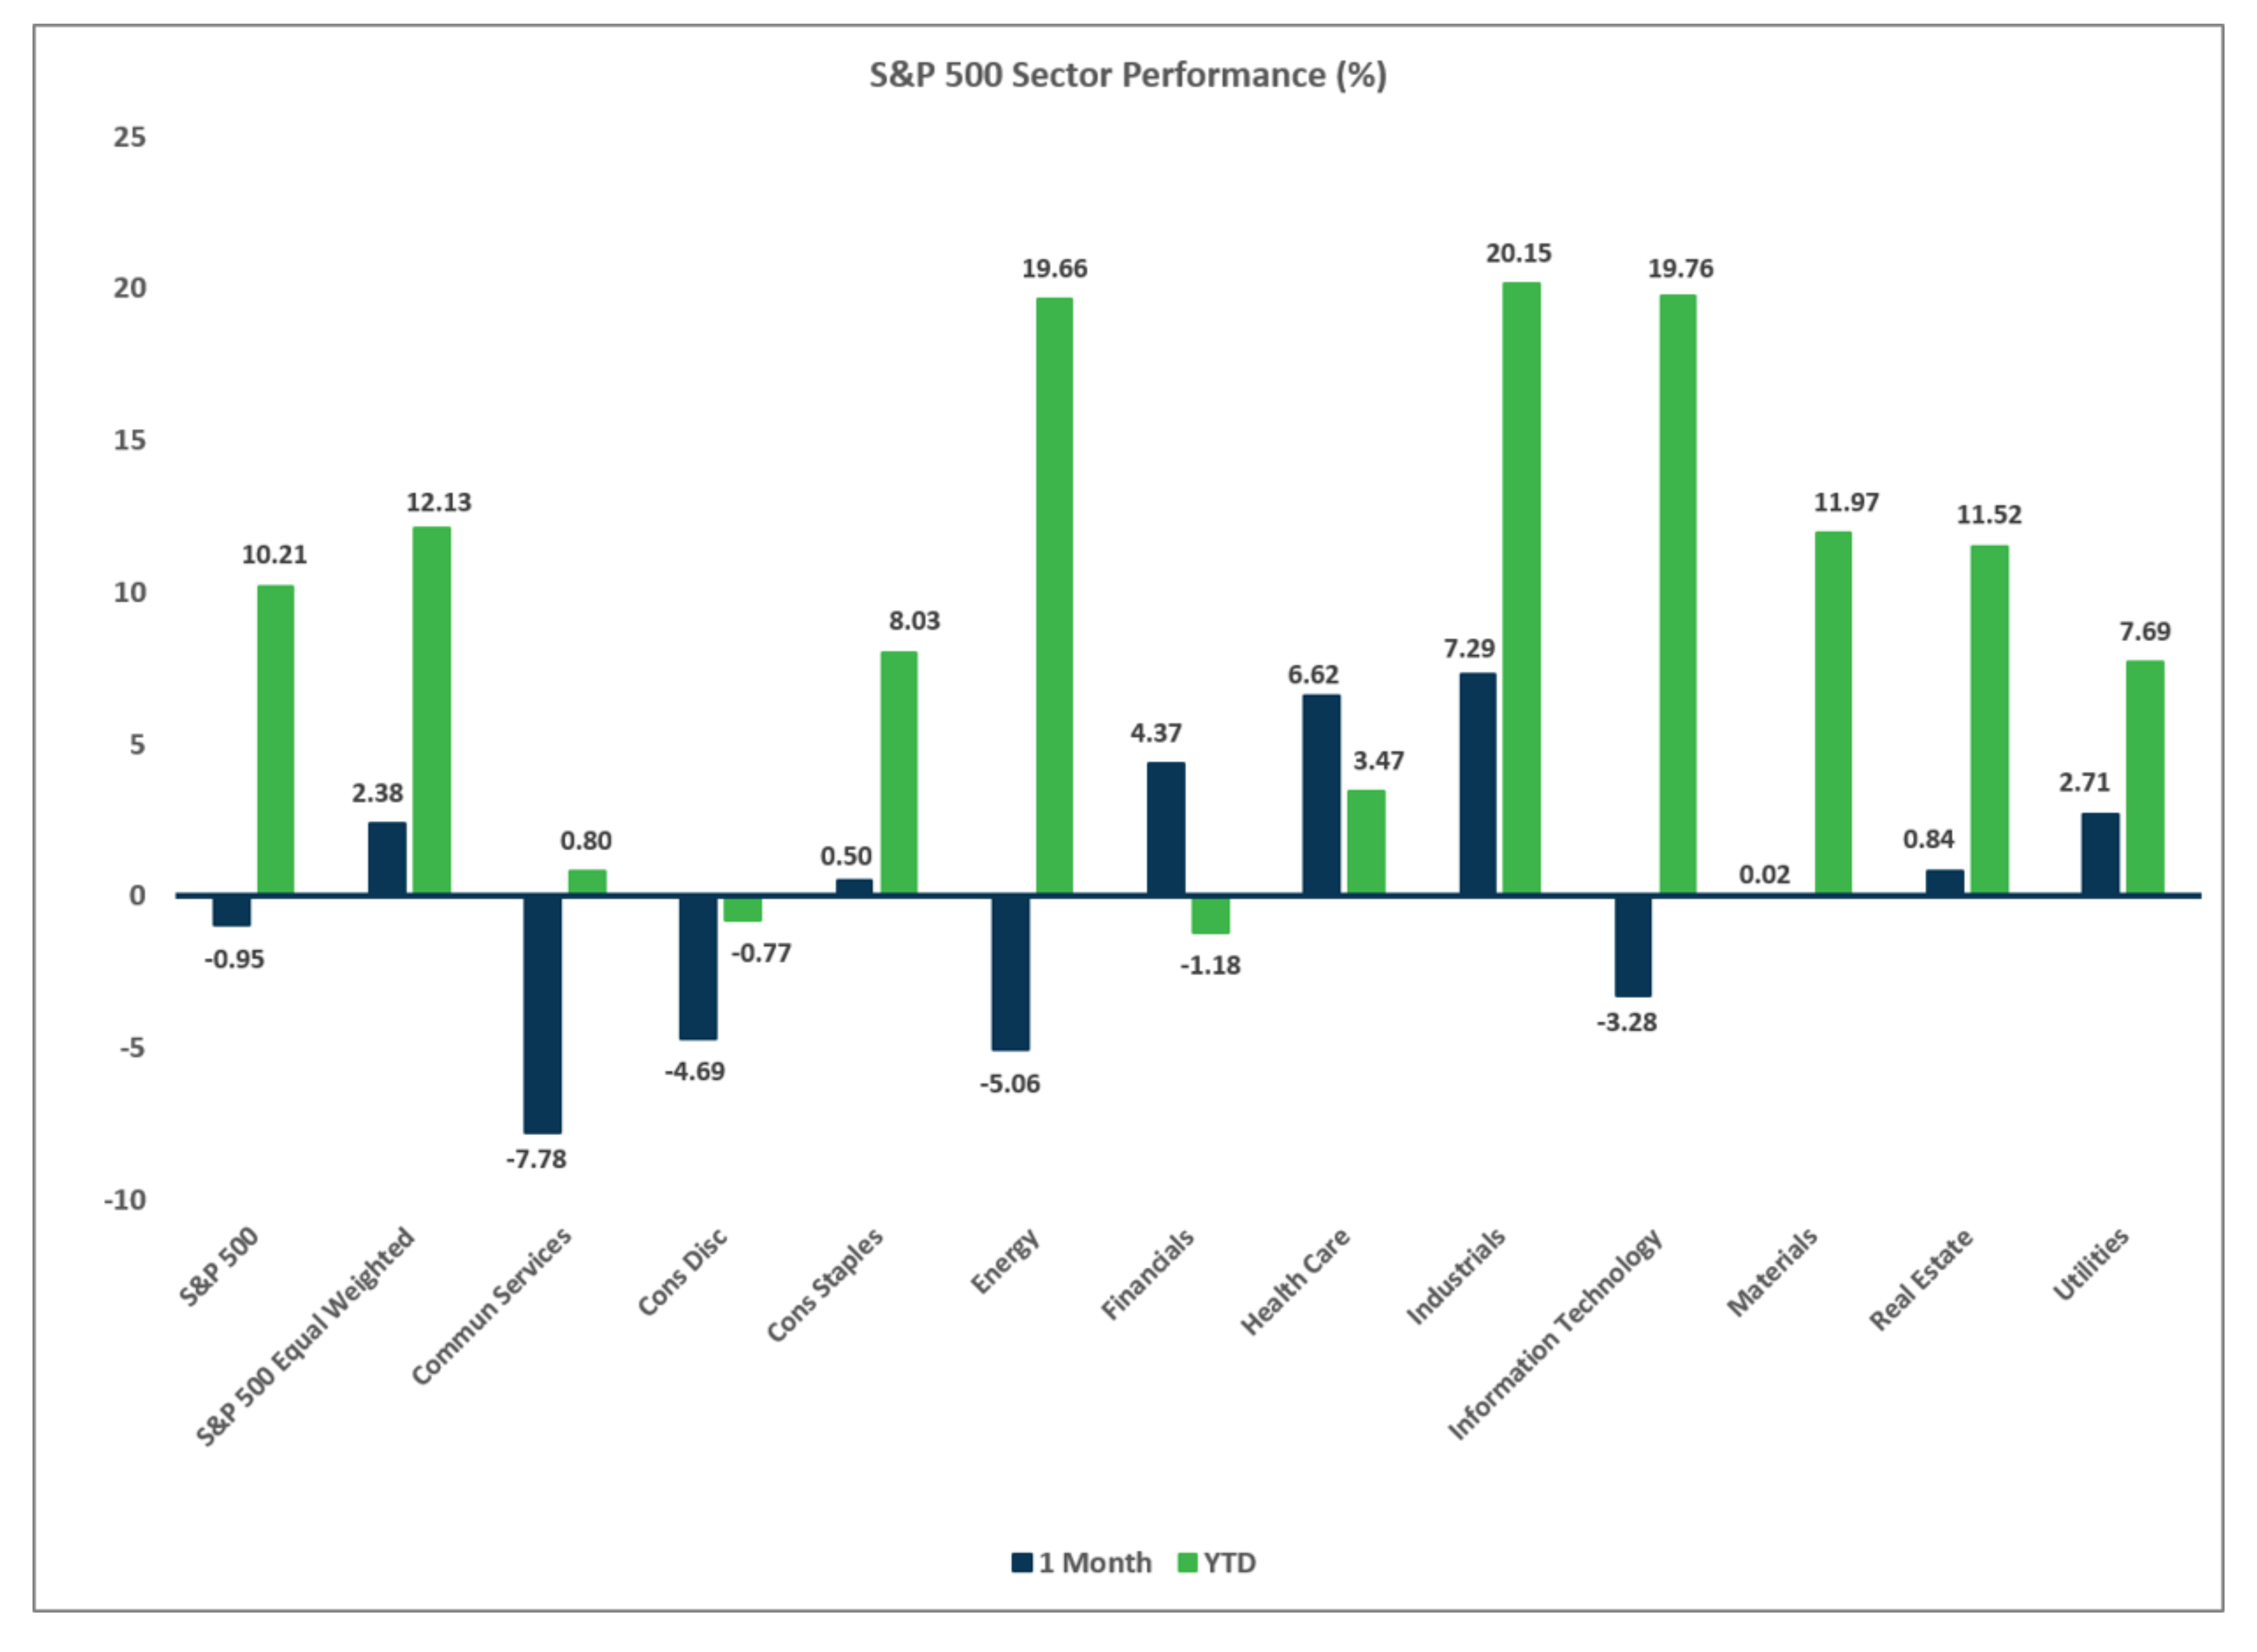
Sector Performance – S&P 500 (as of 6/30/26)
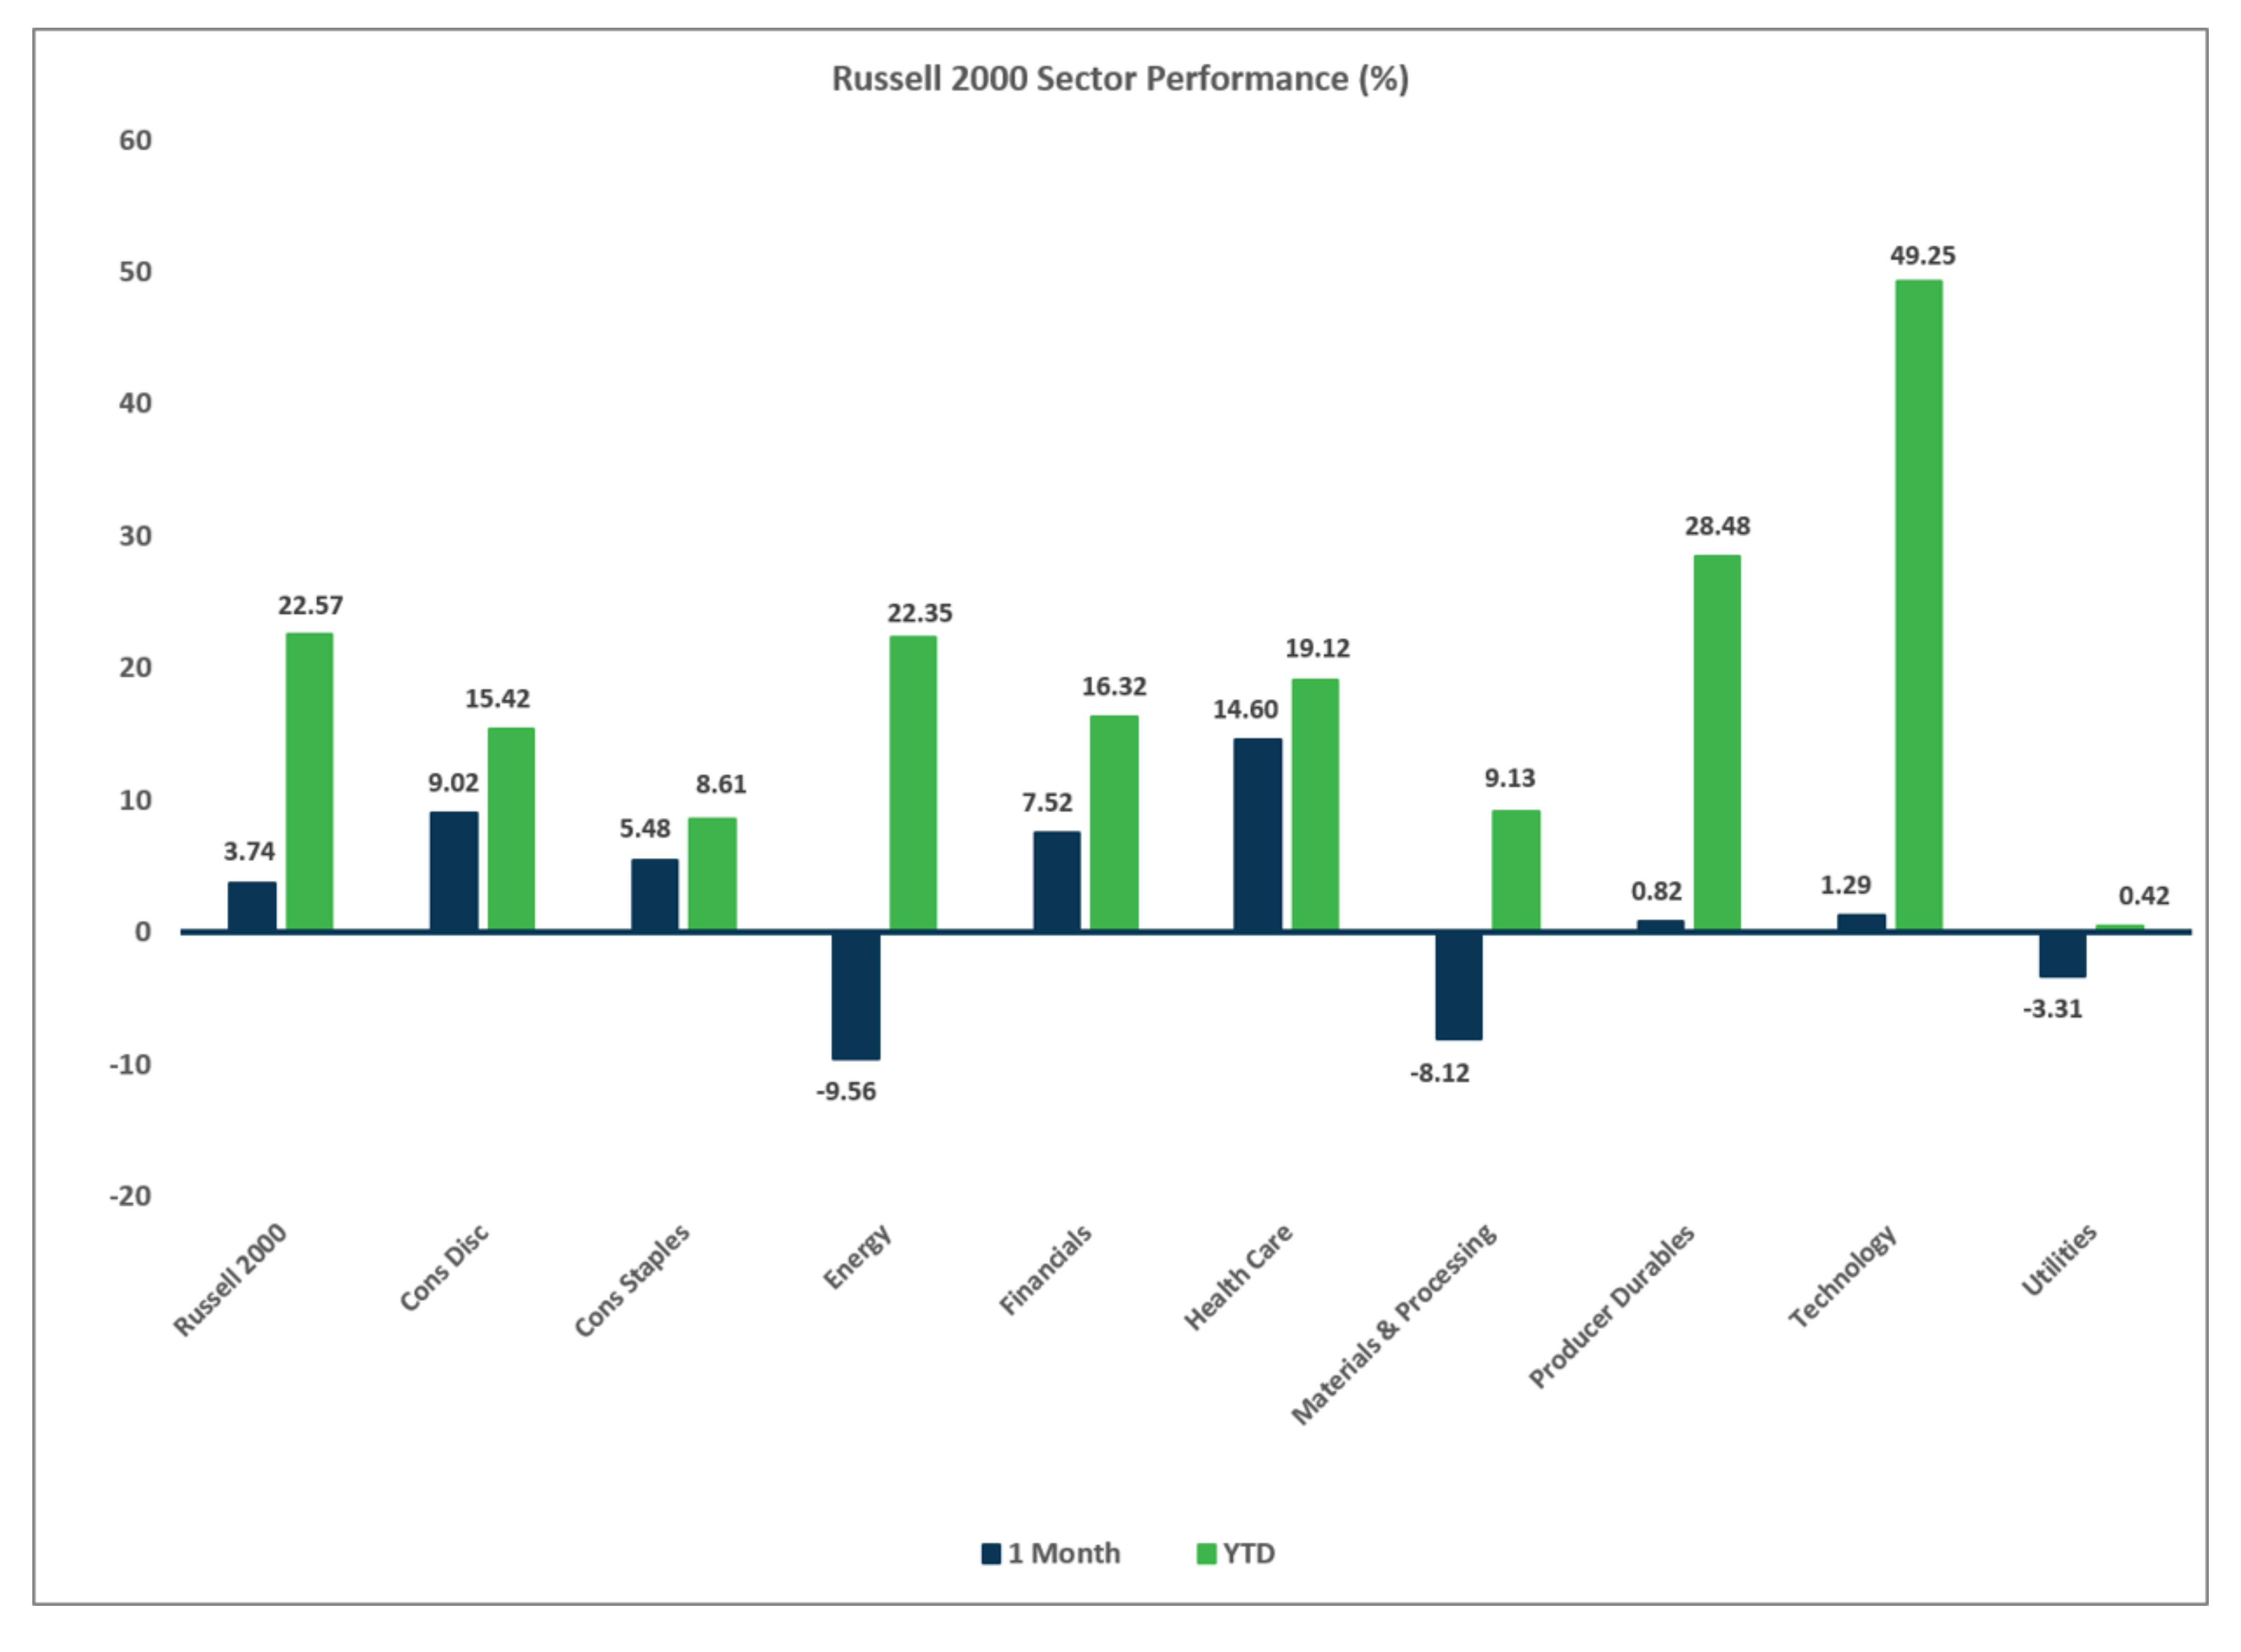
Sector Performance – Russell 2000 (as of 6/30/26)
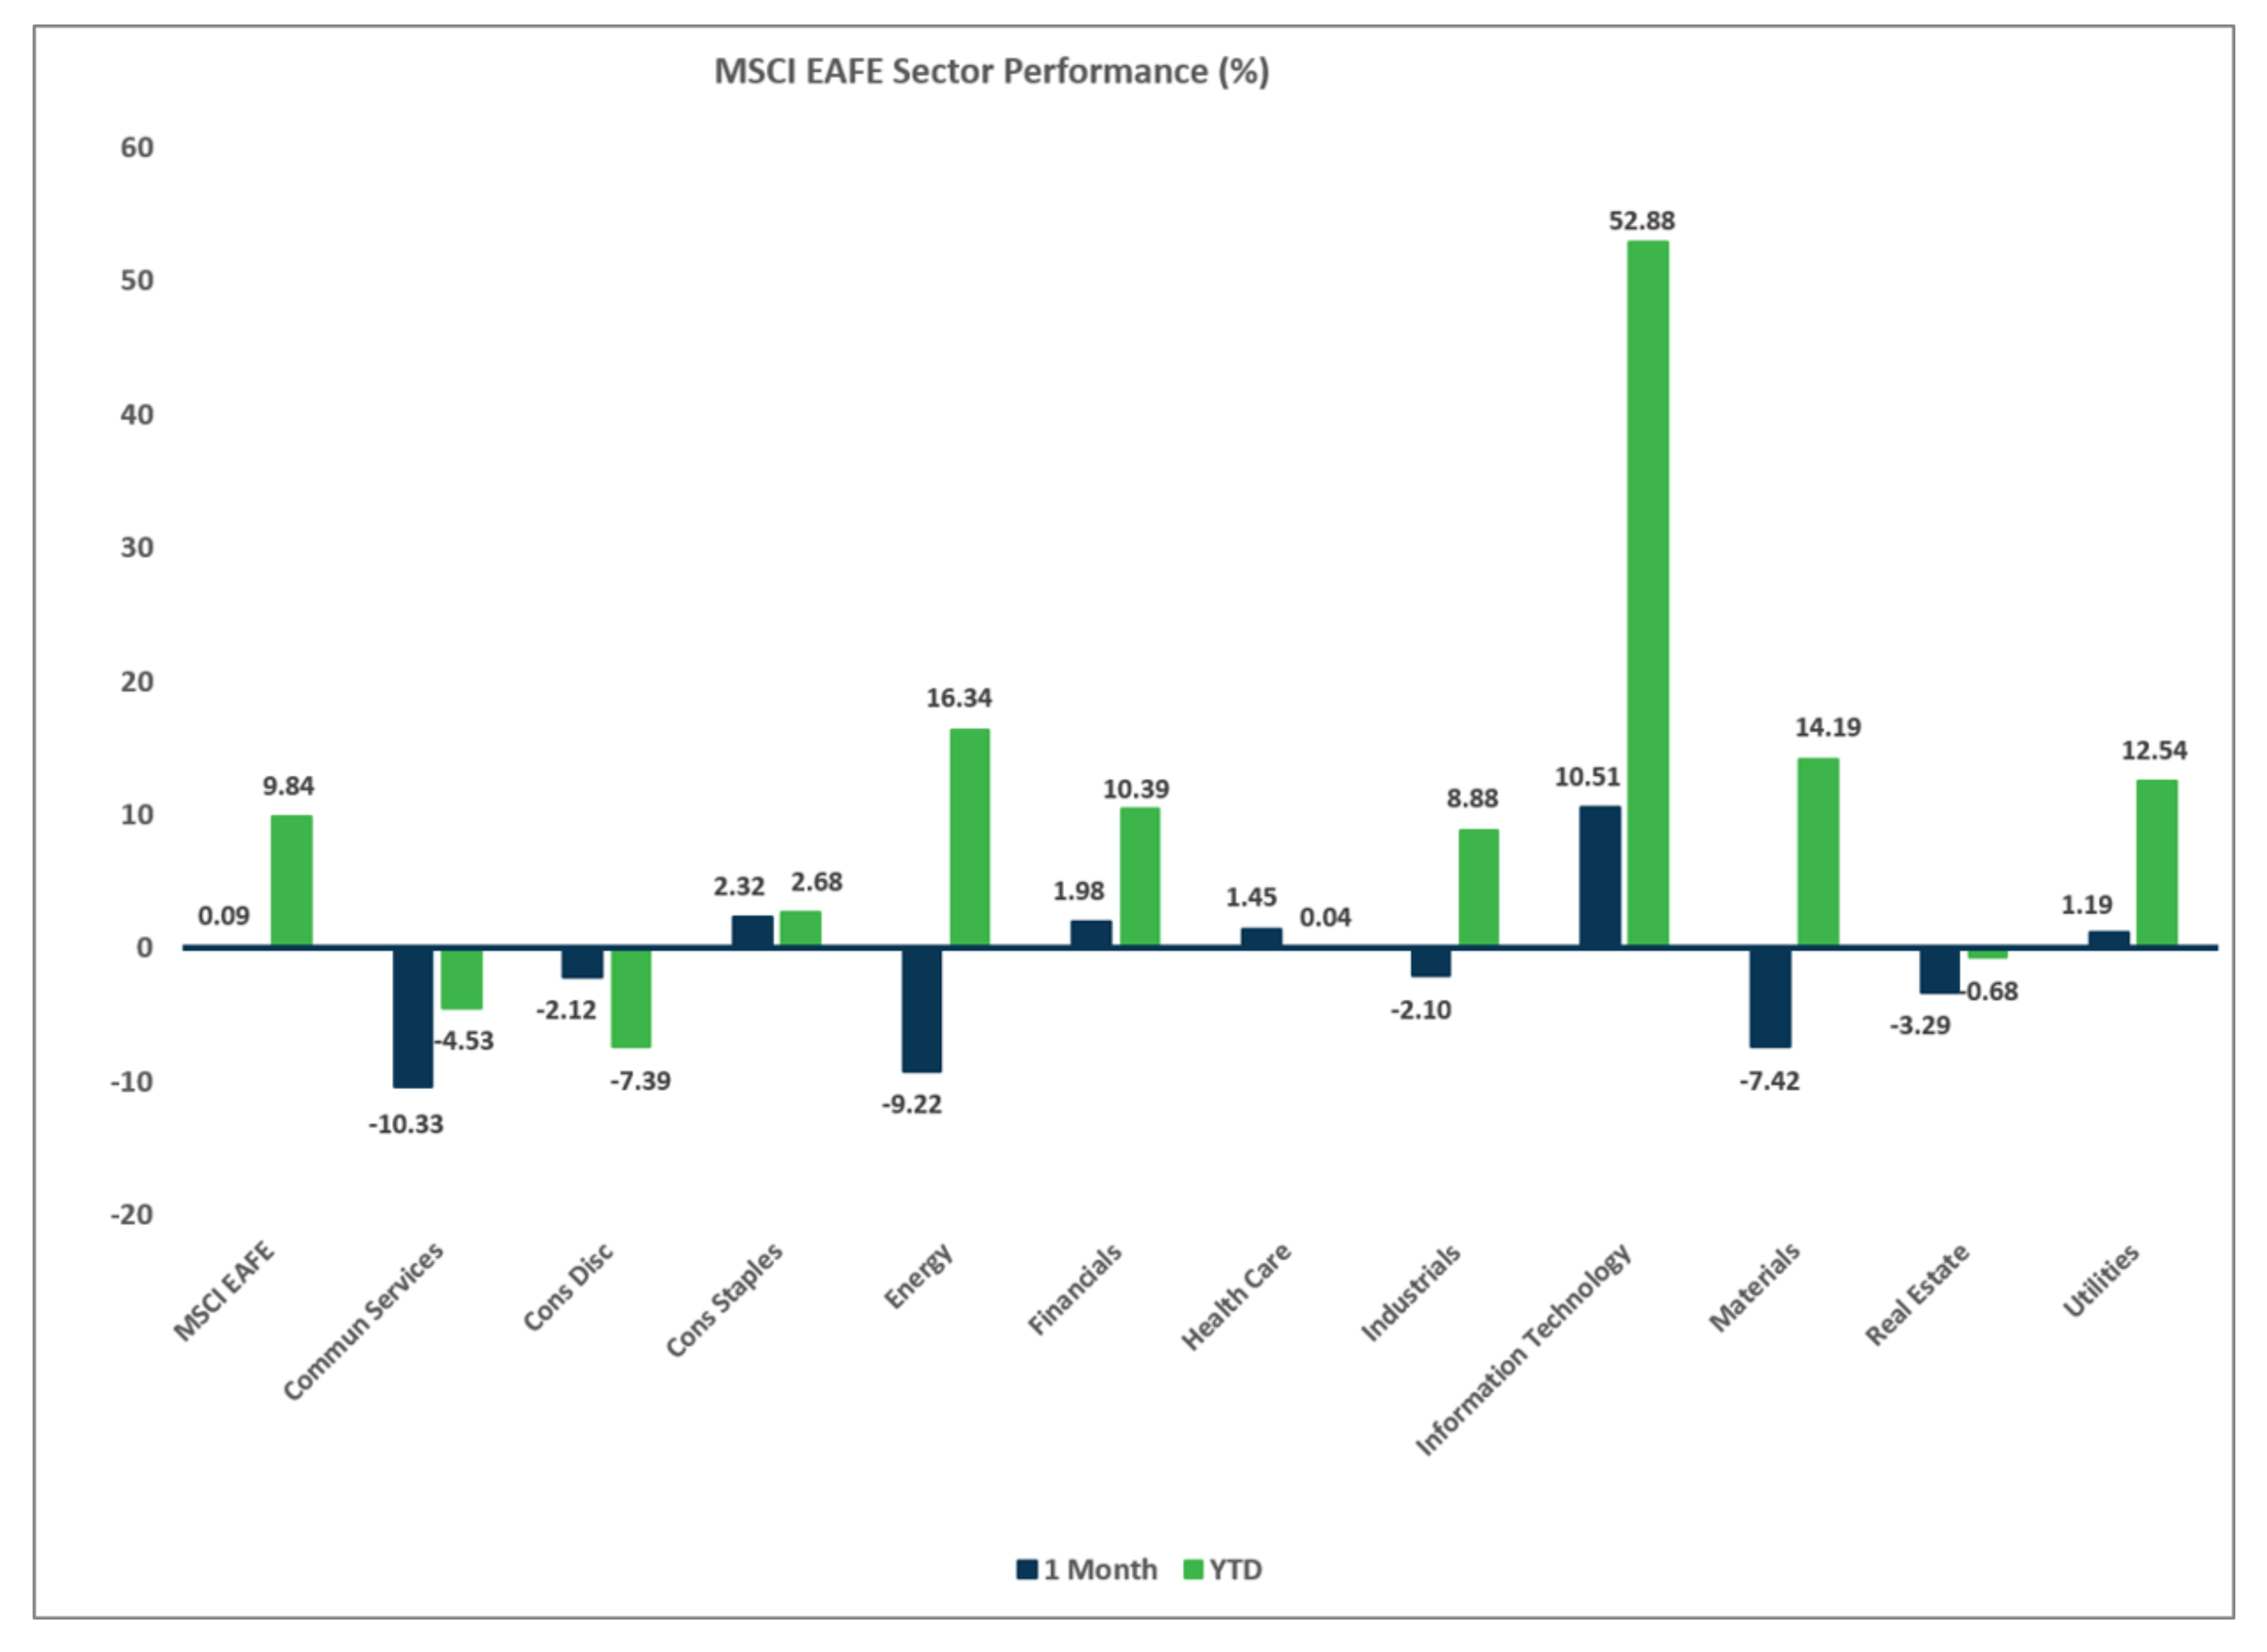
Sector Performance – MSCI EAFE (as of 6/30/26)
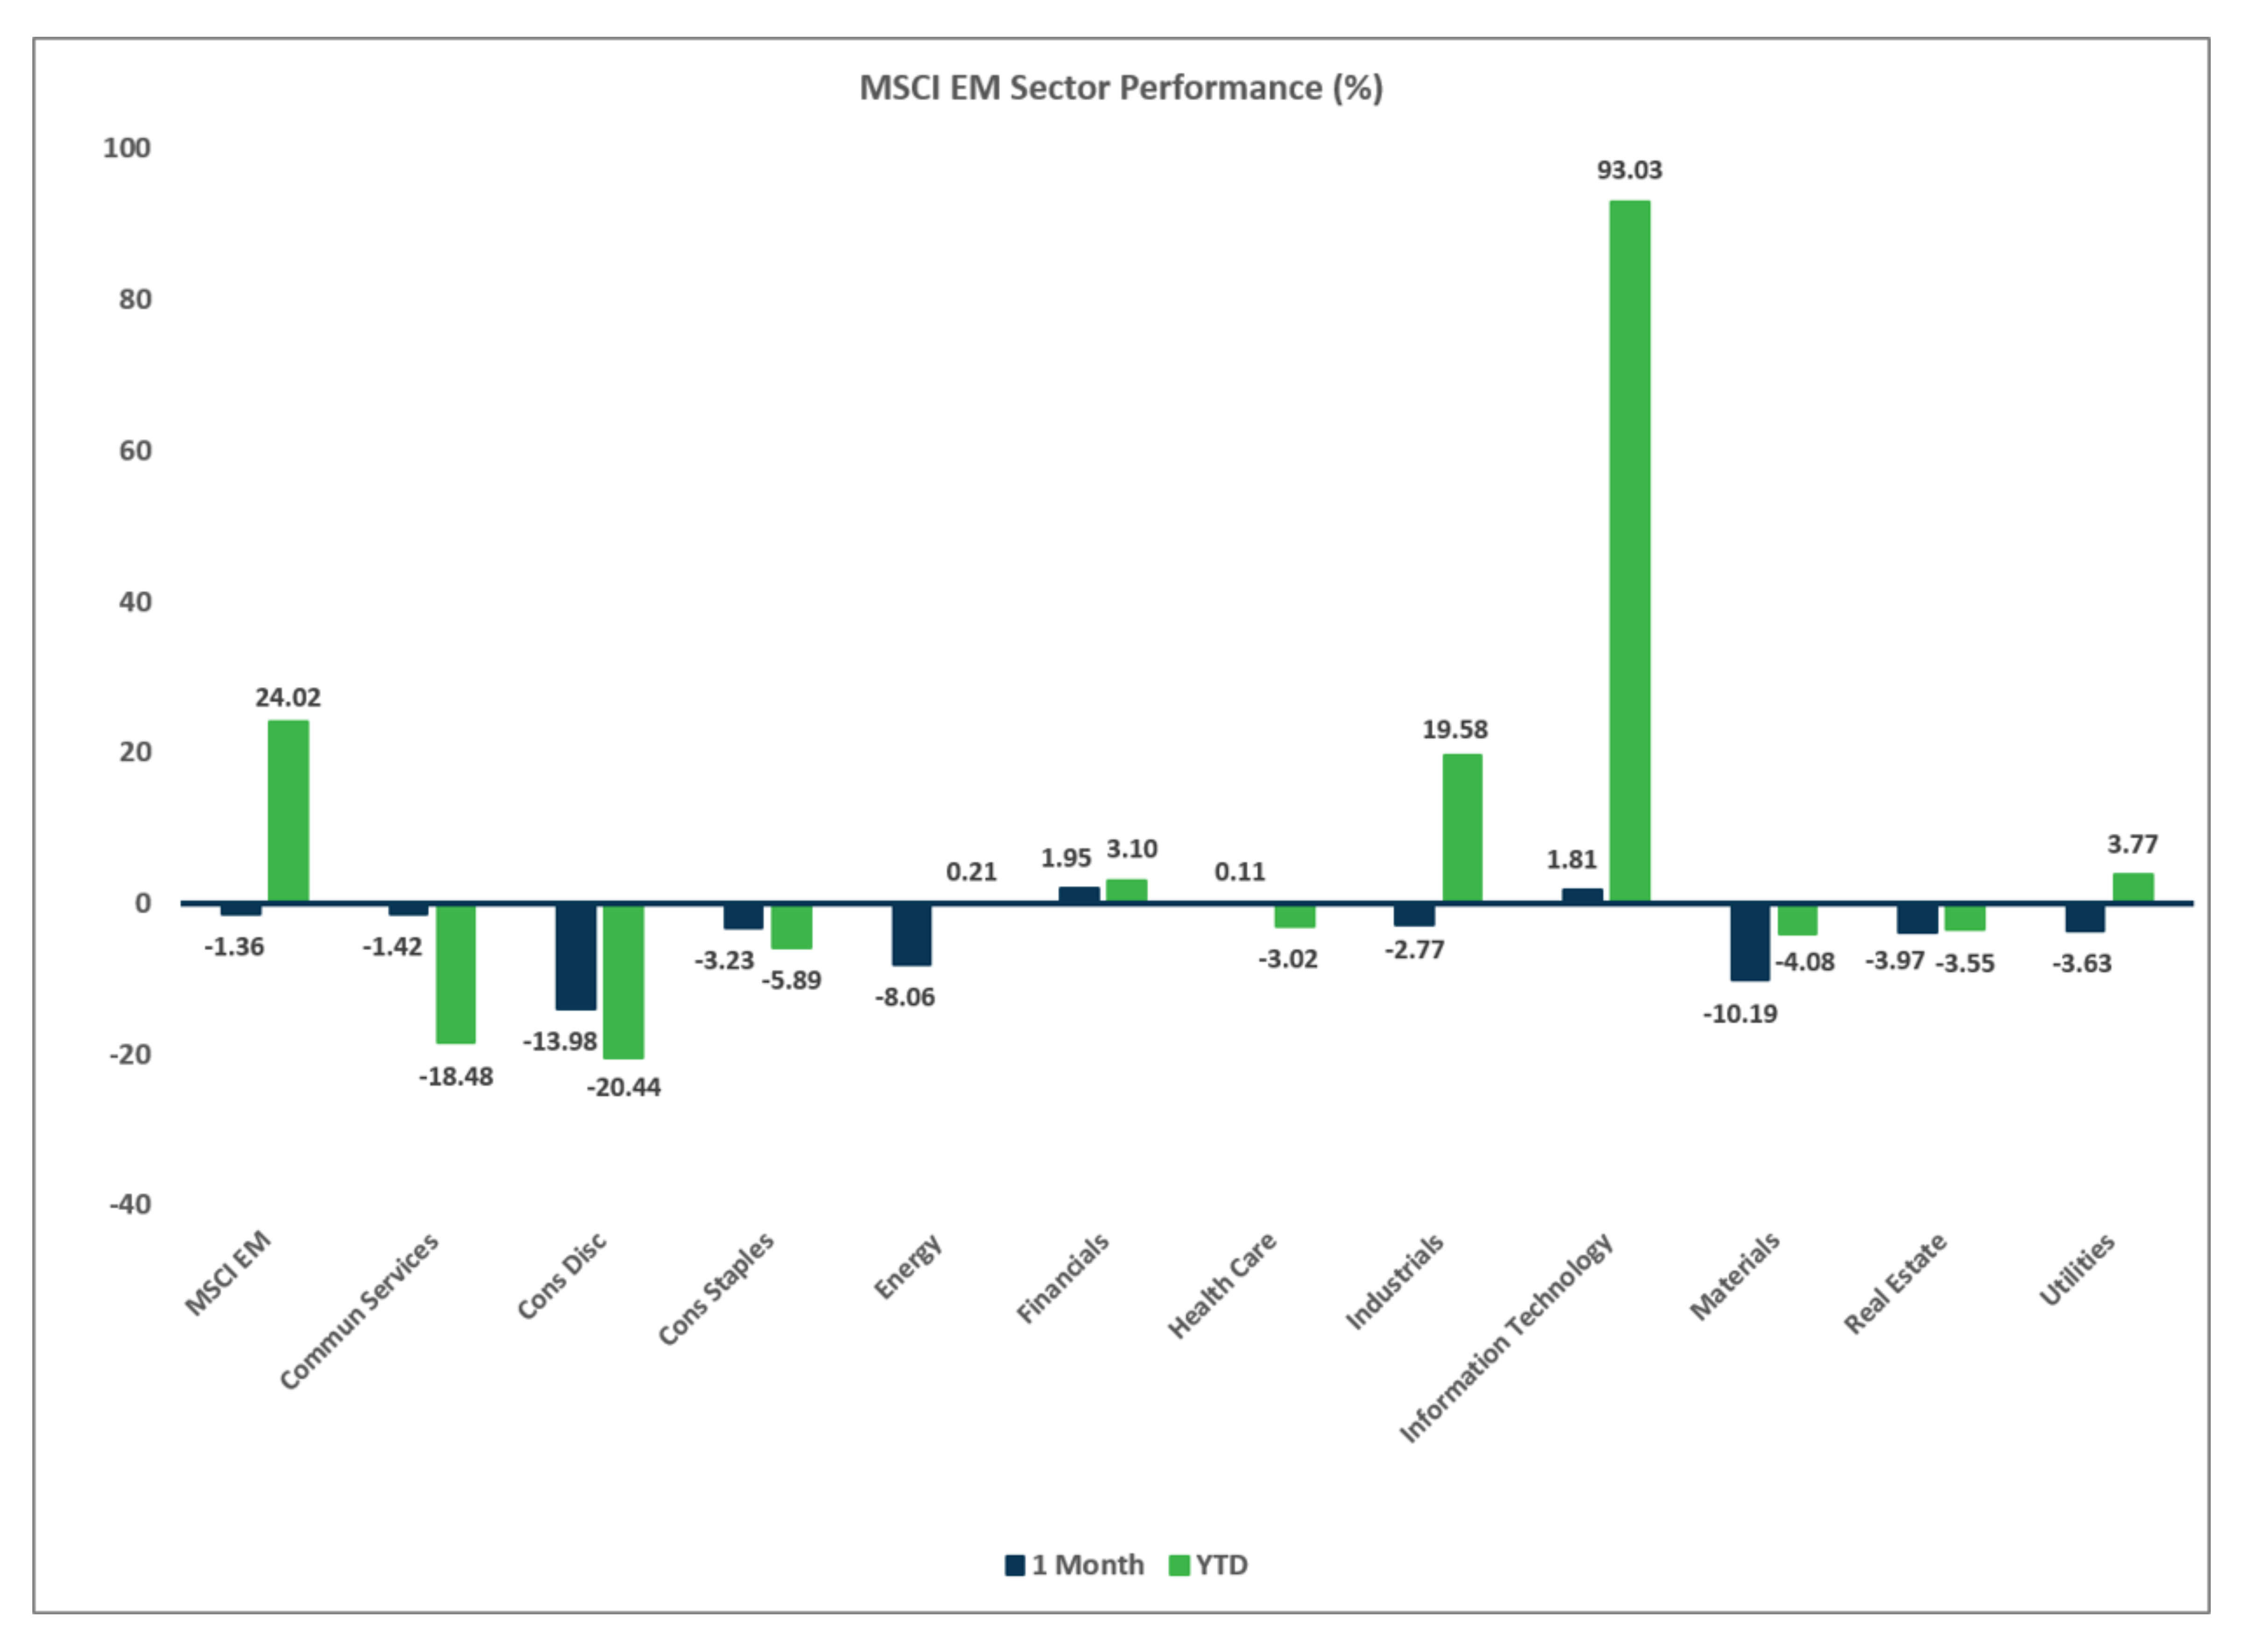
Sector Performance – MSCI EM (as of 6/30/26)
Disclosures
Investment services offered by Enterprise Bank & Trust are not deposits, obligations, or guaranteed by the bank or its affiliates. The information provided represents the opinions of Enterprise Bank & Trust and is not intended to forecast future events or guarantee future results. Past performance does not guarantee future returns. This information is for educational purposes only. Investors should consult with their investment professionals for advice concerning their particular situation.
Investments are: *Not FDIC insured *May lose value *Not financial institution guaranteed *Not a deposit *Not insured by any federal government agency.

