
Capital Markets Playbook | Q4 2025

2025 Q3 Summary
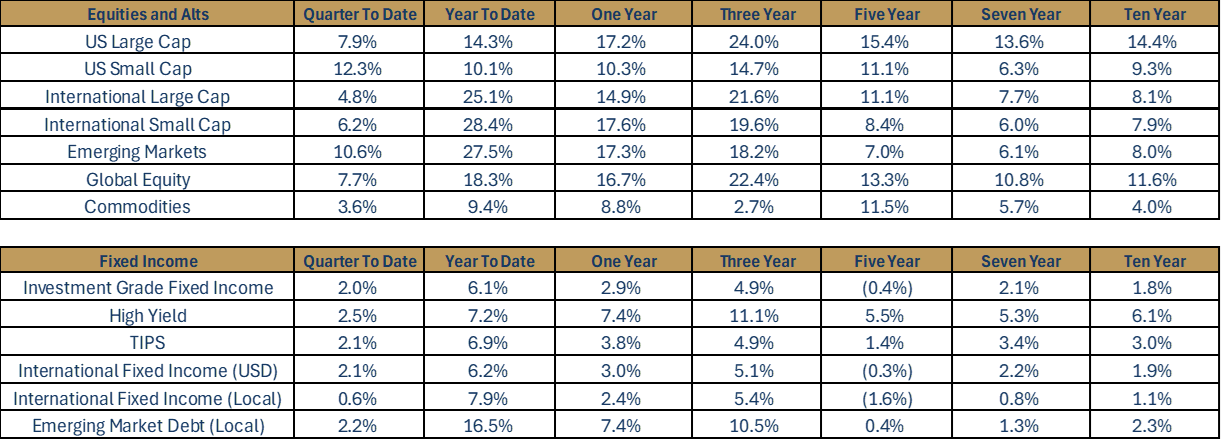
- Global equity markets continued to move higher through the third quarter of 2025.
- Major U.S. large cap stock indices posted gains in Q3 (+7.9%) and finished at, or near, all-time highs.
- Despite outperforming international and emerging market (EM) equities in Q3, however, U.S. large cap stocks have greatly underperformed foreign stocks in 2025.
- U.S. small cap stocks outperformed U.S. large cap stocks, posting strong gains in Q3 (+12.3%). Despite the recent strength, however, U.S. small cap stocks have meaningfully underperformed most equity asset classes in 2025.
- Broad-based fixed income markets were positive in the third quarter of 2025.
- All major fixed income asset classes have significantly outperformed cash in 2025.
- Riskier fixed income asset classes (ex: high yield, EM debt) have outperformed more conservative fixed income assets classes in 2025 (ex: Treasuries, investment grade fixed income).
2025 Q3: In Review
Update on Tariffs and Trade Deals
- Further progress on trade deals continued during the quarter as the U.S. announced deals with larger trade partners, including Japan and the European Union.
- The U.S. and China extended the pause on reciprocal tariffs by another 90 days through November 10. Despite these pauses, it is likely that U.S. tariffs on Chinese exports will remain much higher than those imposed on the rest of the world.
- It is unknown whether the reciprocal tariffs that the U.S. placed on goods imported from abroad will be ruled illegal by the U.S. Supreme Court. As of now, tariffs will remain in place as the case awaits Supreme Court appeal ruling. Even if the Supreme Court confirms that the tariffs are illegal, it is likely that the U.S. explores other ways to implement tariffs. This ruling changes nothing in the short term for the Federal Reserve, as it continues to operate under the assumption that tariff policy will remain as it stands.
- Takeaways
- The fact of the matter remains that the magnitude and timing of any final trade agreements remain to be seen, and volatility may increase as deadlines draw near.
- The impact of tariffs on U.S. consumer prices continues to be muted to this point, with corporations absorbing the costs of tariffs more than consumers. Assuming a major escalation in trade protectionism does not occur, inflationary impacts from tariffs are expected to be short term and moderate in nature.
Macroeconomic Review
- Economic Growth
- Following volatile GDP prints during the first two quarters of 2025, economic growth in Q3 looks to be stronger than originally anticipated. Early GDP estimates for Q3 suggest that the U.S. economy could have grown by more than 3%.
- For the full year of 2025, GDP is expected to be slightly lower than the longer-term trend rate of 2%.
- Consumer Spending
- Consumer spending picked up during the third quarter, despite expectations for continued deceleration due to the impacts of tariffs.
- Data is not yet available, but most expect third quarter U.S. consumer spending to be slightly ahead of the longer-term trend growth rate of about 2.5%.
- Continued lack of clarity around tariffs and trade policy could cause consumer spending to slow in future quarters.
- Unemployment
- Unemployment, currently at 4.3%, moved up slightly during the quarter. Despite remaining below the long-term average, the Fed acknowledged that job gains have slowed and the unemployment rate has edged up. Weakening labor markets were a key factor in the Fed’s decision to lower rates in September.
- Inflation
- The inflationary impact of tariffs has yet to be fully reflected across the aggregate U.S. economy. In fact, Core CPI is approximately 0.2% lower than peak levels reported earlier this year.
- Most economists expect a moderate, temporary uptick in inflation in the months ahead as tariffs continue to filter into the aggregate economy. That said, assuming that new trade deals are announced soon, the prospect of a significant increase in inflation is rather remote.
- Interest Rates and Monetary Policy
- The Fed lowered interest rates to 4-4.25%, citing a weakening labor market despite sticky inflation. This marked the first rate cut since December 2024.
- Markets currently expect that the Fed may cut short-term interest rates by an additional 25-50 bps by the end of 2025. That said, if the labor market weakness subsides in the months ahead (and inflation does not decline), it is possible that the Fed decides to keep rates as they are for the rest of the calendar year.
- Partial Government Shutdown
- As of the end of Q3, Congress could not pass a spending bill to avoid a government shutdown. Government shutdowns are relatively common and tend to be resolved quickly. The longer the shutdown lasts, however, the more likely it becomes that consumer spending and economic growth slow noticeably.
Equity Market Review
- Since the April 8 market low, U.S. small cap equities have outperformed U.S. large cap equities by more than 4%, supported by expectations of a supportive interest rate environment and future earnings growth expectations.
- Large cap equities carried their momentum into Q3, notching 26 new all-time highs over the quarter, an average of two new highs every week.
- International equities trailed domestic equity quarterly returns due to headwinds from global macroeconomic policy and a stable U.S. dollar.
Fixed Income Market Review
- Despite pockets of policy-driven volatility, domestic fixed income has fared well year-to-date, buoyed by stable rates and a relatively unchanged short-term inflation outlook.
- High yield once again outperformed investment grade fixed income in Q3 by approximately 50 bps. In Q3, high yield benefited from the same “risk on” sentiment seen in global equity markets.
- Thanks to a meaningful weakening of the U.S. dollar this year, international fixed income (local currency) has posted very strong returns in the first three quarters of 2025. With year-to-date returns of +7.9% thus far, it is one of the highest for the asset class in nearly three decades.
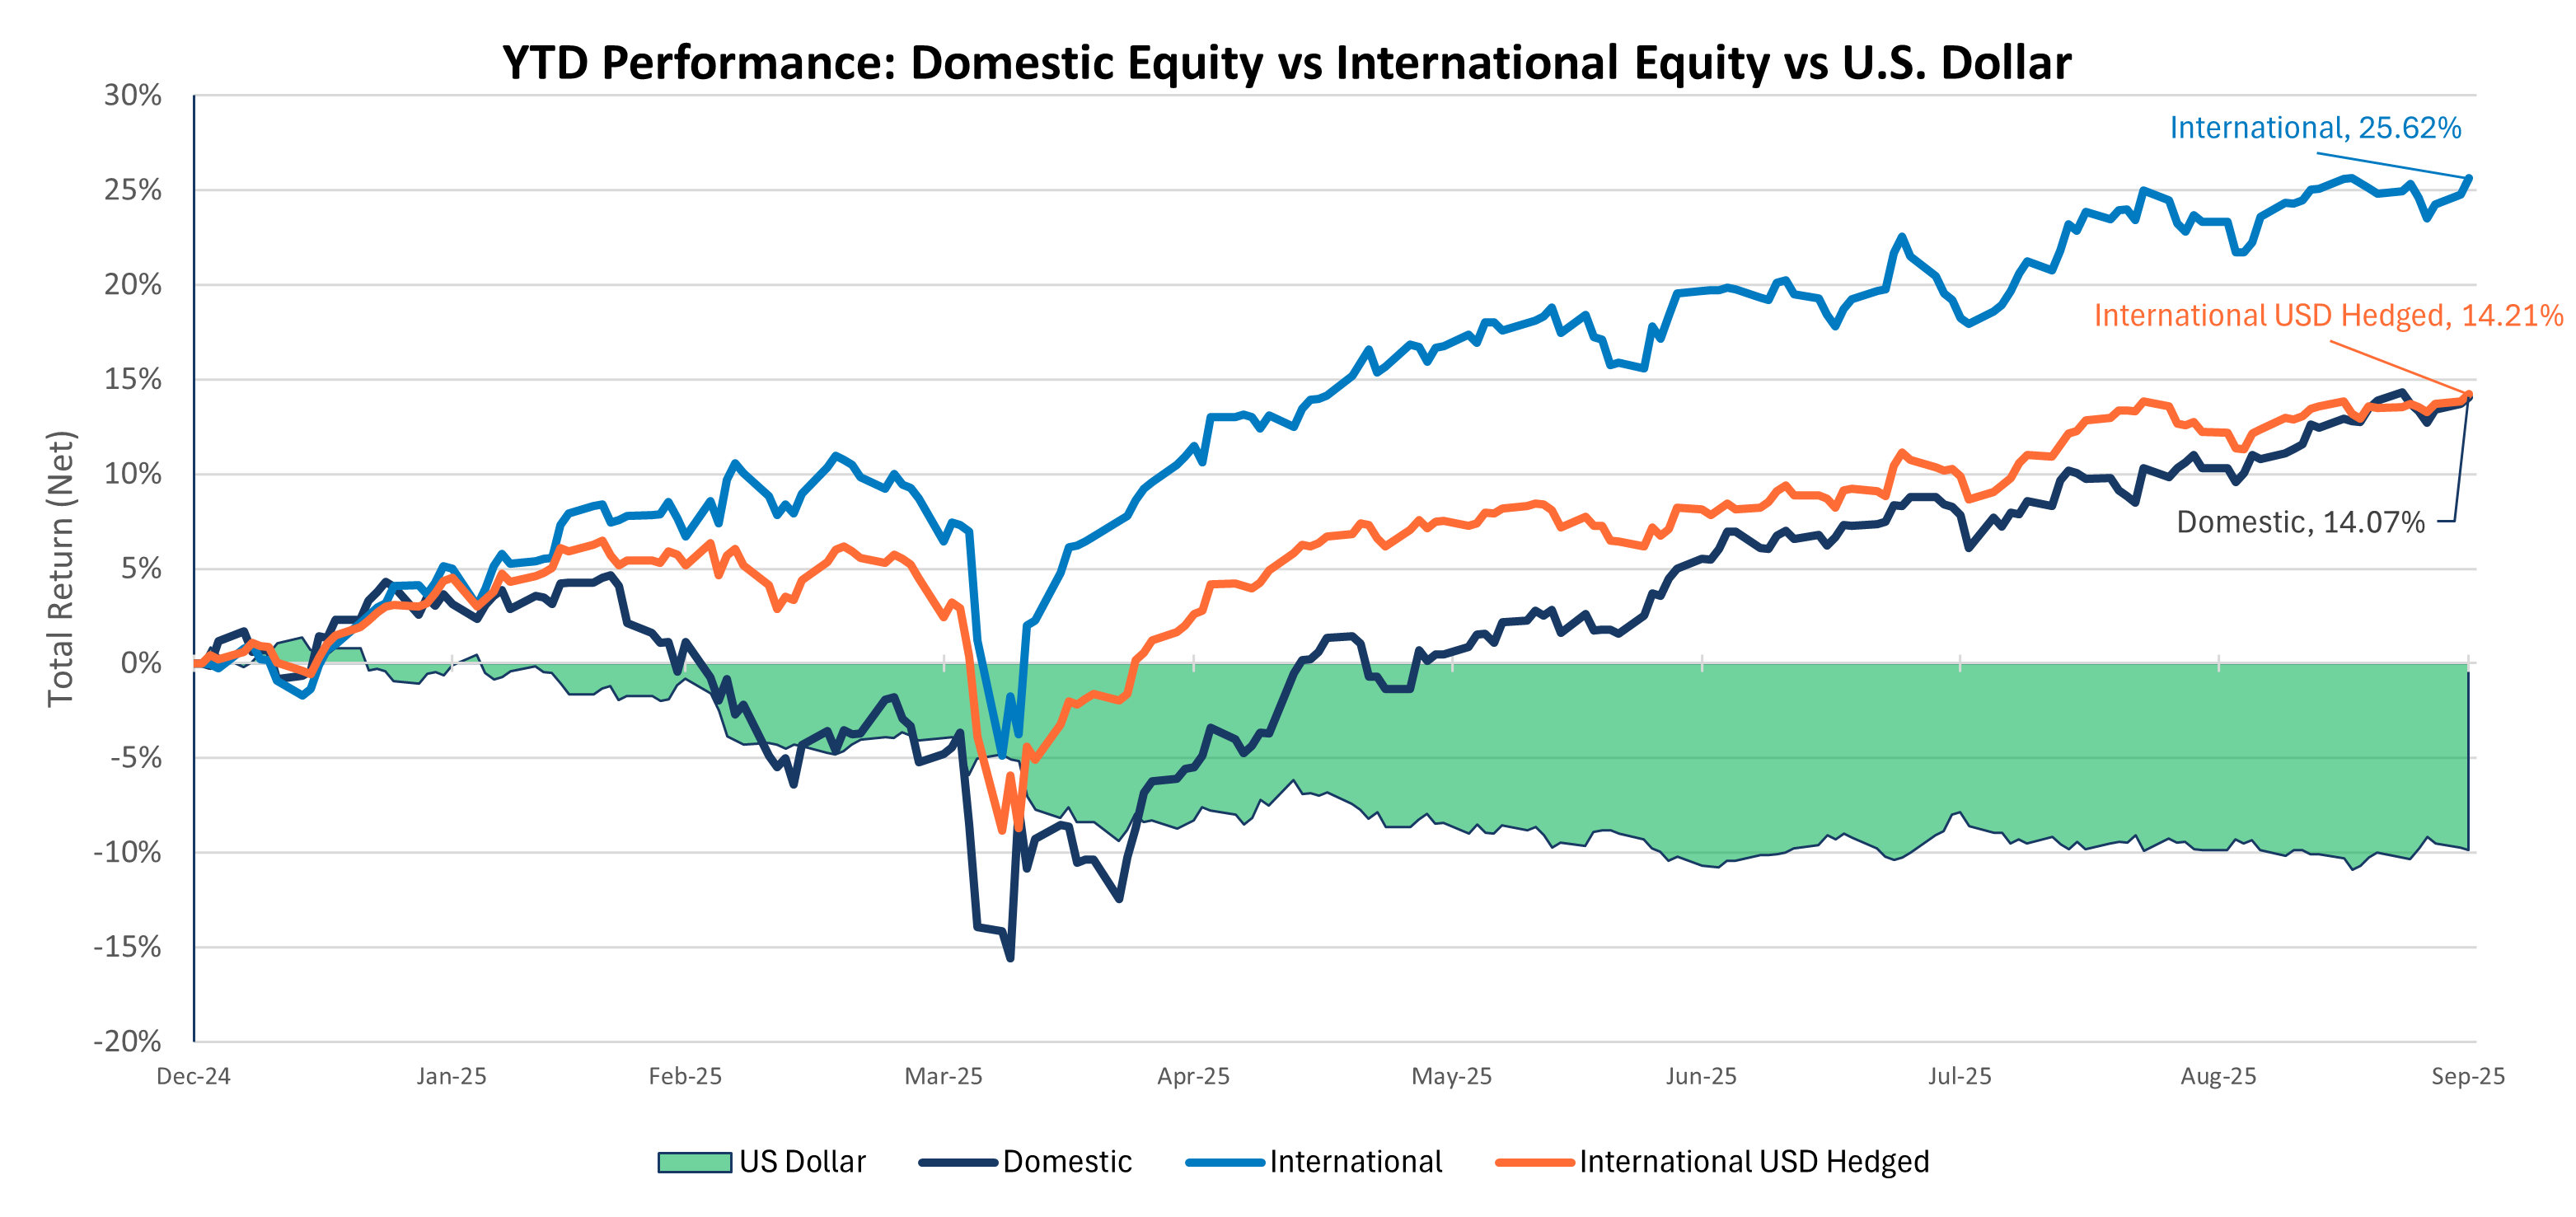
- International equities gained in Q3, advancing on fundamentals and valuations rather than currency tailwinds as the U.S. dollar held stable.
- The weakening U.S. dollar has provided a significant tailwind for domestic investors year-to-date, amplifying their returns in international markets.
- The U.S. Dollar Index (DXY) recorded its sharpest first half decline in nearly 40 years, contributing to a notable divergence in year-to-date asset class performance.
- While interest rate differentials and inflation typically influence currency movements, the year-to-date dollar weakness appears more closely tied to concerns over U.S. fiscal sustainability, growing uncertainty around trade policy, and interest rate differentials with other developed markets.
2025: Macroeconomic Expectations
- Unemployment “Base Case”
- Unemployment remains low relative to historical standards and is expected to finish the year at, or near, current levels of 4.3%.
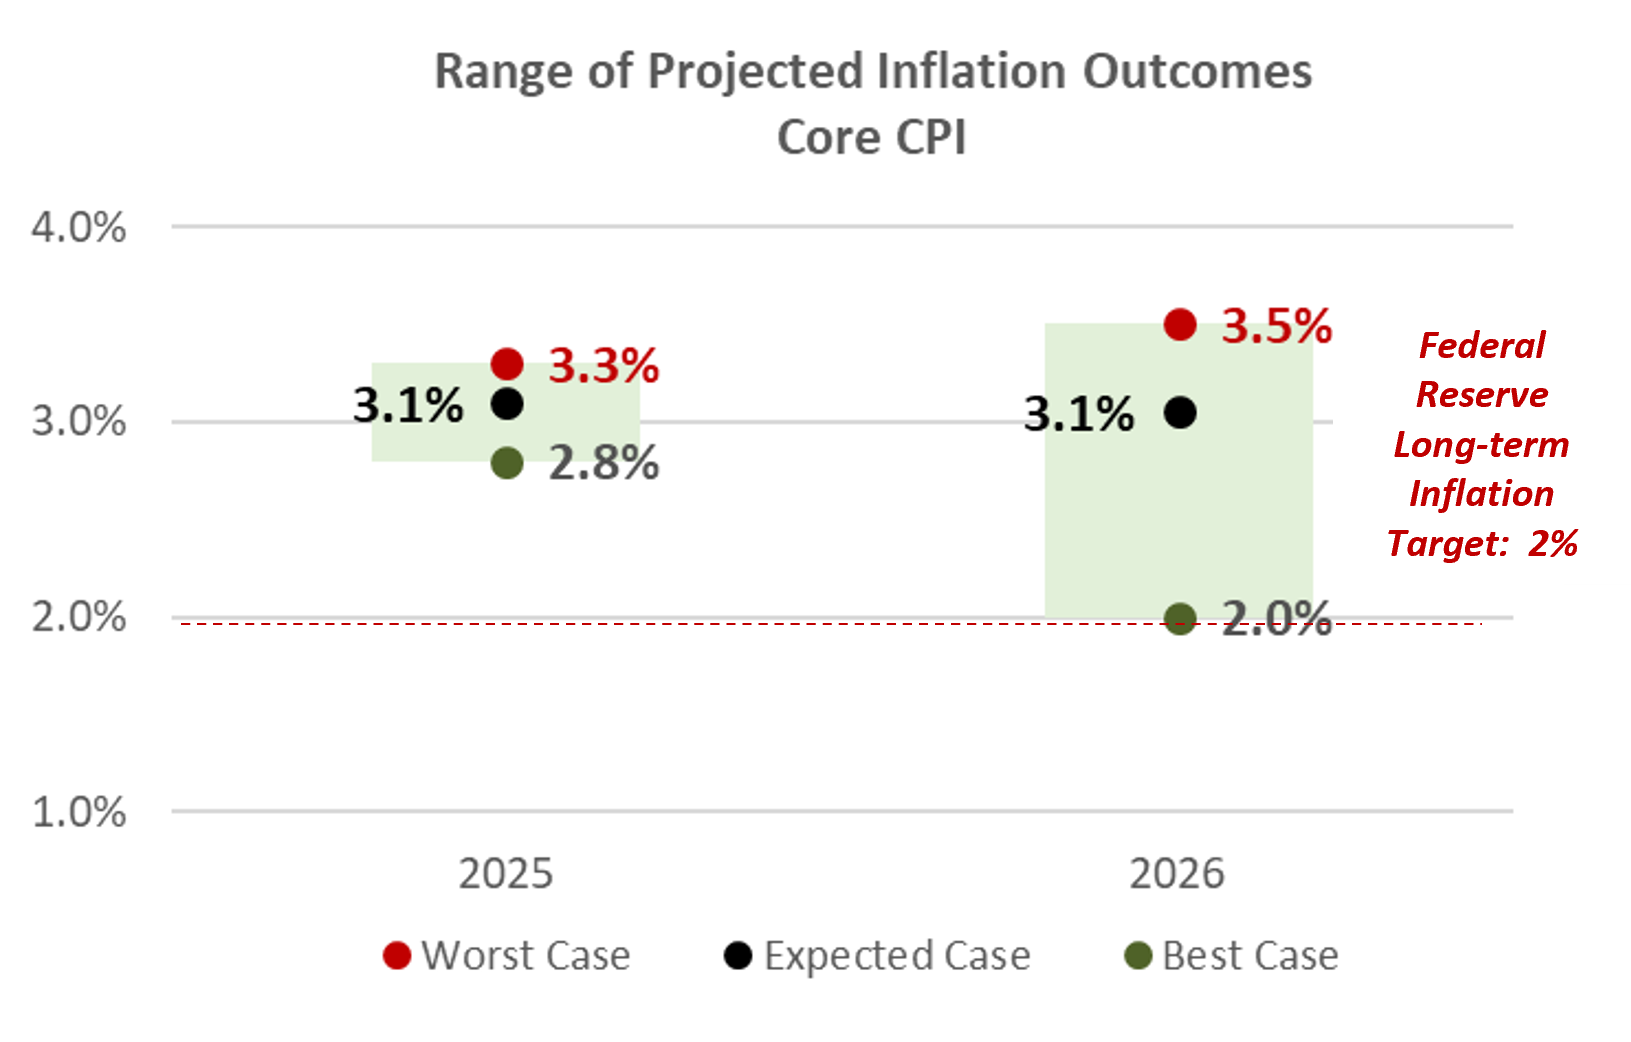
- Inflation “Base Case”
- Inflation is expected to increase slightly as impacts from tariffs flow through the economy, keeping inflation levels above the Fed’s 2% target in 2025.
- Personal Consumption Expenditure (PCE) inflation – the Fed’s preferred measure of inflation – is expected to increase from 2.9% to about 3.1% by the end of 2025.
- Inflation is expected to increase slightly as impacts from tariffs flow through the economy, keeping inflation levels above the Fed’s 2% target in 2025.
- Interest Rates “Base Case”
- The slope of the U.S. Treasury yield curve may steepen as the Fed makes monetary policy more accommodative.
- Short-term interest rates may be cut by as much as 50 bps before the end of 2025 if the Fed continues its monetary policy normalization effort.
- Intermediate and long-term interest rates may move higher in the months and quarters ahead, as markets weigh concerns over U.S. debt and deficits.
- The slope of the U.S. Treasury yield curve may steepen as the Fed makes monetary policy more accommodative.
- Risks to “Base Case” Expectations
- Unemployment risks
- Businesses that have avoided job cuts in 2025 due to a “wait-and-see” approach to policy matters may determine that they cannot wait any longer to cut costs.
- Inflation risks
- Tariffs on imported goods could push inflation higher, as their impact is still working its way into the economy.
- Interest rate risks
- Mounting concerns over U.S. debt and deficits could lead investors to demand higher yields (even if inflation is moving lower).
- Unemployment risks
- Takeaway
- Slightly higher unemployment, sticky inflation and restrictive short-term interest rates will make it challenging for the U.S. economy to grow at (or above) its long-term trend rate over the next several quarters.
2025 Expectations: Economic Growth
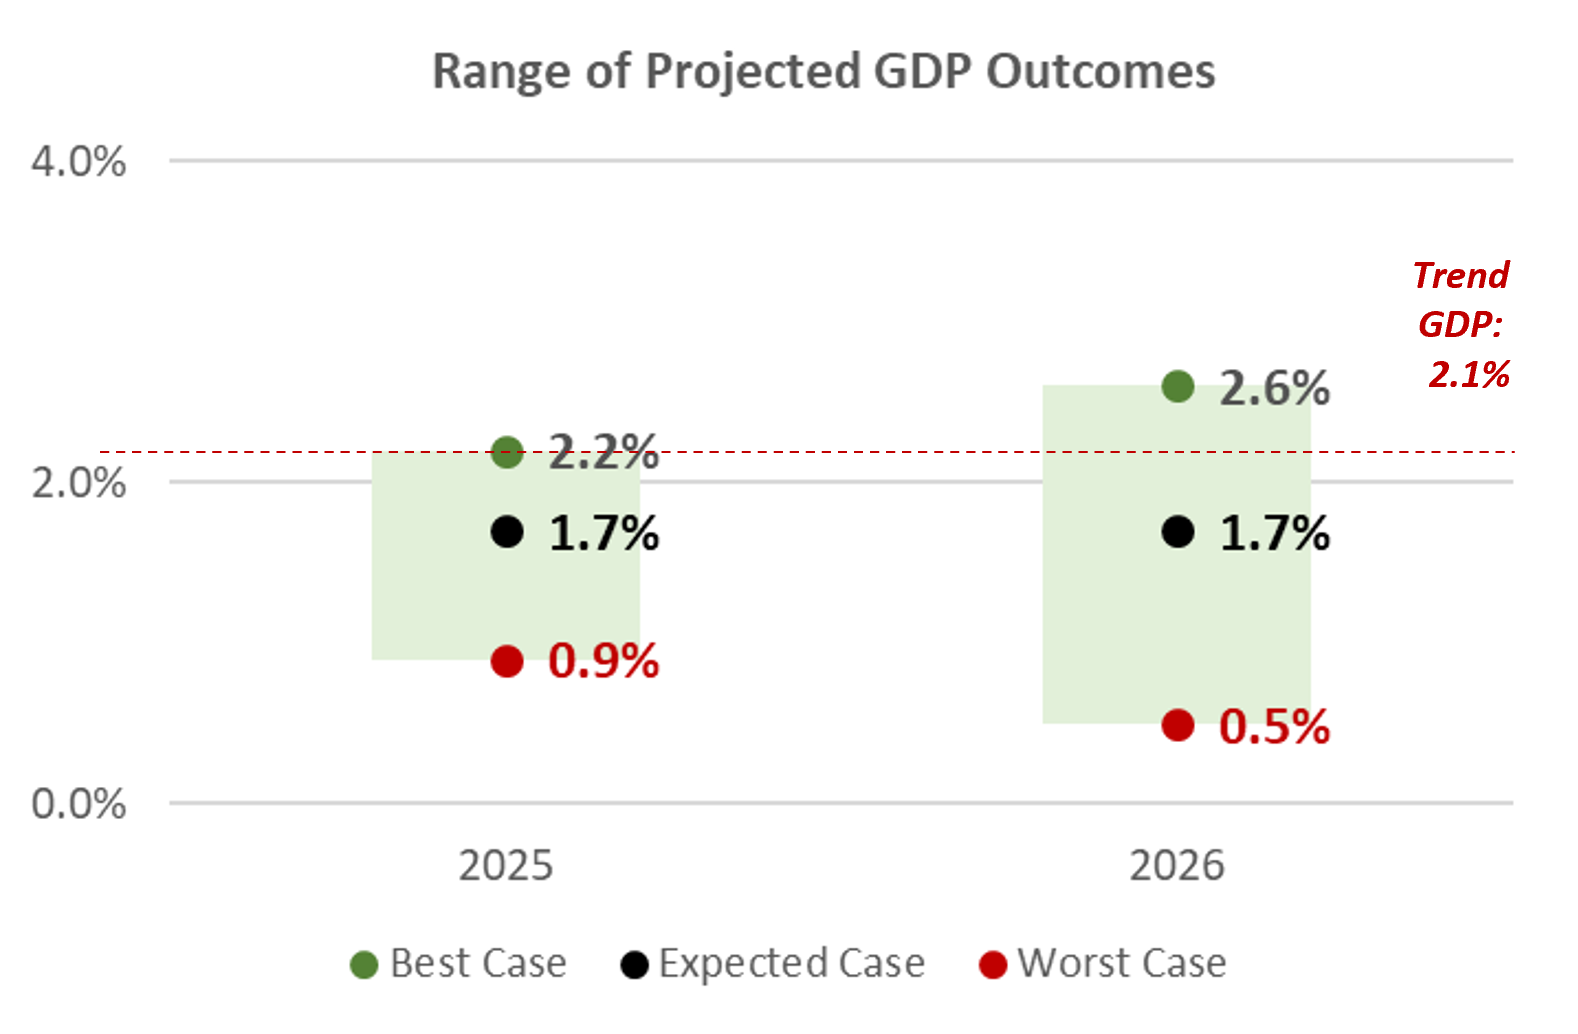
- U.S. economic growth is expected to slow throughout the remainder of 2025 and is expected to remain below trend levels through 2026.
- GDP growth for 2025 and 2026 is expected to come in below the long-term GDP trend rate of 2.1%.
- Despite expectations for slower economic growth, however, few expect an economic recession before the end of 2026.
- Scenarios
- Best Case
- Economic activity in the U.S. will come in at or slightly above its long-term trend rate over the next two years.
- Expected Case
- Economic activity in the U.S. is about 0.5% below its long-term growth rate over the next two years.
- Worst Case
- Economic activity is about 1.5% below its long-term trend rate over the next two years.
- Best Case
2025 Expectations: Unemployment
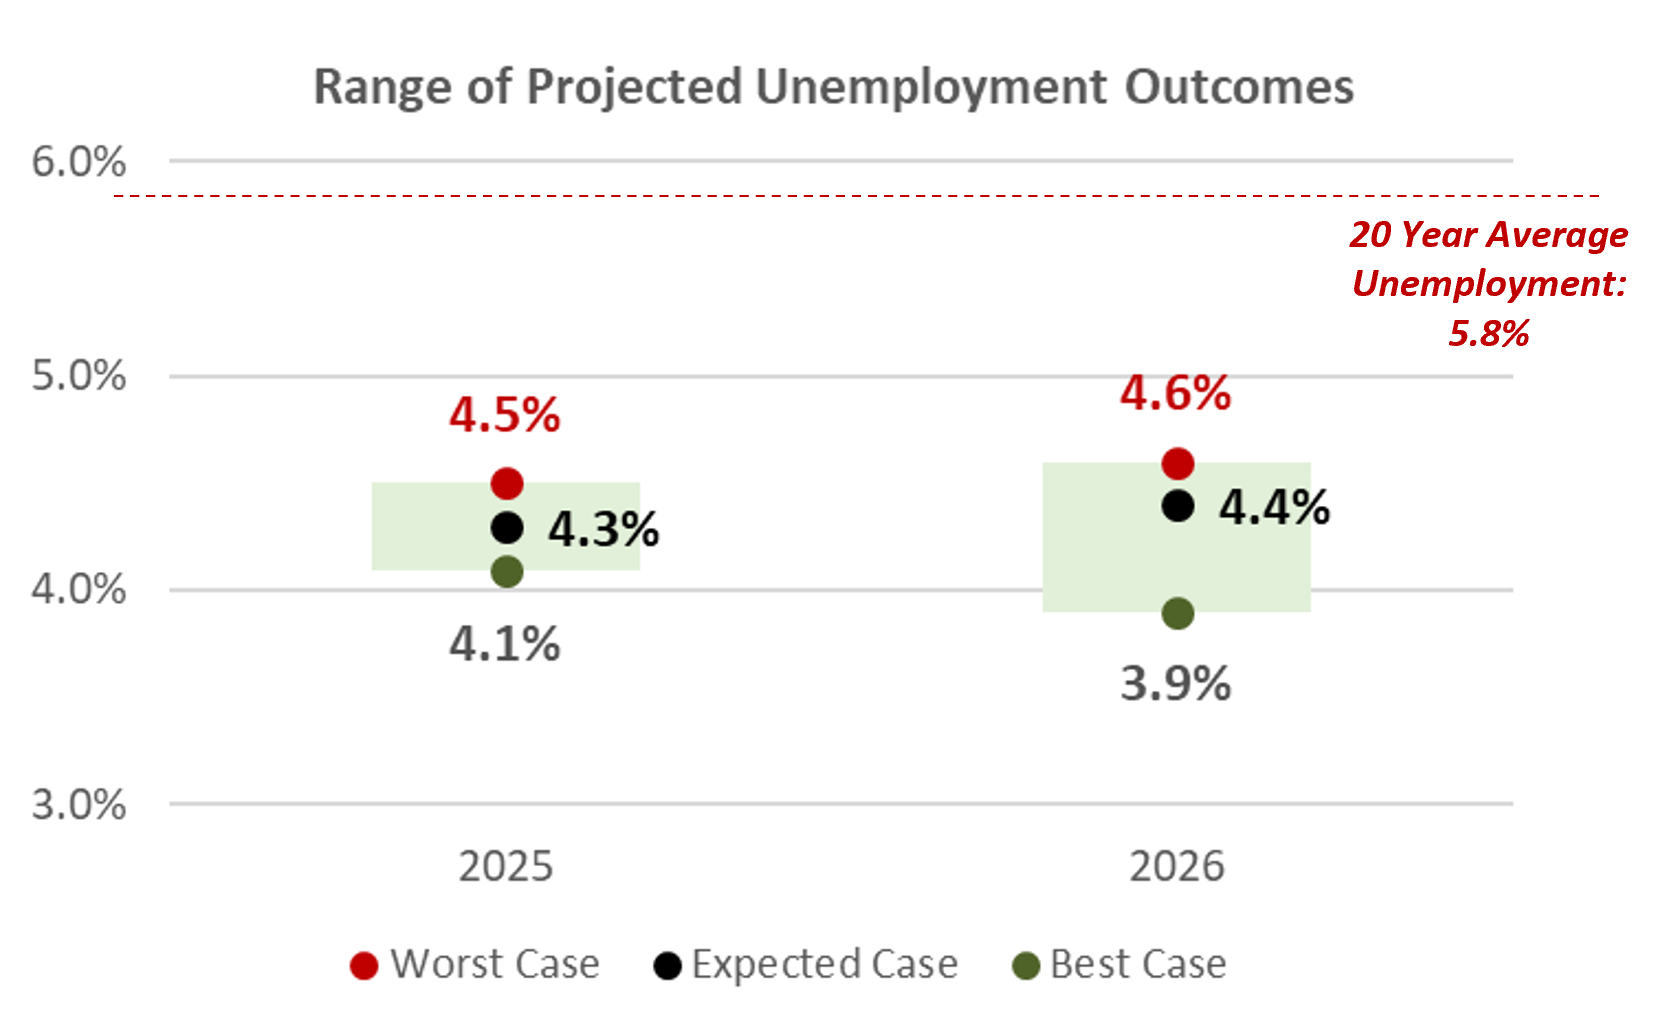
- Unemployment in the U.S., currently 4.3% as of the end of Q3, is expected to remain well below its long-term average through the end of 2026.
- Unemployment has ticked higher of late but remains low by historical standards.
- While few expect unemployment to increase meaningfully in 2026, the risk of a meaningful spike in unemployment cannot be ruled out.
- Scenarios
- Best Case
- Unemployment declines slightly from its current level and remains near historical lows over the next two years.
- Expected Case
- Unemployment remains largely unchanged as the U.S. economy grows, slightly below its longer-term trend rate.
- Worst Case
- Unemployment approaches 4.6% by the end of 2026 as a result of meaningfully slower economic growth.
- Best Case
2025 Expectations: Inflation
- Inflation has declined 20 bps from its peak earlier this year but is expected to increase marginally in the months ahead as tariffs begin to filter into the aggregate U.S. economy.
- Policy changes that may be inflationary in nature (ex: tariffs), may keep inflation stubbornly above the Fed’s inflation target in 2025.
- Assuming a major escalation in trade protectionism does not occur, inflationary impacts from tariffs are expected to be “short term” and “moderate” in nature.
- Inflation is expected to decline in 2026 but remain above the Fed’s 2% inflation target throughout the calendar year.
- Scenarios
- Best Case
- Inflation declines but remains about 0.5% higher than the Fed’s long-term inflation target by the end of 2026.
- Expected Case
- Inflation continues to moderate slowly and is about 1% higher than the Fed’s long-term inflation target by the end of 2026.
- Worst Case
- Inflation continues to be sticky throughout the aggregate economy and is nearly 2% higher than the Fed’s long-term inflation target through the end of 2026.
- Best Case
U.S. Equities and Rate Cuts
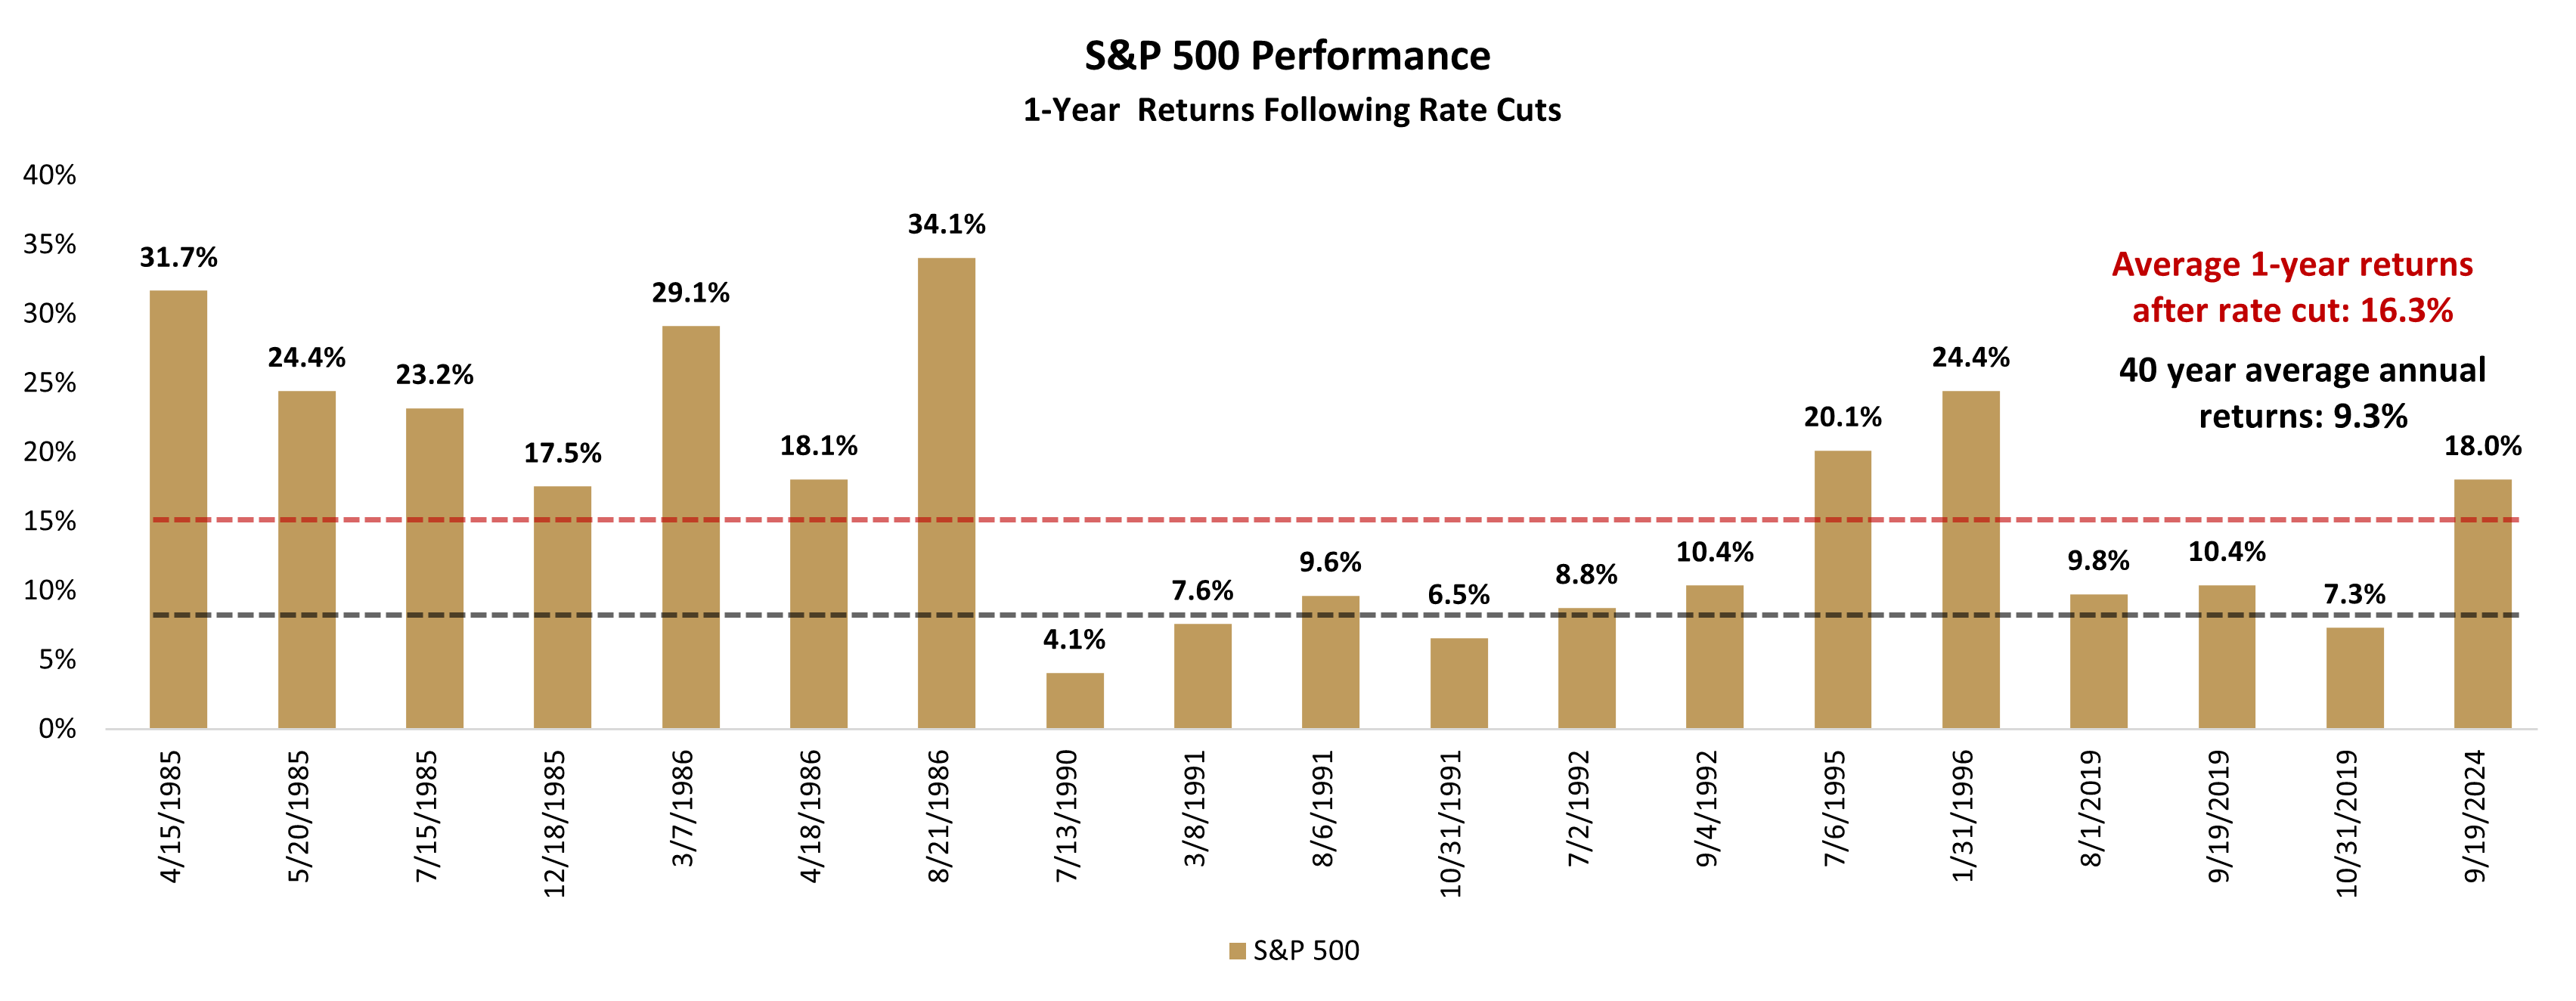
- Despite inflation remaining stubbornly above the Fed’s target, the Fed prioritized continued economic growth and the slowing job market by cutting the Fed Funds rate 25 bps to 4.00-4.25% on September 17. This was the first rate cut since December 2024. At the time, the S&P 500 was just below its all-time high.
- Since 1985, the Fed has cut rates while the S&P 500 was within 2% of an all-time high on 20 other occasions. In those instances, one-year forward returns averaged 16.3% versus an average annualized return of 9.3% over the time period. Rate cuts near market peaks have historically helped propel additional gains.
- It is important to remember that stock performance during easing cycles is highly dependent on the state of the economy. If the economy avoids a recession, rate cuts should act as a tailwind to increasing corporate investment and profits, which generally boosts returns.
- Takeaway:
- Even during times of strength, investors remain bullish on equities when the Fed is dovish, and the continued price strength is highly correlated with an expanding domestic economy.
- The market is anticipating the Fed to continue slowly easing rates to around 3-3.25% by the end of 2026.
- With the market actively pricing in these additional rate cuts, earnings growth aspirations have increased considerably.
- If these lofty expectations aren’t met, or if rates stay higher for longer, volatility would likely increase.
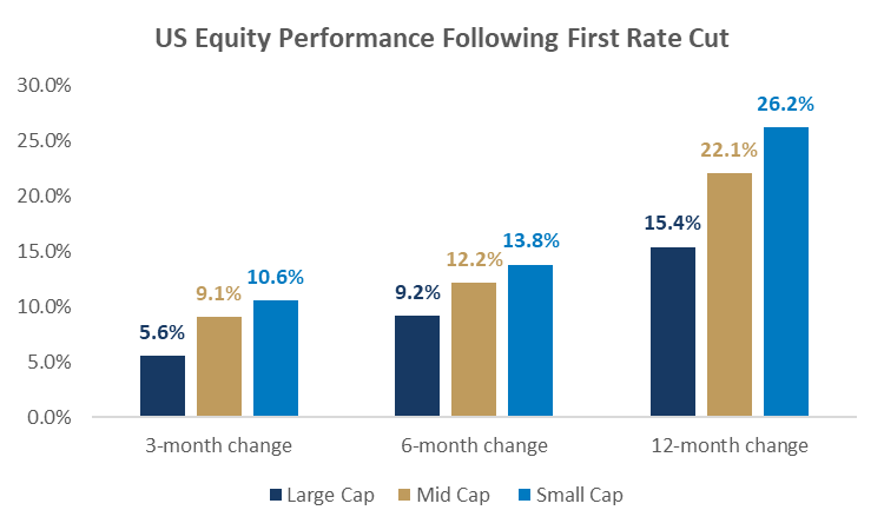
- Small caps have historically been the strongest beneficiaries of Fed rate cuts, absent a recession, and forward returns were weaker.
- The 75 bps in cuts in 2024 did not spur small cap outperformance, as interest rates remained at elevated levels and restrictive overall.
- Further economic easing to stimulate growth could be bullish for small caps, especially as they are most sensitive to borrowing costs.
- As the yield curve steepens with short-term rates falling, many mature or cyclical sectors often associated with value stocks tend to outperform their growth counterparts.
- Takeaways
- Volatility is a normal occurrence in the business cycle and can represent opportunity for outsized returns.
- A slight overweight to value stocks relative to growth and increasing weight to small cap equities may be prudent.
2025 Potential Policy Changes: Corporate Income Tax Reform
- The One Big Beautiful Bill Act delivers U.S. corporate income tax reform that should serve as a tailwind to boost corporate earnings growth over the short term, as the 21% corporate tax rate could fall to as low as an effective 12% rate – the lowest in U.S. history.
- In addition to increased profit margins, this lower corporate tax burden is likely to support increased capital spending across a number of domestic sectors, as well as the ability to return more value to shareholders via higher dividends and stock buybacks.
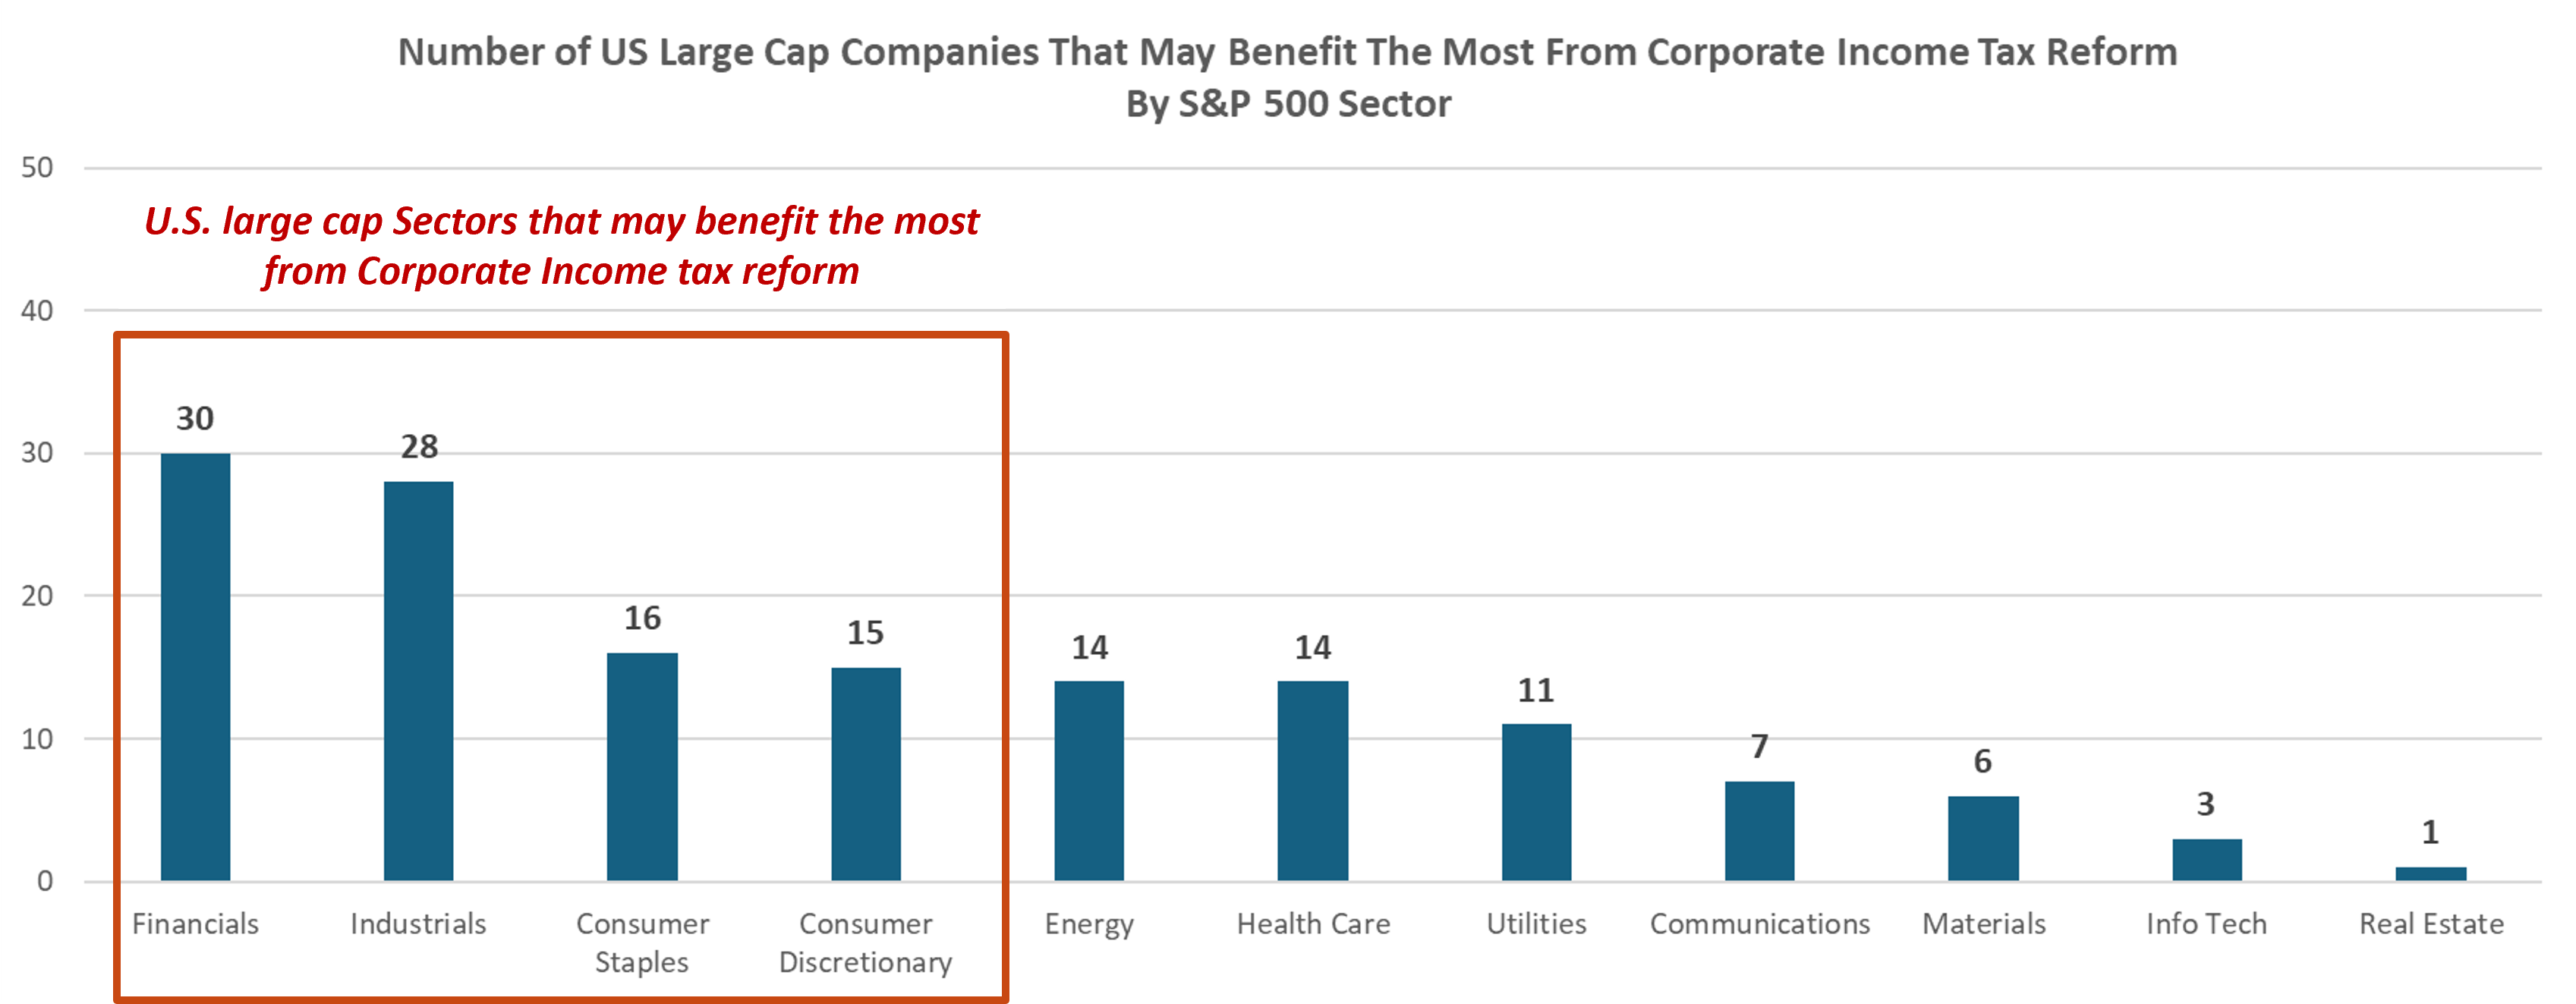
- Firms that pay higher effective income tax rates (above 15%) and produce more than 80% of annual revenue in the U.S. stand to benefit the most. Firms that generate more revenue overseas (or already have low effective tax rates) may see little benefit.
- Provisions in The Act also raise interest deduction limits and the permanent allowance of immediate expensing for research and development and short-lived assets. These provisions will serve to increase company cash flows leading to a potential boon for M&A activity.
- Takeaway
- Firms within Financials, Industrials, Consumer Staples and Consumer Discretionary may benefit the most from corporate income tax reform.
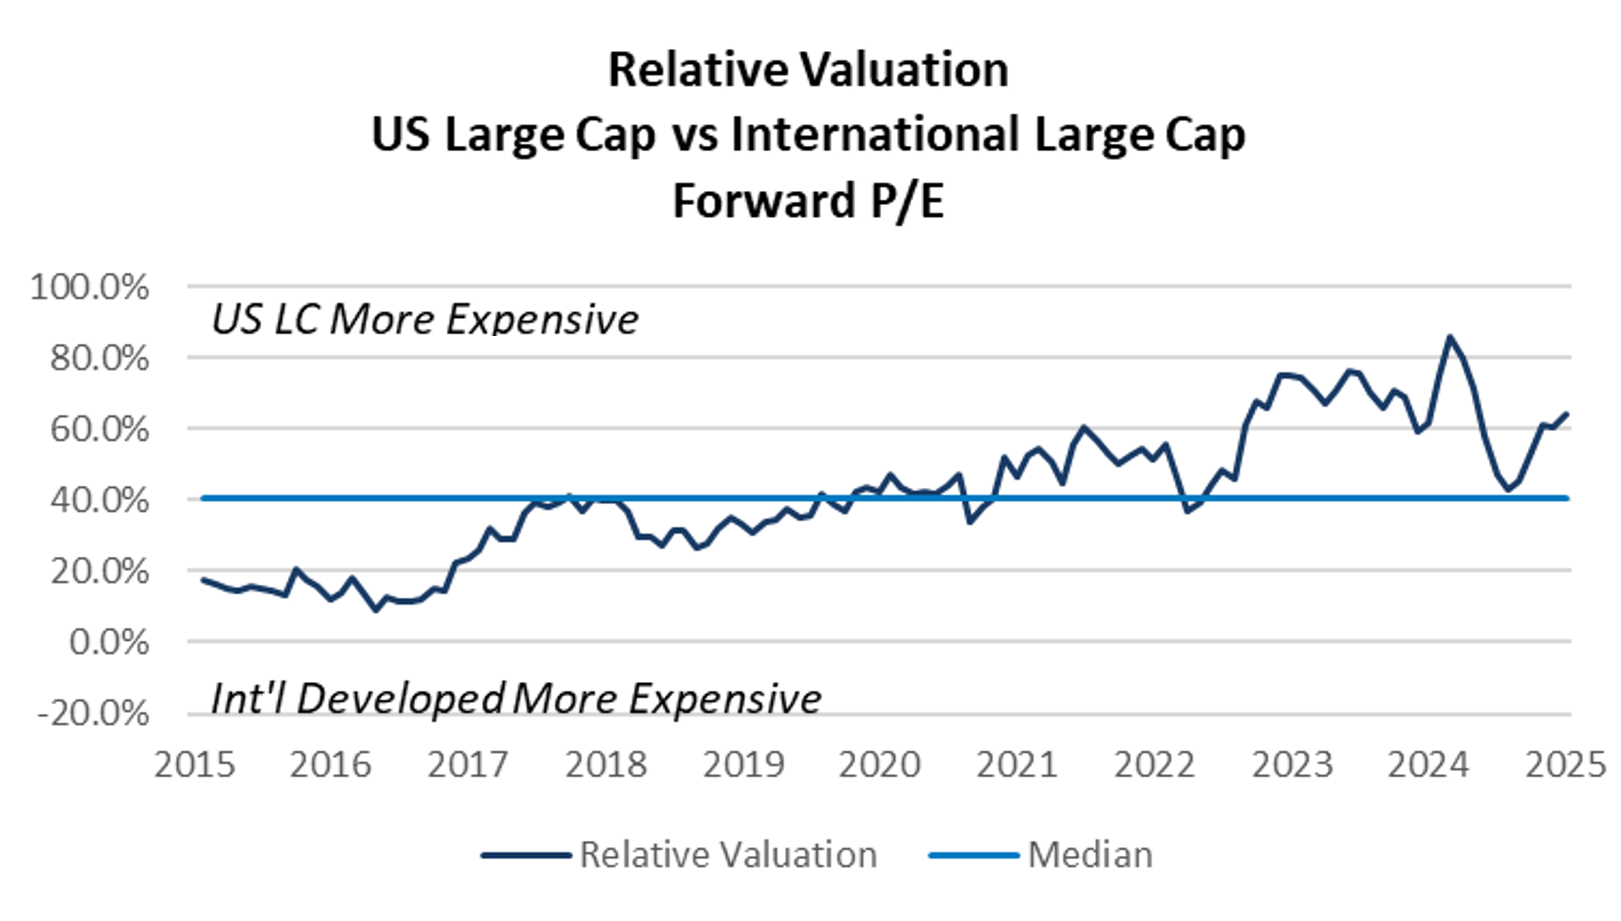
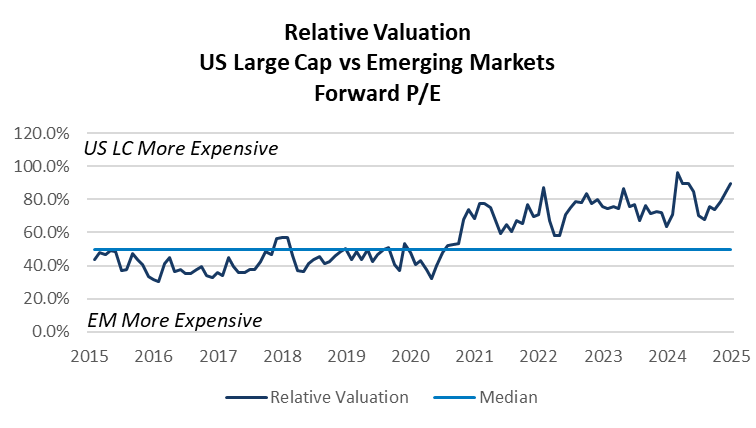
Relative Valuations: U.S. Large Cap Comparison
- Despite recent outperformance by equities outside the U.S., fundamental valuation metrics suggest that U.S. equities are still “expensive” on a relative basis.
- Relative valuations for U.S. large cap stocks remain above their 10-year average.
- International and EM equities rallied to start the year while U.S. large caps have not kept up, helping to close the valuation gap.
- Economic consideration
- Despite its recent weakening, the U.S. Dollar value (as measured by DXY index levels) remains elevated relative to historical standards.
- Caution should be exercised regarding uncertainty around tariffs and trade wars. EM equities are highly vulnerable to tariffs and multinational firms dependent on global supply chains could experience increased volatility.
- Takeaway
- Diversification outside the U.S. is prudent and we recommend investors have an allocation to international equity and EM equity.
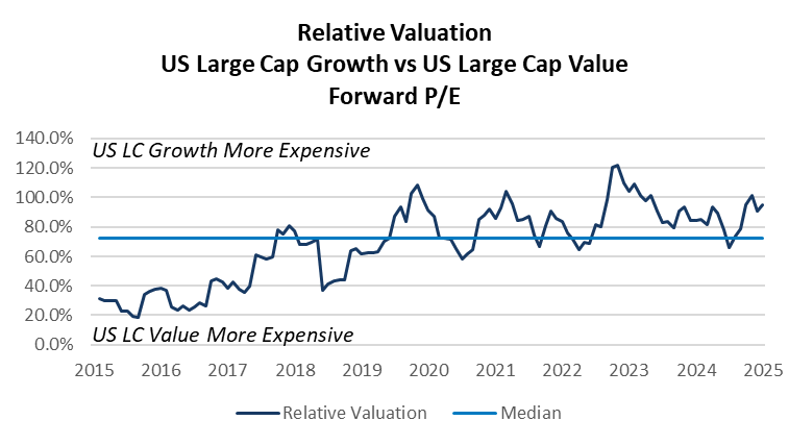
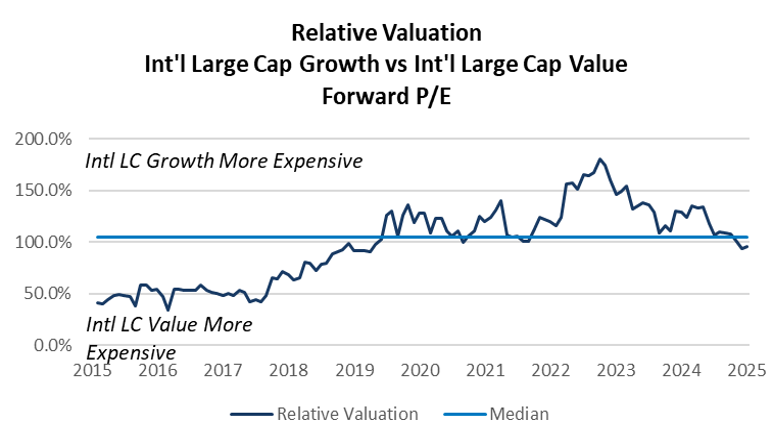
Relative Valuations: Growth vs. Value Comparison
- “Growth” stocks in the U.S. outperformed in the third quarter as strength in the artificial intelligence secular trade continued. Relative fundamental valuation metrics suggest growth equities are more expensive than value equities.
- Internationally, value stocks have outperformed their growth counterparts, helping to reduce the valuation disparity between these two styles.
- Economic considerations:
- Value equities carry less risk than growth equities and have less downside exposure, should market volatility increase.
- Value stocks also tend to have less downside exposure to trade and tariff related volatility than growth stocks.
- Takeaway
- A slight overweight to value relative to growth is recommended given current fundamental valuations and the potential for trade-related volatility to continue.
Fixed Income: Treasuries
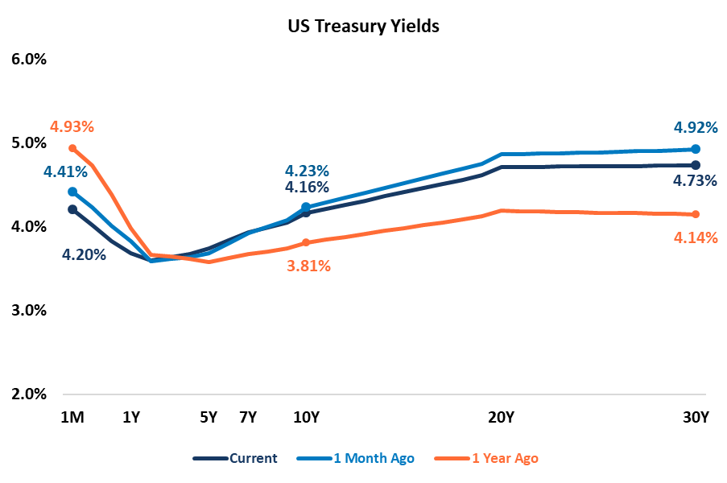
- The U.S. Treasury yield curve has changed materially over the past year, with volatility continuing in the quarter as rate expectations shift and concerns for the health of the U.S. economy increase.
- The yield curve remains inverted only at the very short end of the curve, but longer-dated term rates are no longer inverted.
- Yield curve steepening is likely to continue during a Fed easing cycle. Short-term yields will continue to come down as the Federal Reserve begins cutting rates.
- Longer-term yields move higher on concerns of economic uncertainty, including inflation, growing U.S. deficits and trade wars.
- The yield curve remains inverted only at the very short end of the curve, but longer-dated term rates are no longer inverted.
- The yield curve should continue to steepen through the rest of 2025 as the Fed appears likely to continue to cut short-term rates by 25 to 50 bps through the end of the year.
- Additional factors affecting a steepening yield curve include rising stagflation risks and growing emphasis on debt and deficit concerns.
- Intermediate rates were extremely volatile during the quarter, the 10-year Treasury moved 50 bps peak to trough in the quarter, as sentiment shifted around both inflation expectations and growth of the U.S. economy.
- Takeaways
- Any shift in expectations for the path of rate cuts could lead to increased volatility in rates through the end of the year.
- Investors should consider maintaining a short-duration posture in fixed income portfolios until the U.S. Treasury curve steepens more meaningfully.
Long-Term Investors Should Stay Invested
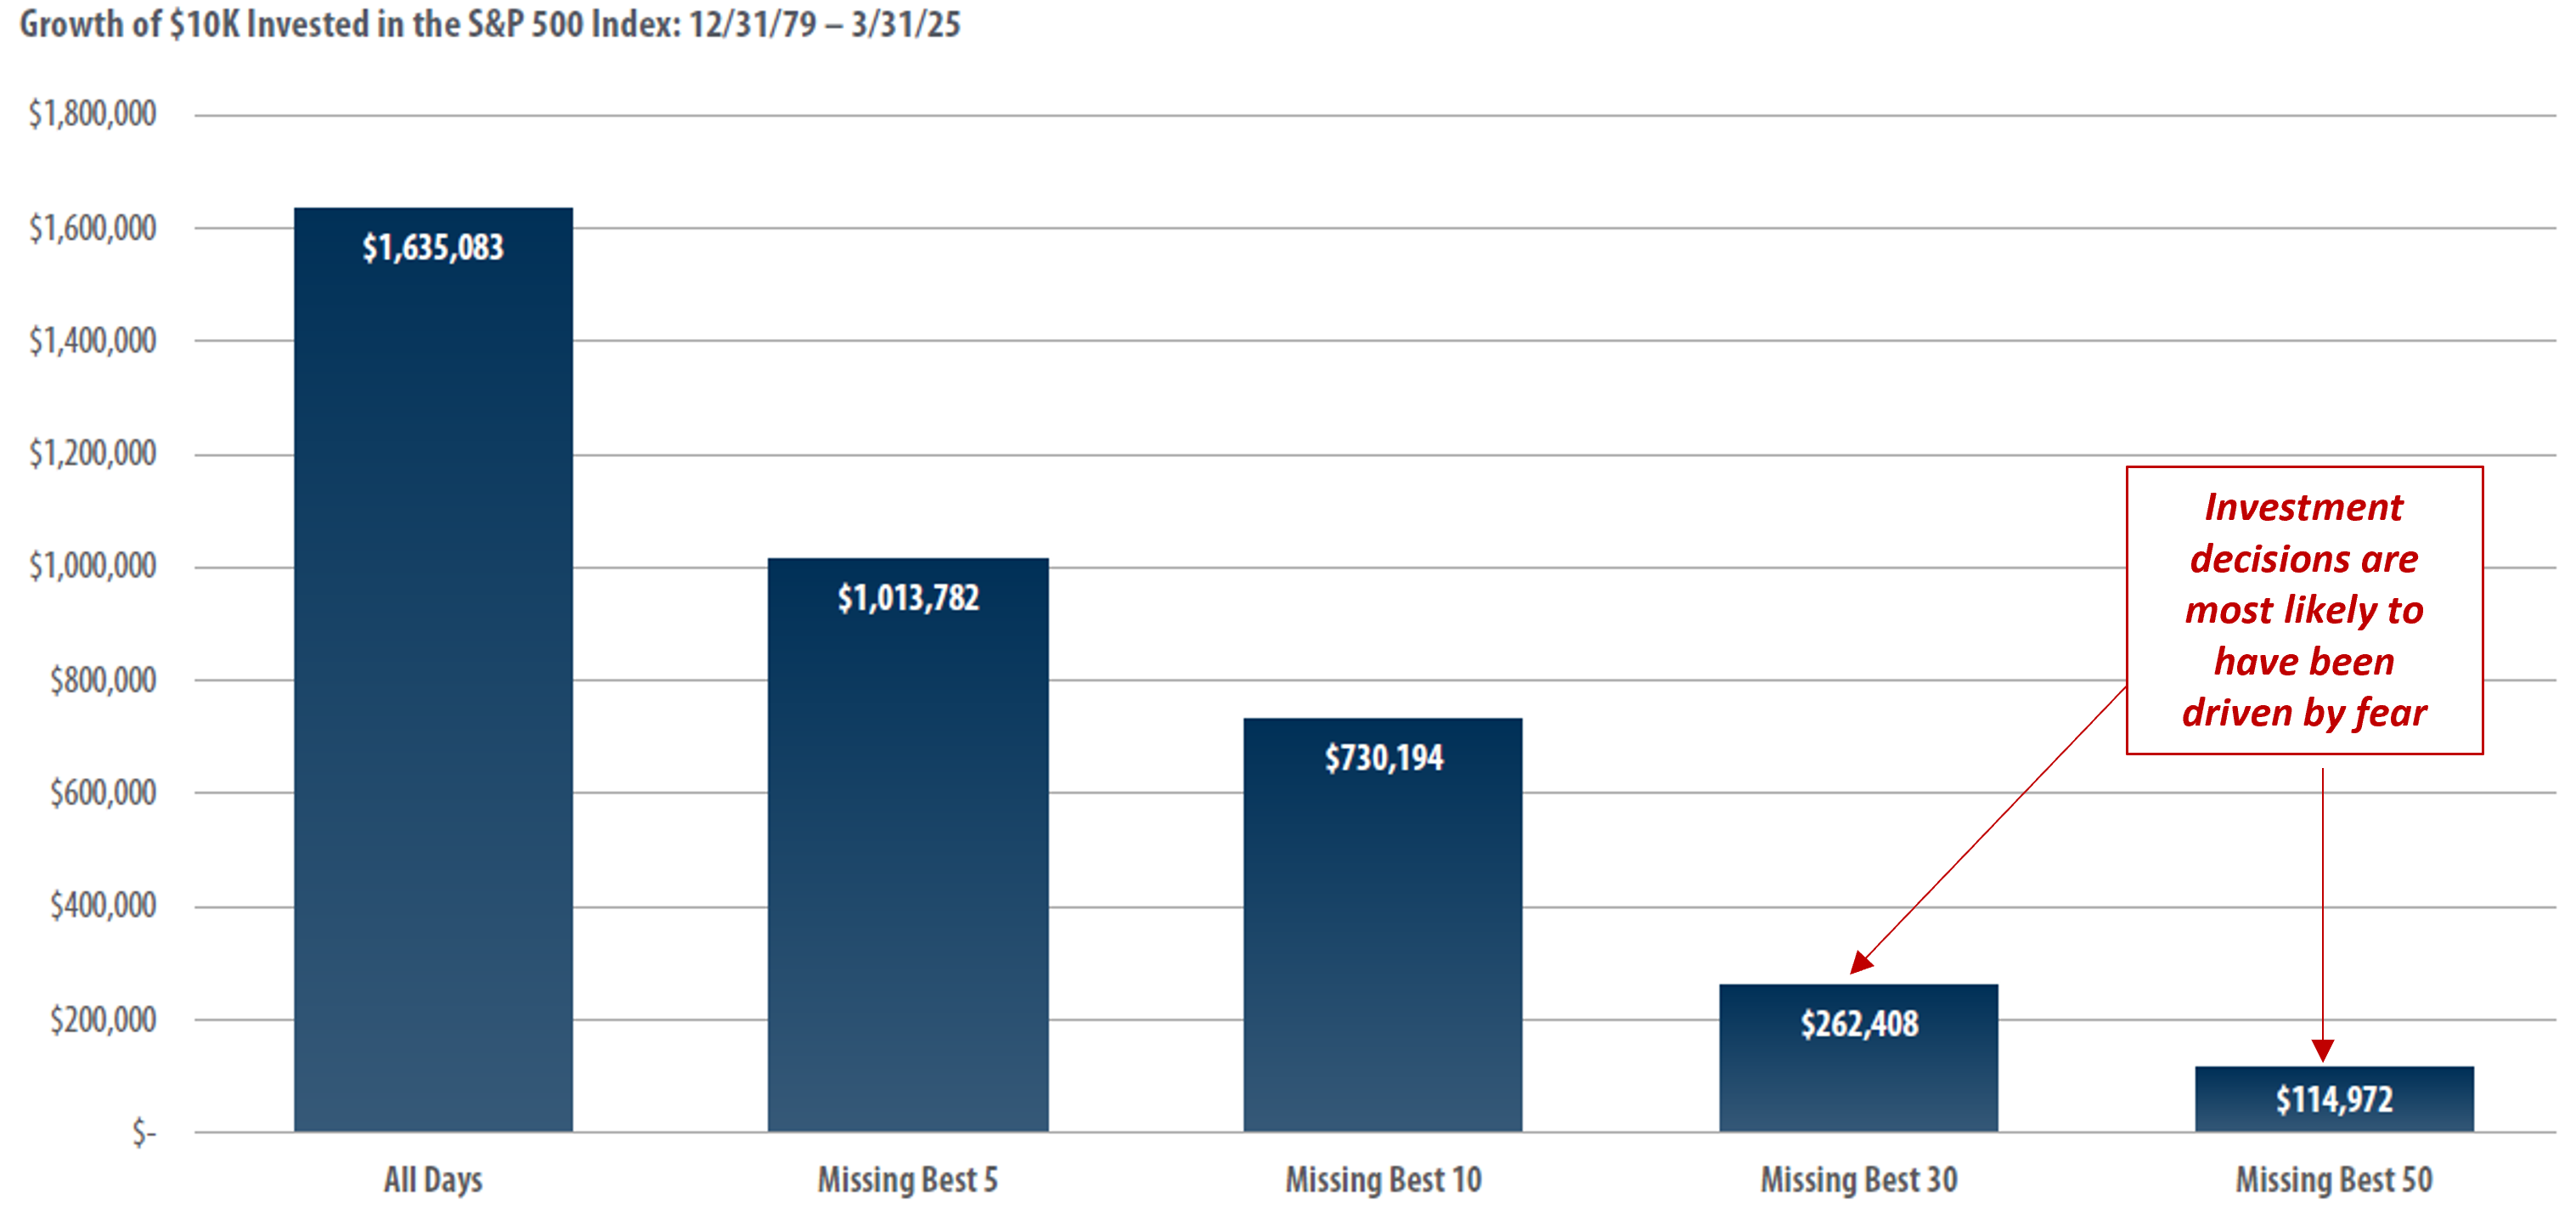
- The chart highlights how a $10k investment in the S&P 500 would have grown over the past 45 years.
- If the investor missed the best 30 days of market performance, the investment portfolio would be worth more than $1.3M less than if the investor had stayed in the market.
- Takeaways
- The market’s best performance days typically occur during periods of elevated volatility.
- Regardless of what may be in store for the macroeconomy and capital markets, long-term investors should avoid the temptation to exit out of markets during periods of elevated uncertainty.
- Riding out market volatility is the best way to build wealth over the long term.
Equity Market Volatility
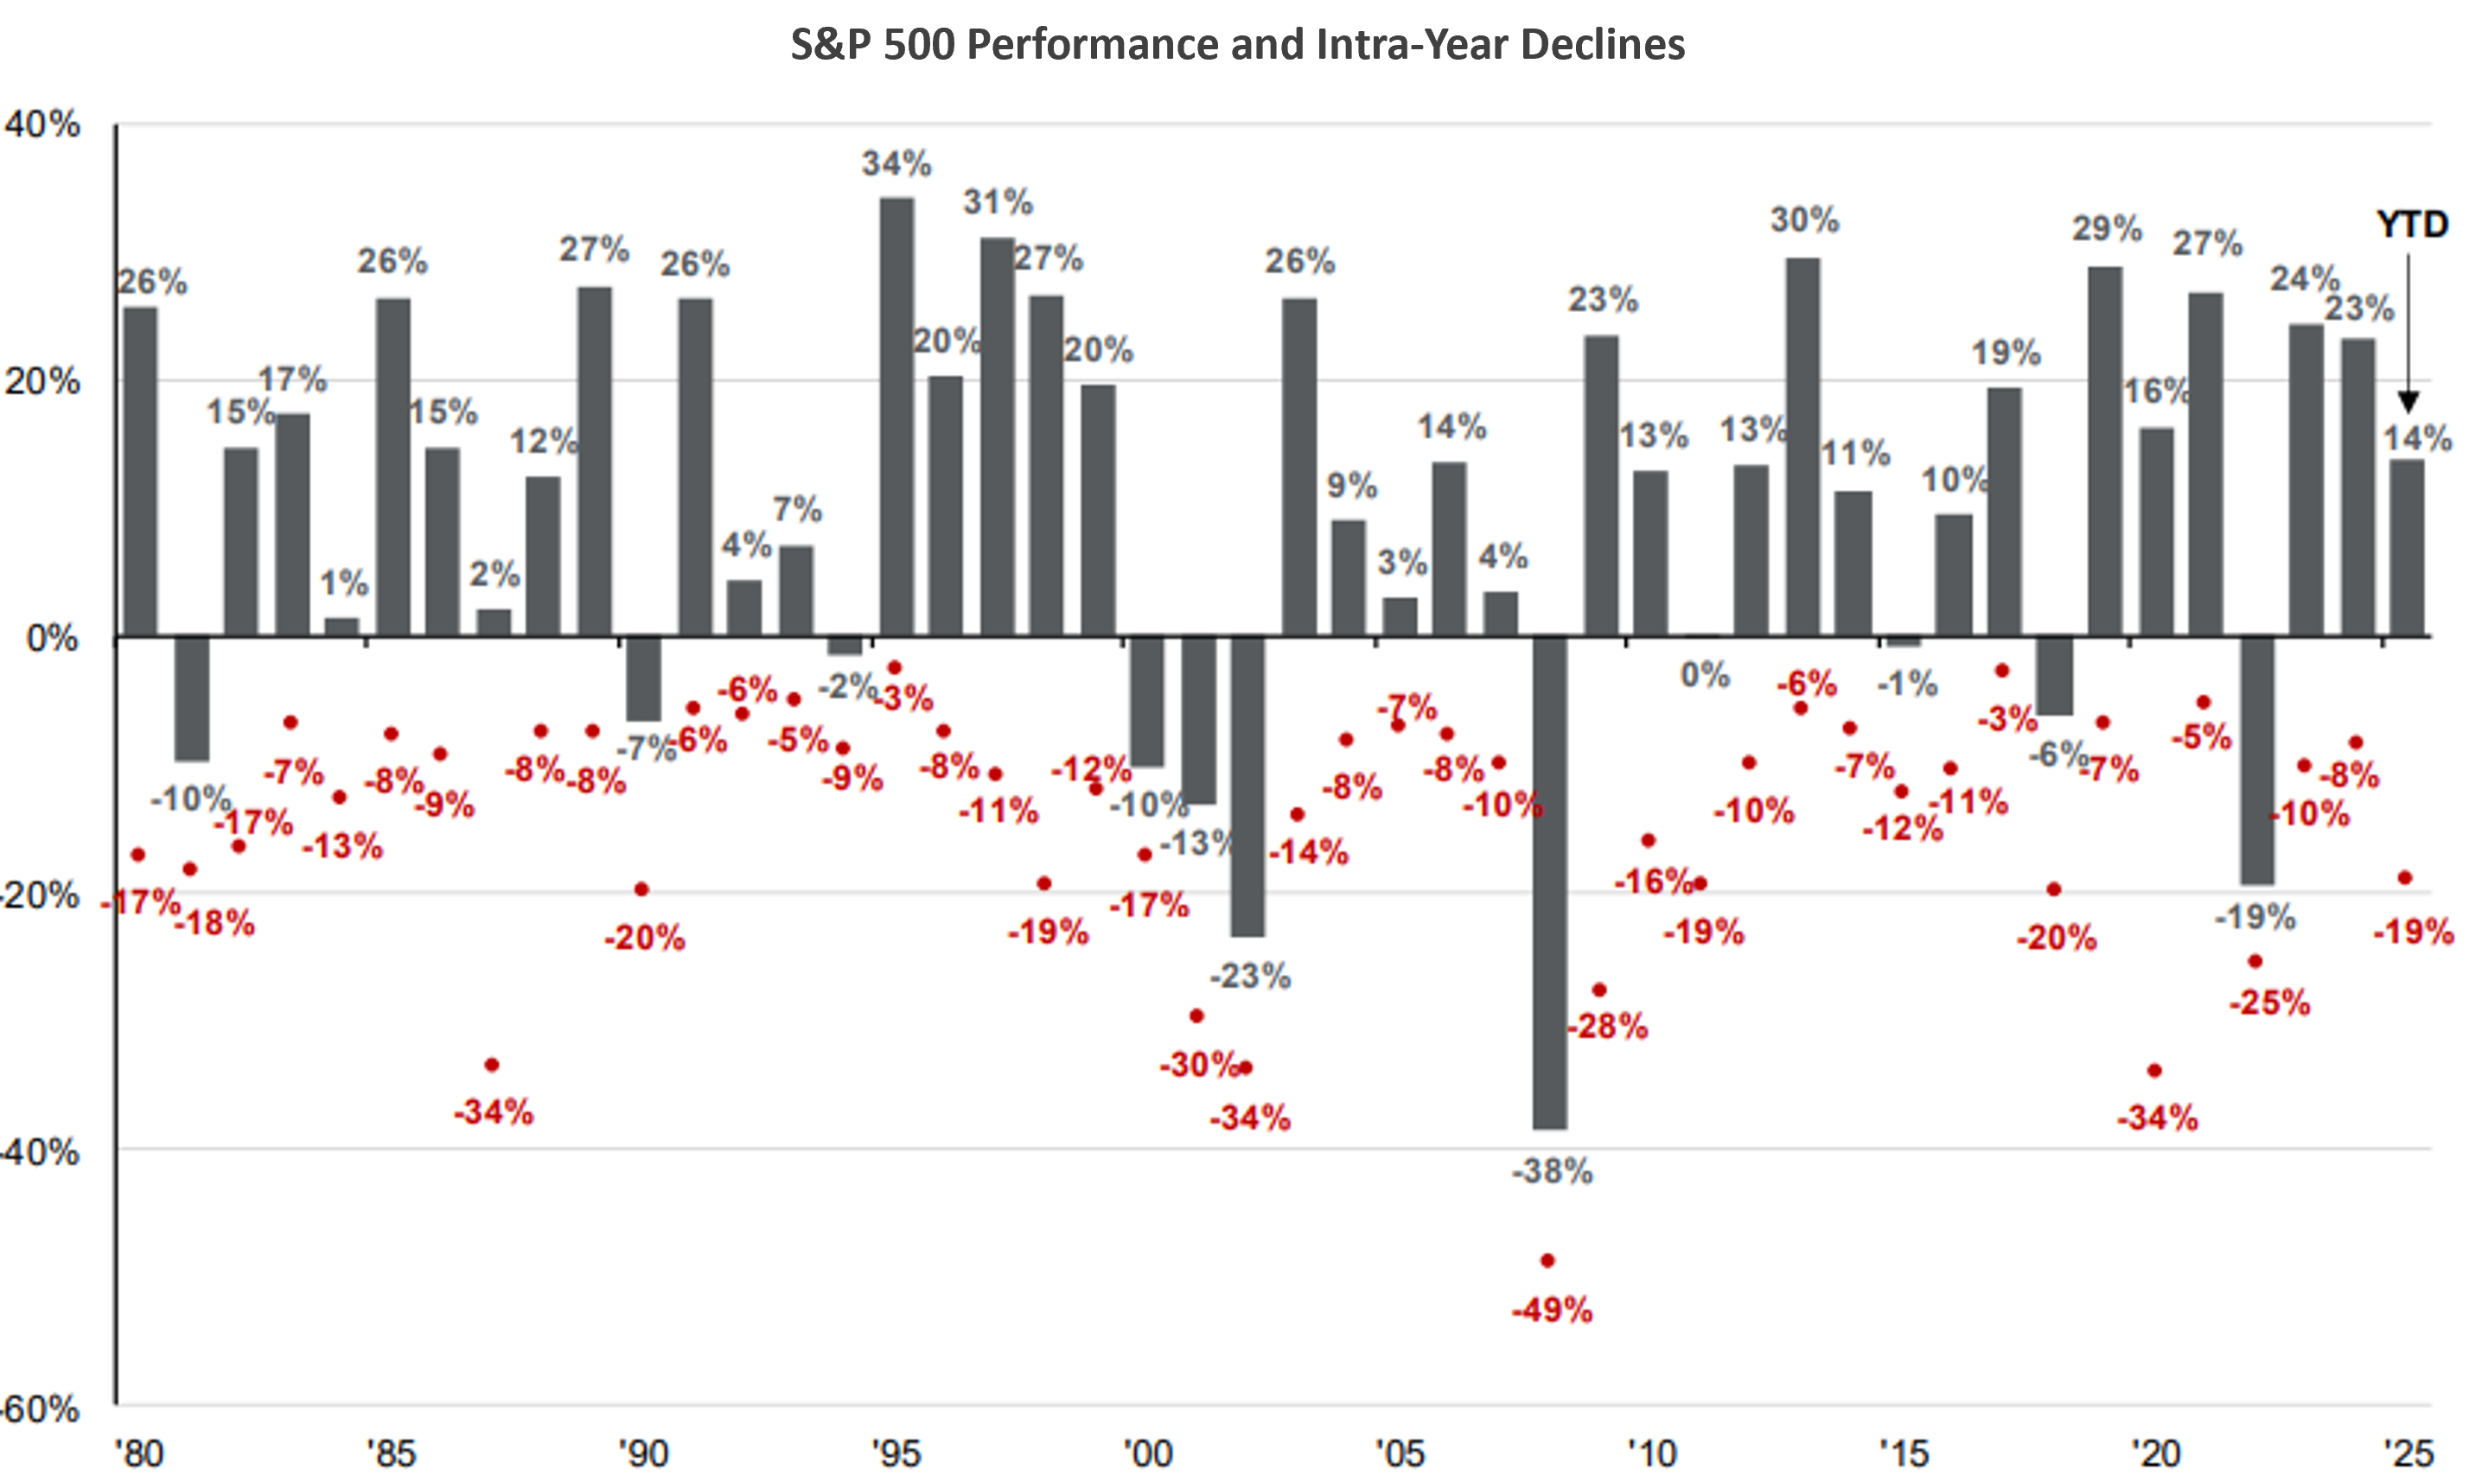
- The chart illustrates annual S&P 500 performance since 1980 (shown in columns above) and the intra-year declines during each year (shown by the red dots).
- Ex: In 2020, the S&P 500 experienced an intra-year decline of -34% before finishing up 16% for the year.
- Over the past 45 years, the S&P 500 has experienced an average intra-year decline of 14%. Despite that, the S&P 500 had positive annual performance in 34 of the last 45 years.
- Takeaway
- As painful as market volatility can be, equity market selloffs are normal and investors are rewarded for patience.
Playbook Summary
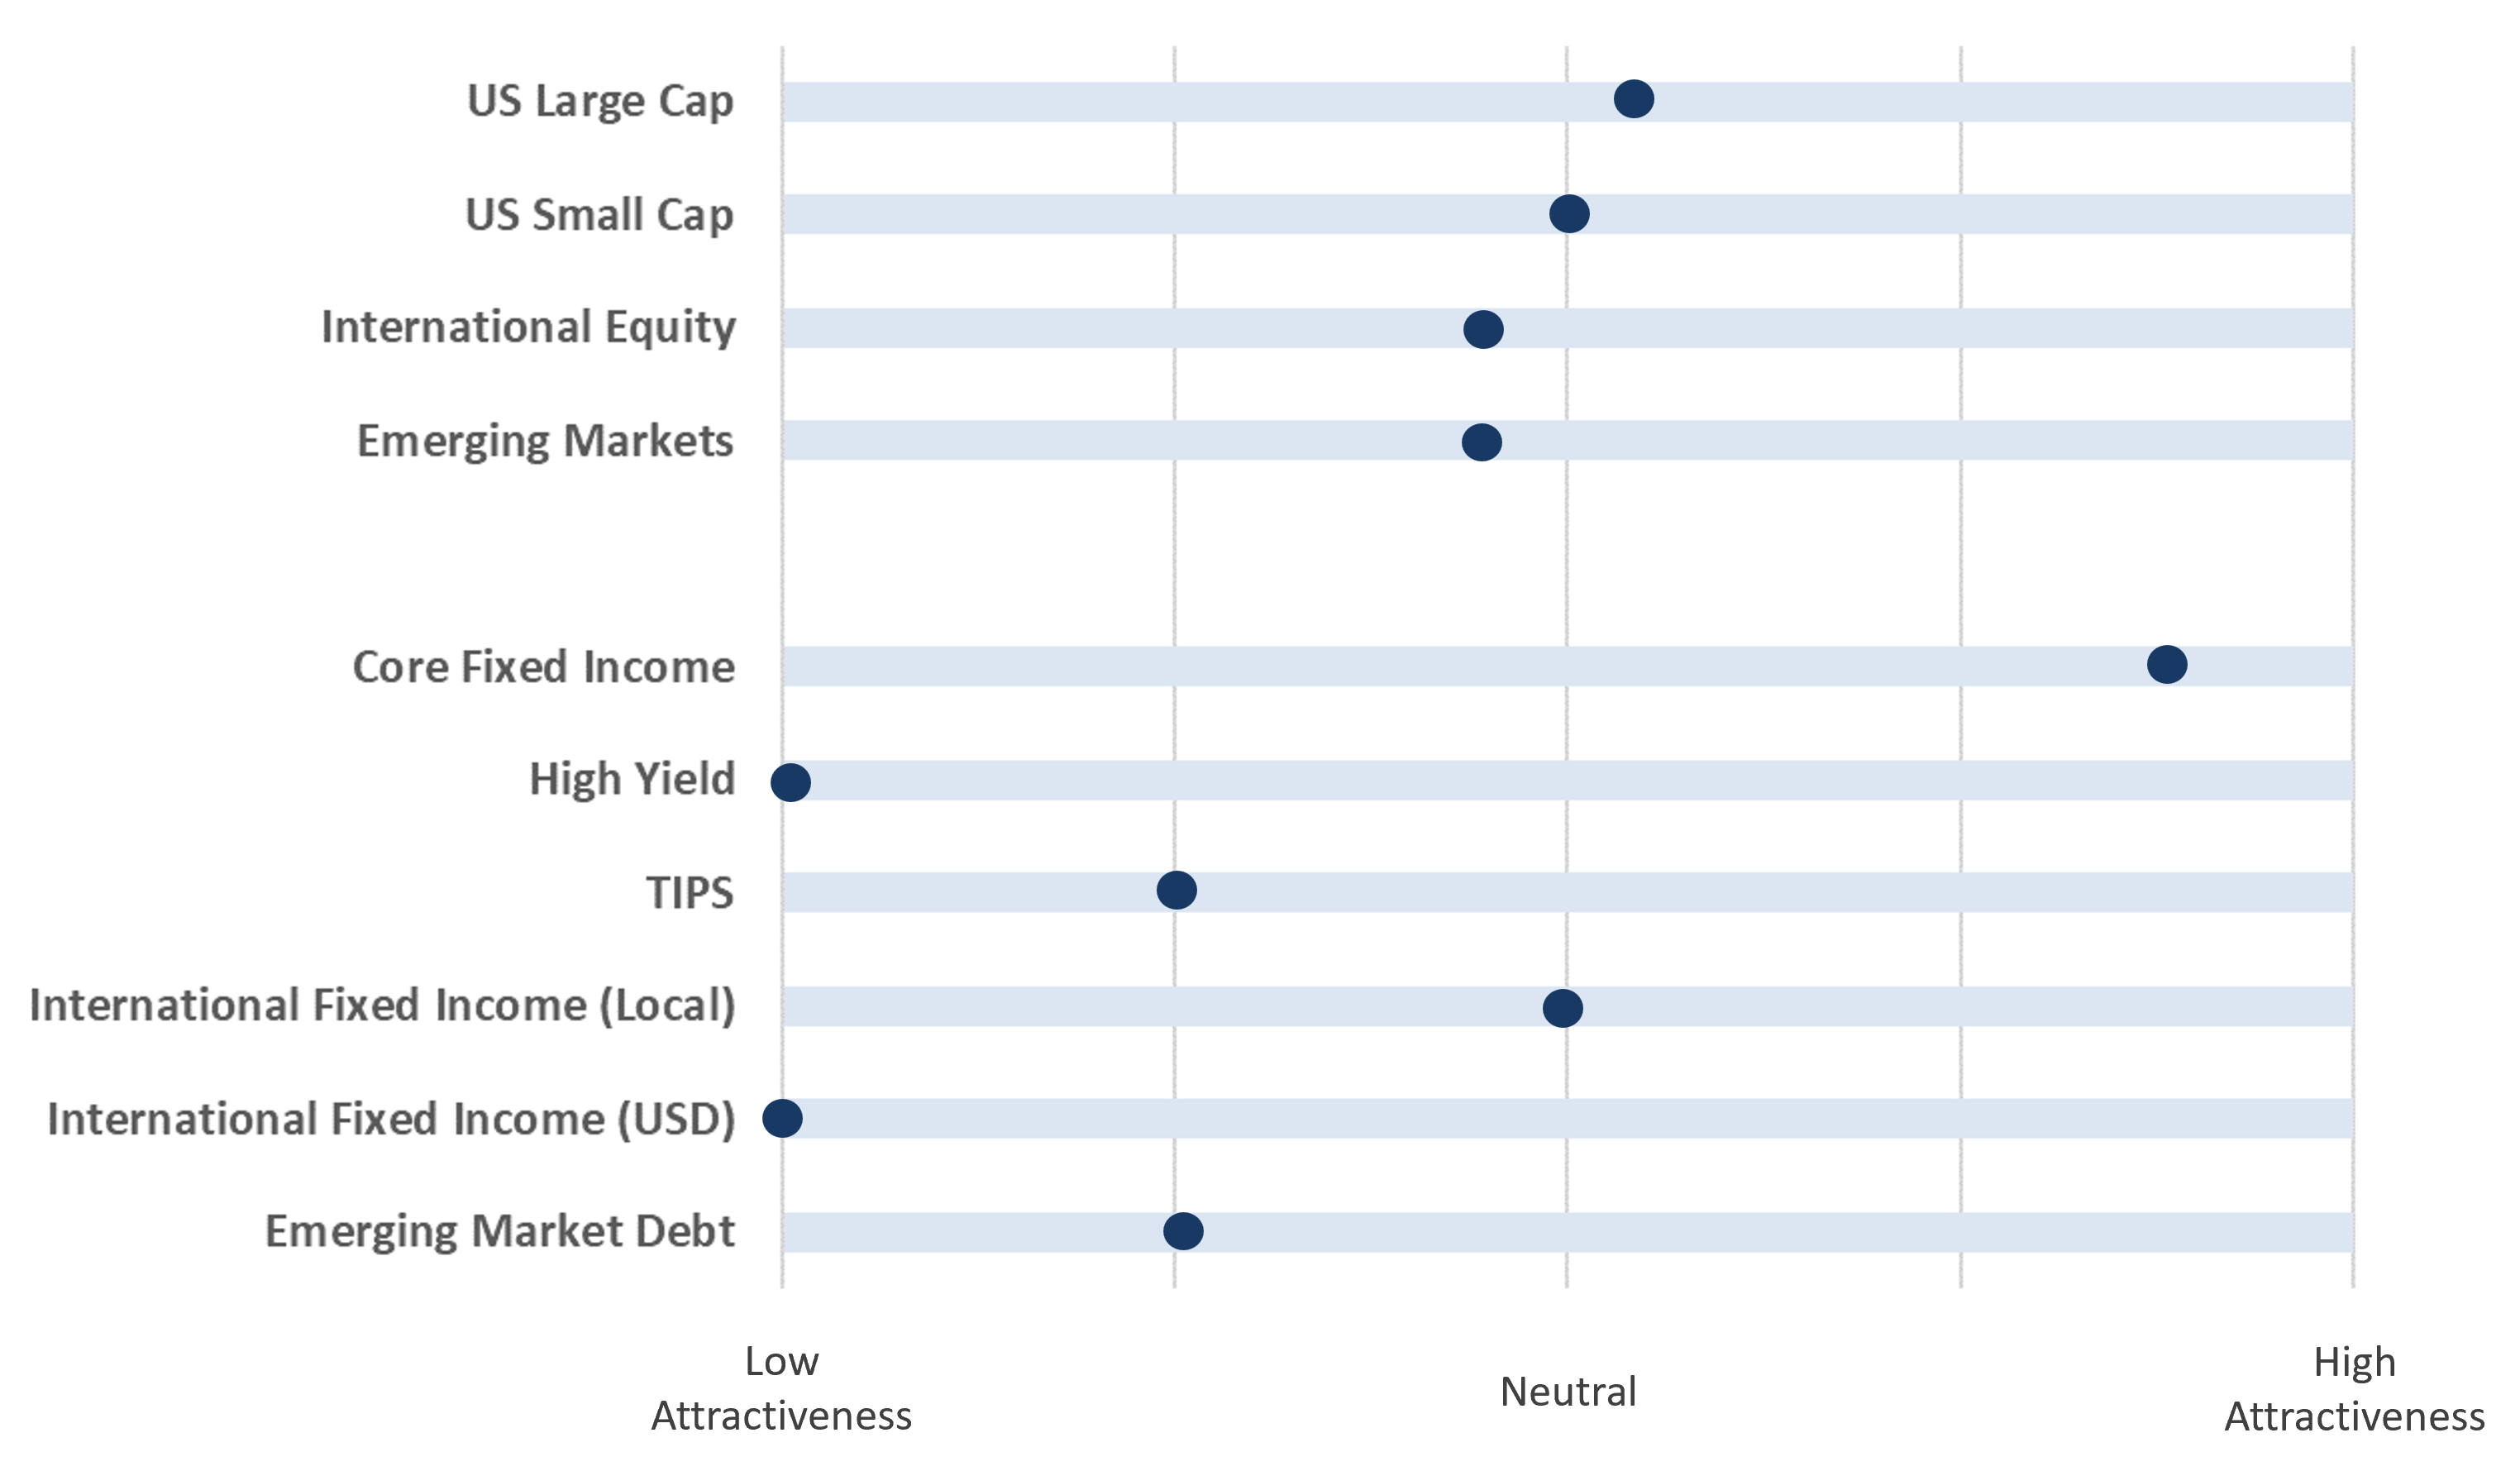
- The above table indicates where each major investment asset class falls on the distribution of attractiveness (from low to high). This table is meant to provide a standardized and comparable view of the level of opportunity in each asset class category.
- In subsequent quarters, we will discuss any movement along the scale for each asset class and the driving forces behind the change in outlook.

