
Market Flash Report | Ocotber 2025

Economic Highlights
United States
- Economic data from the U.S. government has been limited during the 30+ day shutdown, but the U.S. economy remains on solid footing. U.S. GDP grew 3.8% in Q2 and the Atlanta Federal Reserve’s latest estimate pins growth at 3.9% for Q3. Most economists project growth of 1.5-3% during Q3, after the U.S. economy grew 1.5% in the first half of 2025.
- One of the widely anticipated data points released in October was the September Consumer Price Index (CPI) reading, which came in below expectations. Headline inflation increased 0.3% M/M or 3% Y/Y in September, with Core CPI coming in at a 0.2% monthly gain or 3% Y/Y. A 4.1% jump in gasoline prices was the largest contributor to a report that otherwise showed inflation pressures fairly muted. Food prices saw a 0.2% increase. Commodity prices overall rose 0.5%. On an annual basis, energy was up 2.8% and food rose 3.1%. Shelter costs, which comprise about one-third of the weighting in the CPI, rose just 0.2% and were up 3.6% from a year ago. The CPI reading is the only official economic data allowed to be released during the government shutdown thus far.
- The Fed cut rates by 25 bps as expected at its October meeting. The current fed funds rate sits at a range of 3.75-4%. The Fed also decided to conclude its current quantitative tightening program on December 1. The decision was not unanimous, as one Fed governor voted for a 50 bps rate cut and another voted to keep rates steady. Chairman Powell did not provide much clarity around future rate cuts but indicated those will be data dependent and will factor in the government shutdown. The probability of a 25 bps rate cut in December is 63%.
- Economic activity in the U.S. manufacturing sector contracted in October for the eighth consecutive month, following a two-month expansion preceded by 26 straight months of contraction. The ISM Manufacturing PMI fell from 49.1 in September to 48.7 in October. Most of the weakness came from the production and prices components. New orders and employment strengthened in October, but most manufacturing gauges remain firmly in contraction territory.
Non-U.S. Developed
- The eurozone Composite PMI hit a 17-month high in October, with a reading of 52.2 versus 51.2 in the prior month. The important manufacturing PMI hit 50.0 in October, a two-month high, while the services component hit a 14-month high. New orders saw the strongest jump in more than 2.5 years, fueling most of the strength. In addition, employment returned to growth in October, and companies in general remained optimistic that output will increase over the coming year. A solid increase in output was registered in Germany, where the pace of growth hit a 29-month high. Similarly, the euro area excluding Germany and France posted the fastest rise in activity in 2.5 years.
- Inflation in the eurozone edged down in October as higher prices for food and industrial goods were offset by another drop in energy costs. Annual inflation slowed to 2.1%, in line with consensus estimates, from 2.2% in September. Energy prices dropped 0.2% in October, food prices rose 0.7% and services inflation jumped to an annualized rate of 3.4%. While the latest inflation reading is only a touch above the European Central Bank’s 2% target, the persistence of inflation in the services sector will likely make the ECB reluctant to lower interest rates any further for the foreseeable future.
Emerging Markets
- China’s manufacturing activity in October contracted more than expected, slumping to a six-month low of 49.0. The October reading missed economists’ estimates of 49.6 and slowed down from 49.8 in September. The sub-indexes tracking production, new orders, raw material inventory and employment all sunk further into contraction, pointing to a deeper manufacturing slowdown and softer demand. China’s manufacturing activity has remained in contraction since April.
- The official non-manufacturing PMI, covering construction and services, ticked up to 50.1, boosted by the renewed momentum in air and railway transportation, accommodation, and cultural and sports-related entertainment activities.
- China continues to face issues over its ballooning debt and deflationary pressures. The latest reading on inflation showed a 0.3% Y/Y decline in headline prices with a 1% annual increase in core inflation (highest in 19 months). Six of the last eight monthly CPI readings have shown declining prices. Producer or wholesale prices in China remain fully entrenched in deflationary territory.
- Brazil’s GDP expanded by 2.2% from the previous year during the second quarter of 2025, slowing from the 2.9% expansion in the previous period. The data reflected the softest growth rate in more than three years. This indicates an increasing impact of high interest rates from the central bank, among the highest in the world on a real basis, as stubborn inflation continues to dent purchasing power.
Market Performance
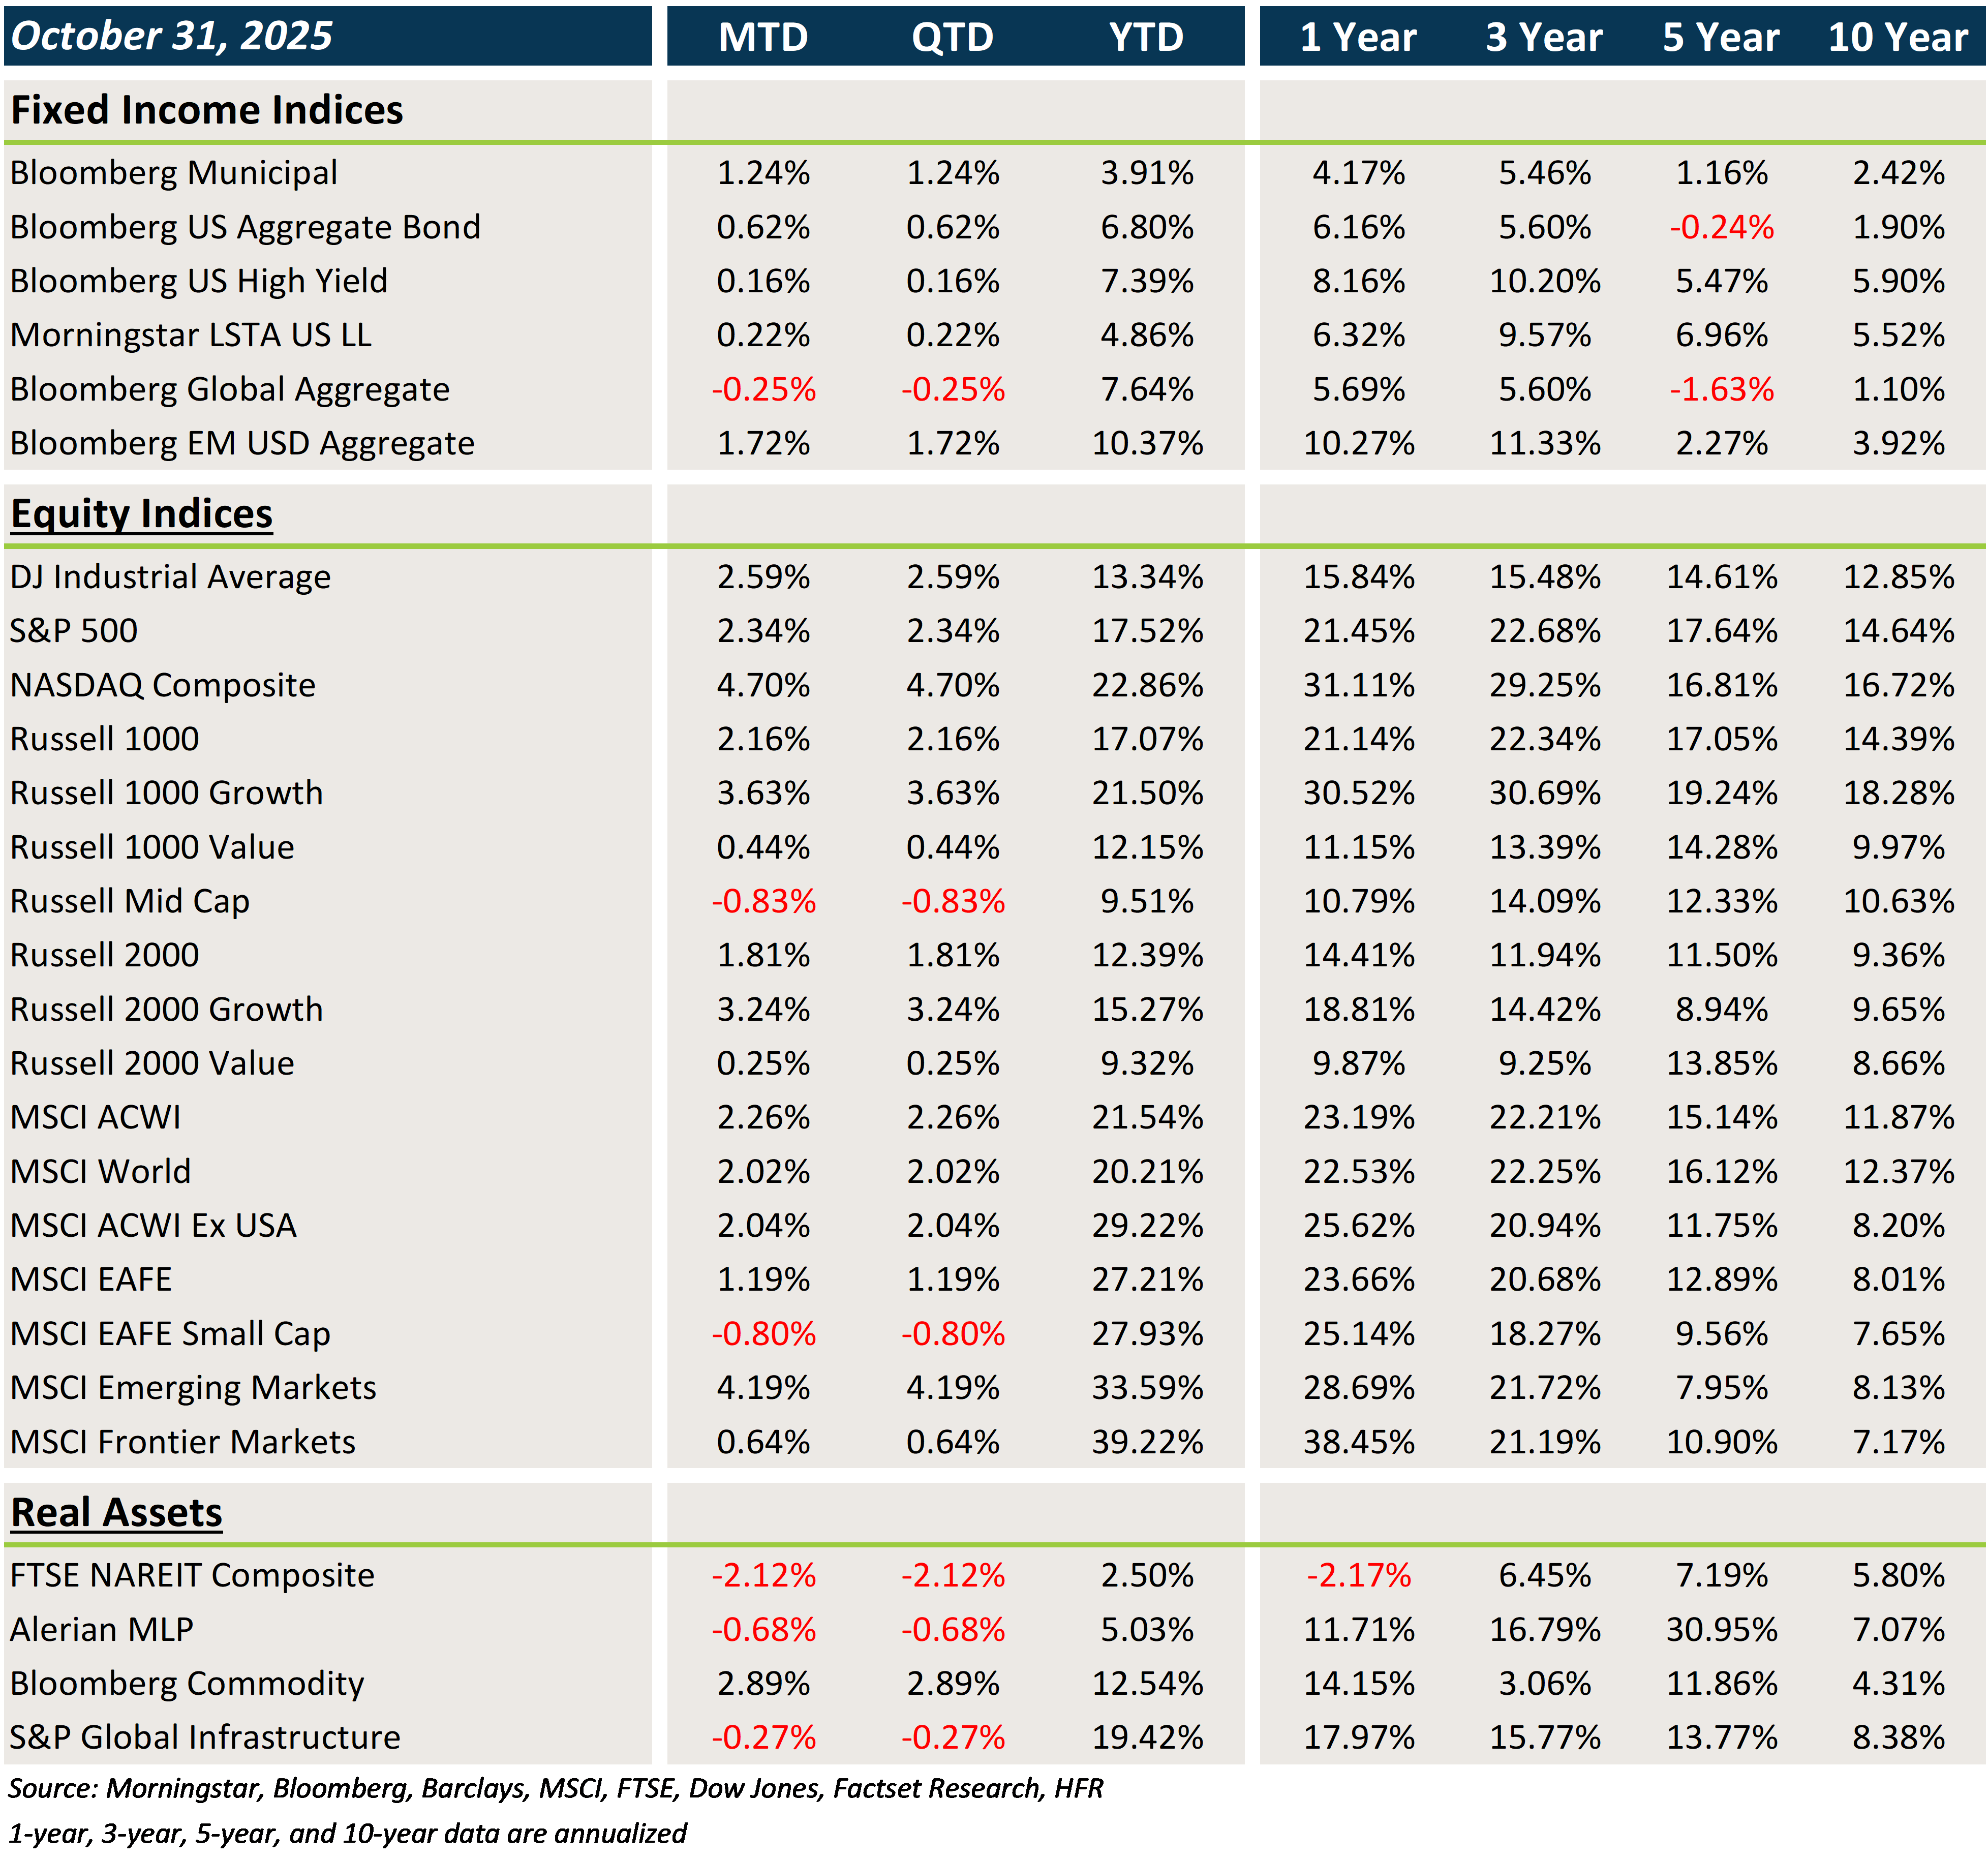
Fixed Income
- Interest rates trended lower throughout October before reversing course after the Fed slashed rates by 25 bps. Core fixed income and municipal bonds posted solid gains.
- Credit investors continue to benefit from a benign environment driven by coupon clipping.
- Bonds outside the U.S. lost ground mostly due to some USD strength.
U.S. Equities
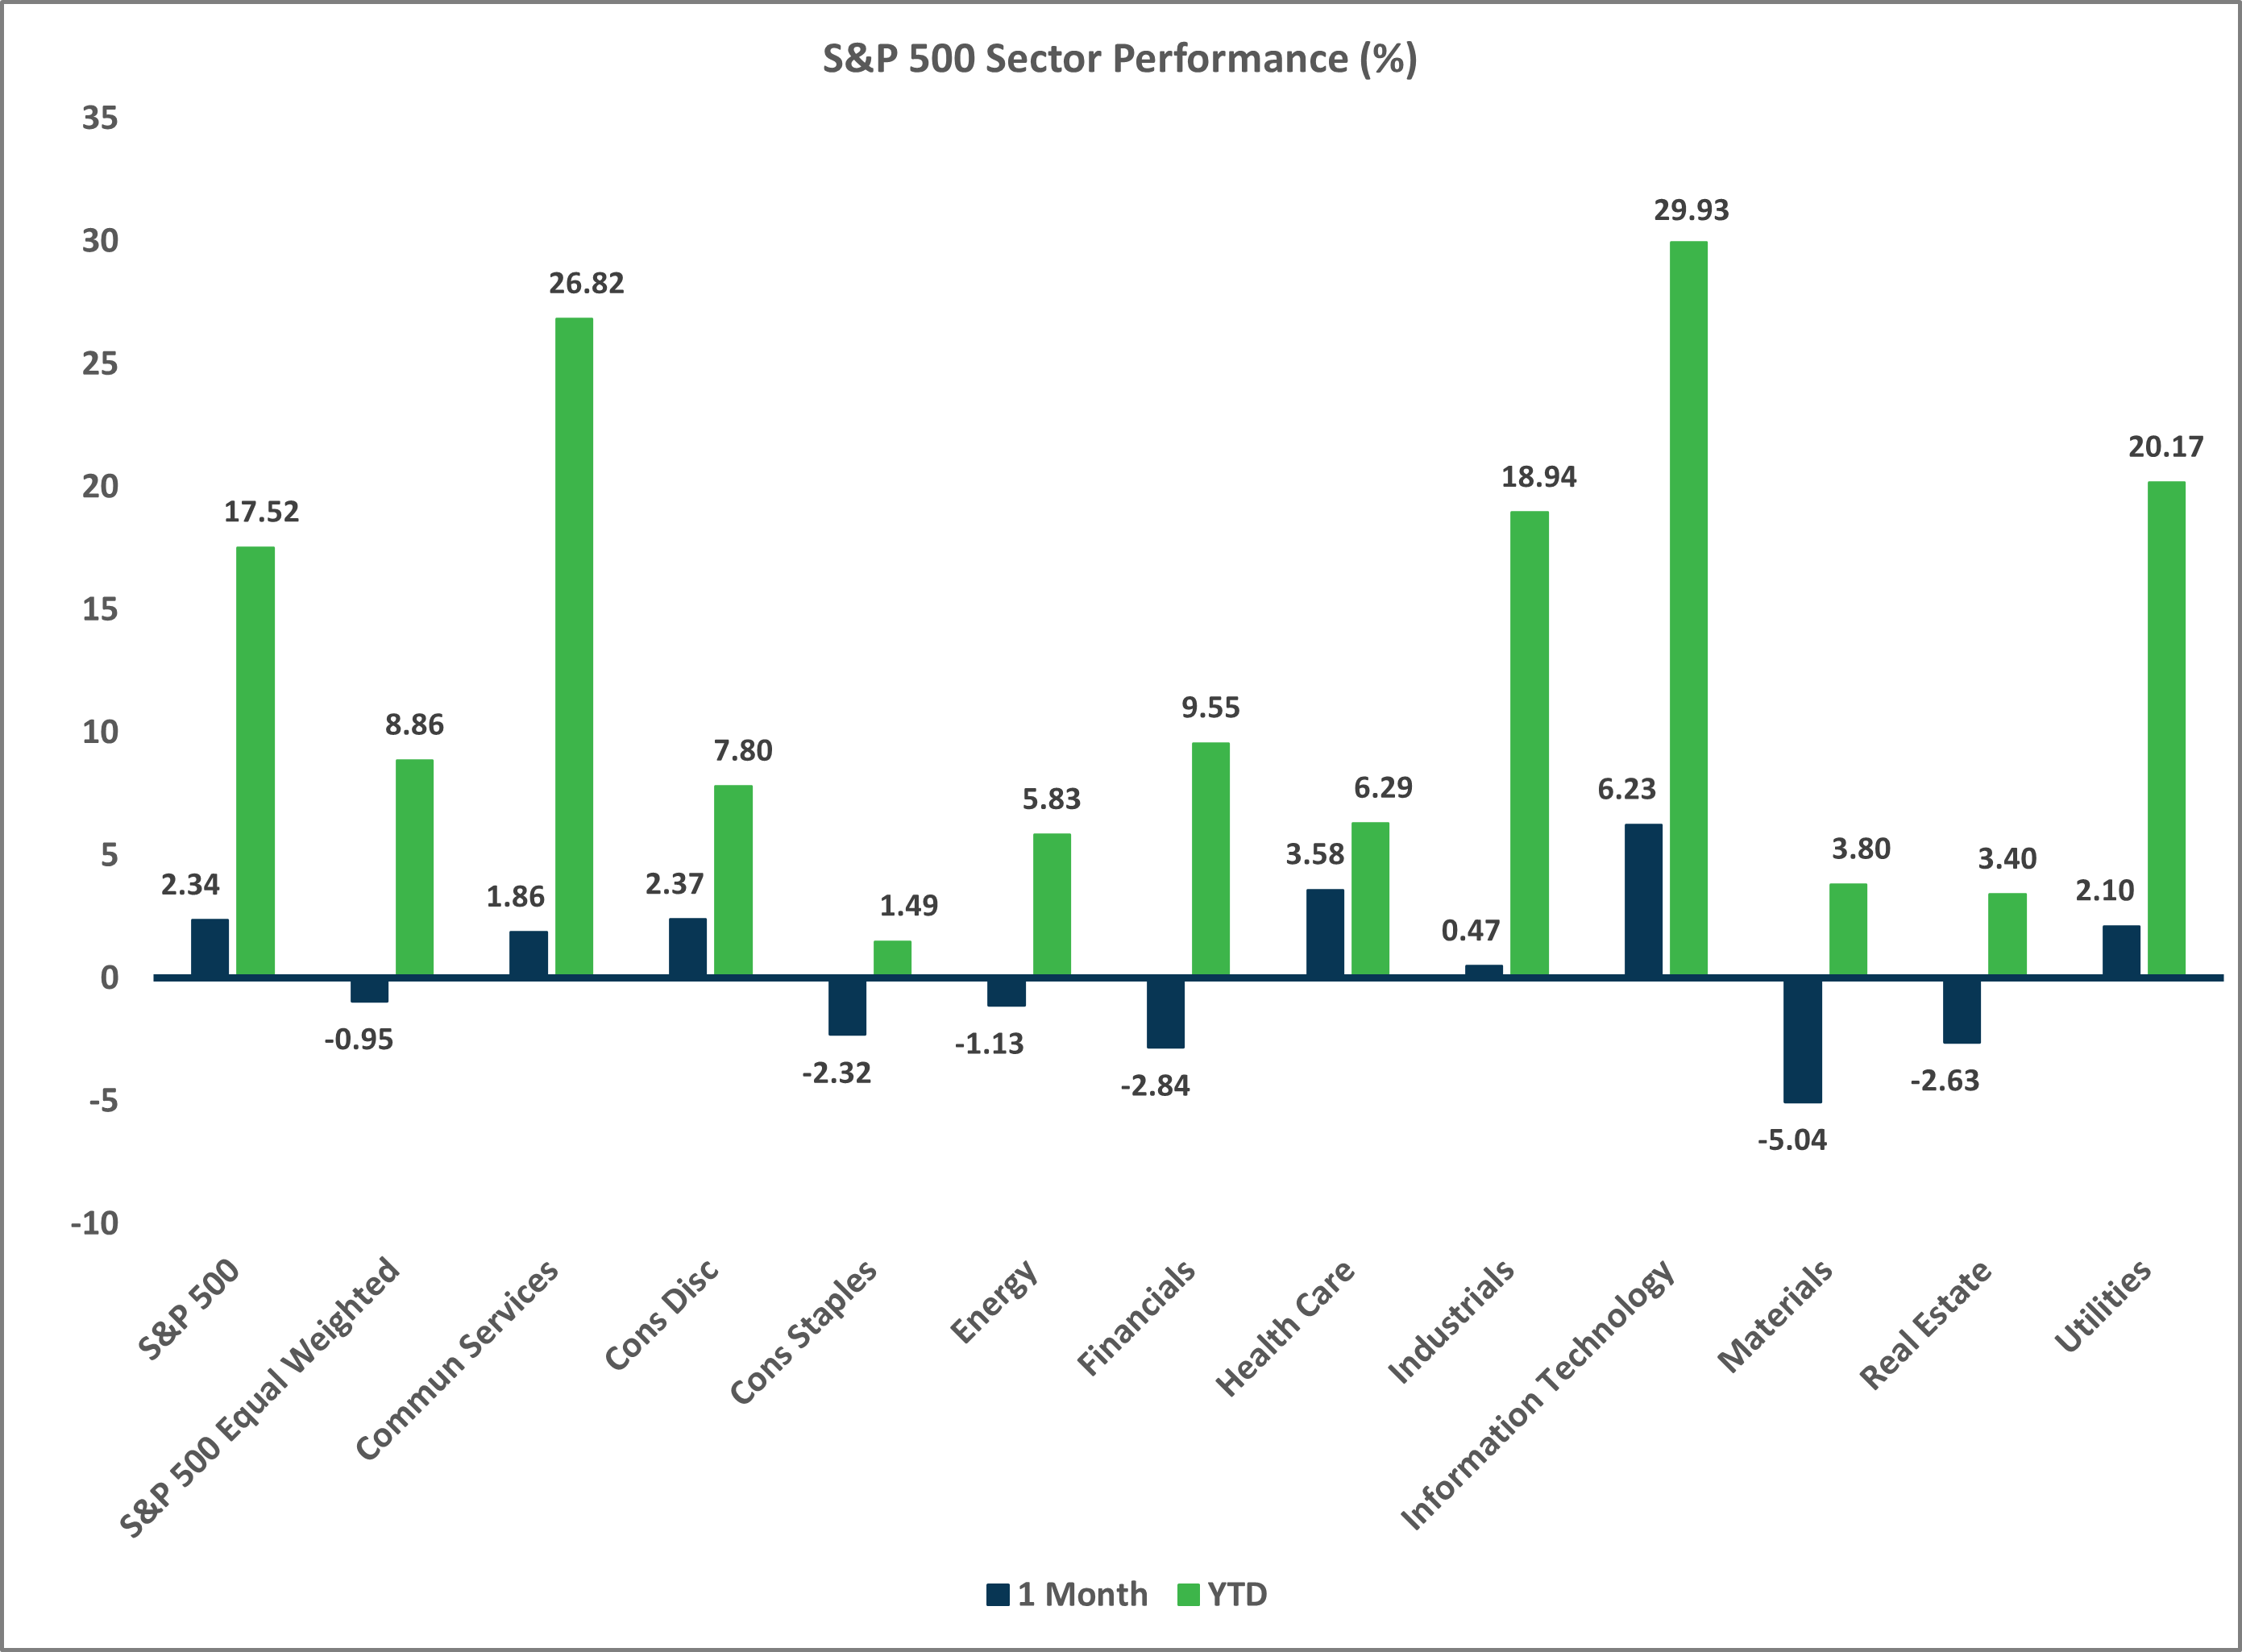
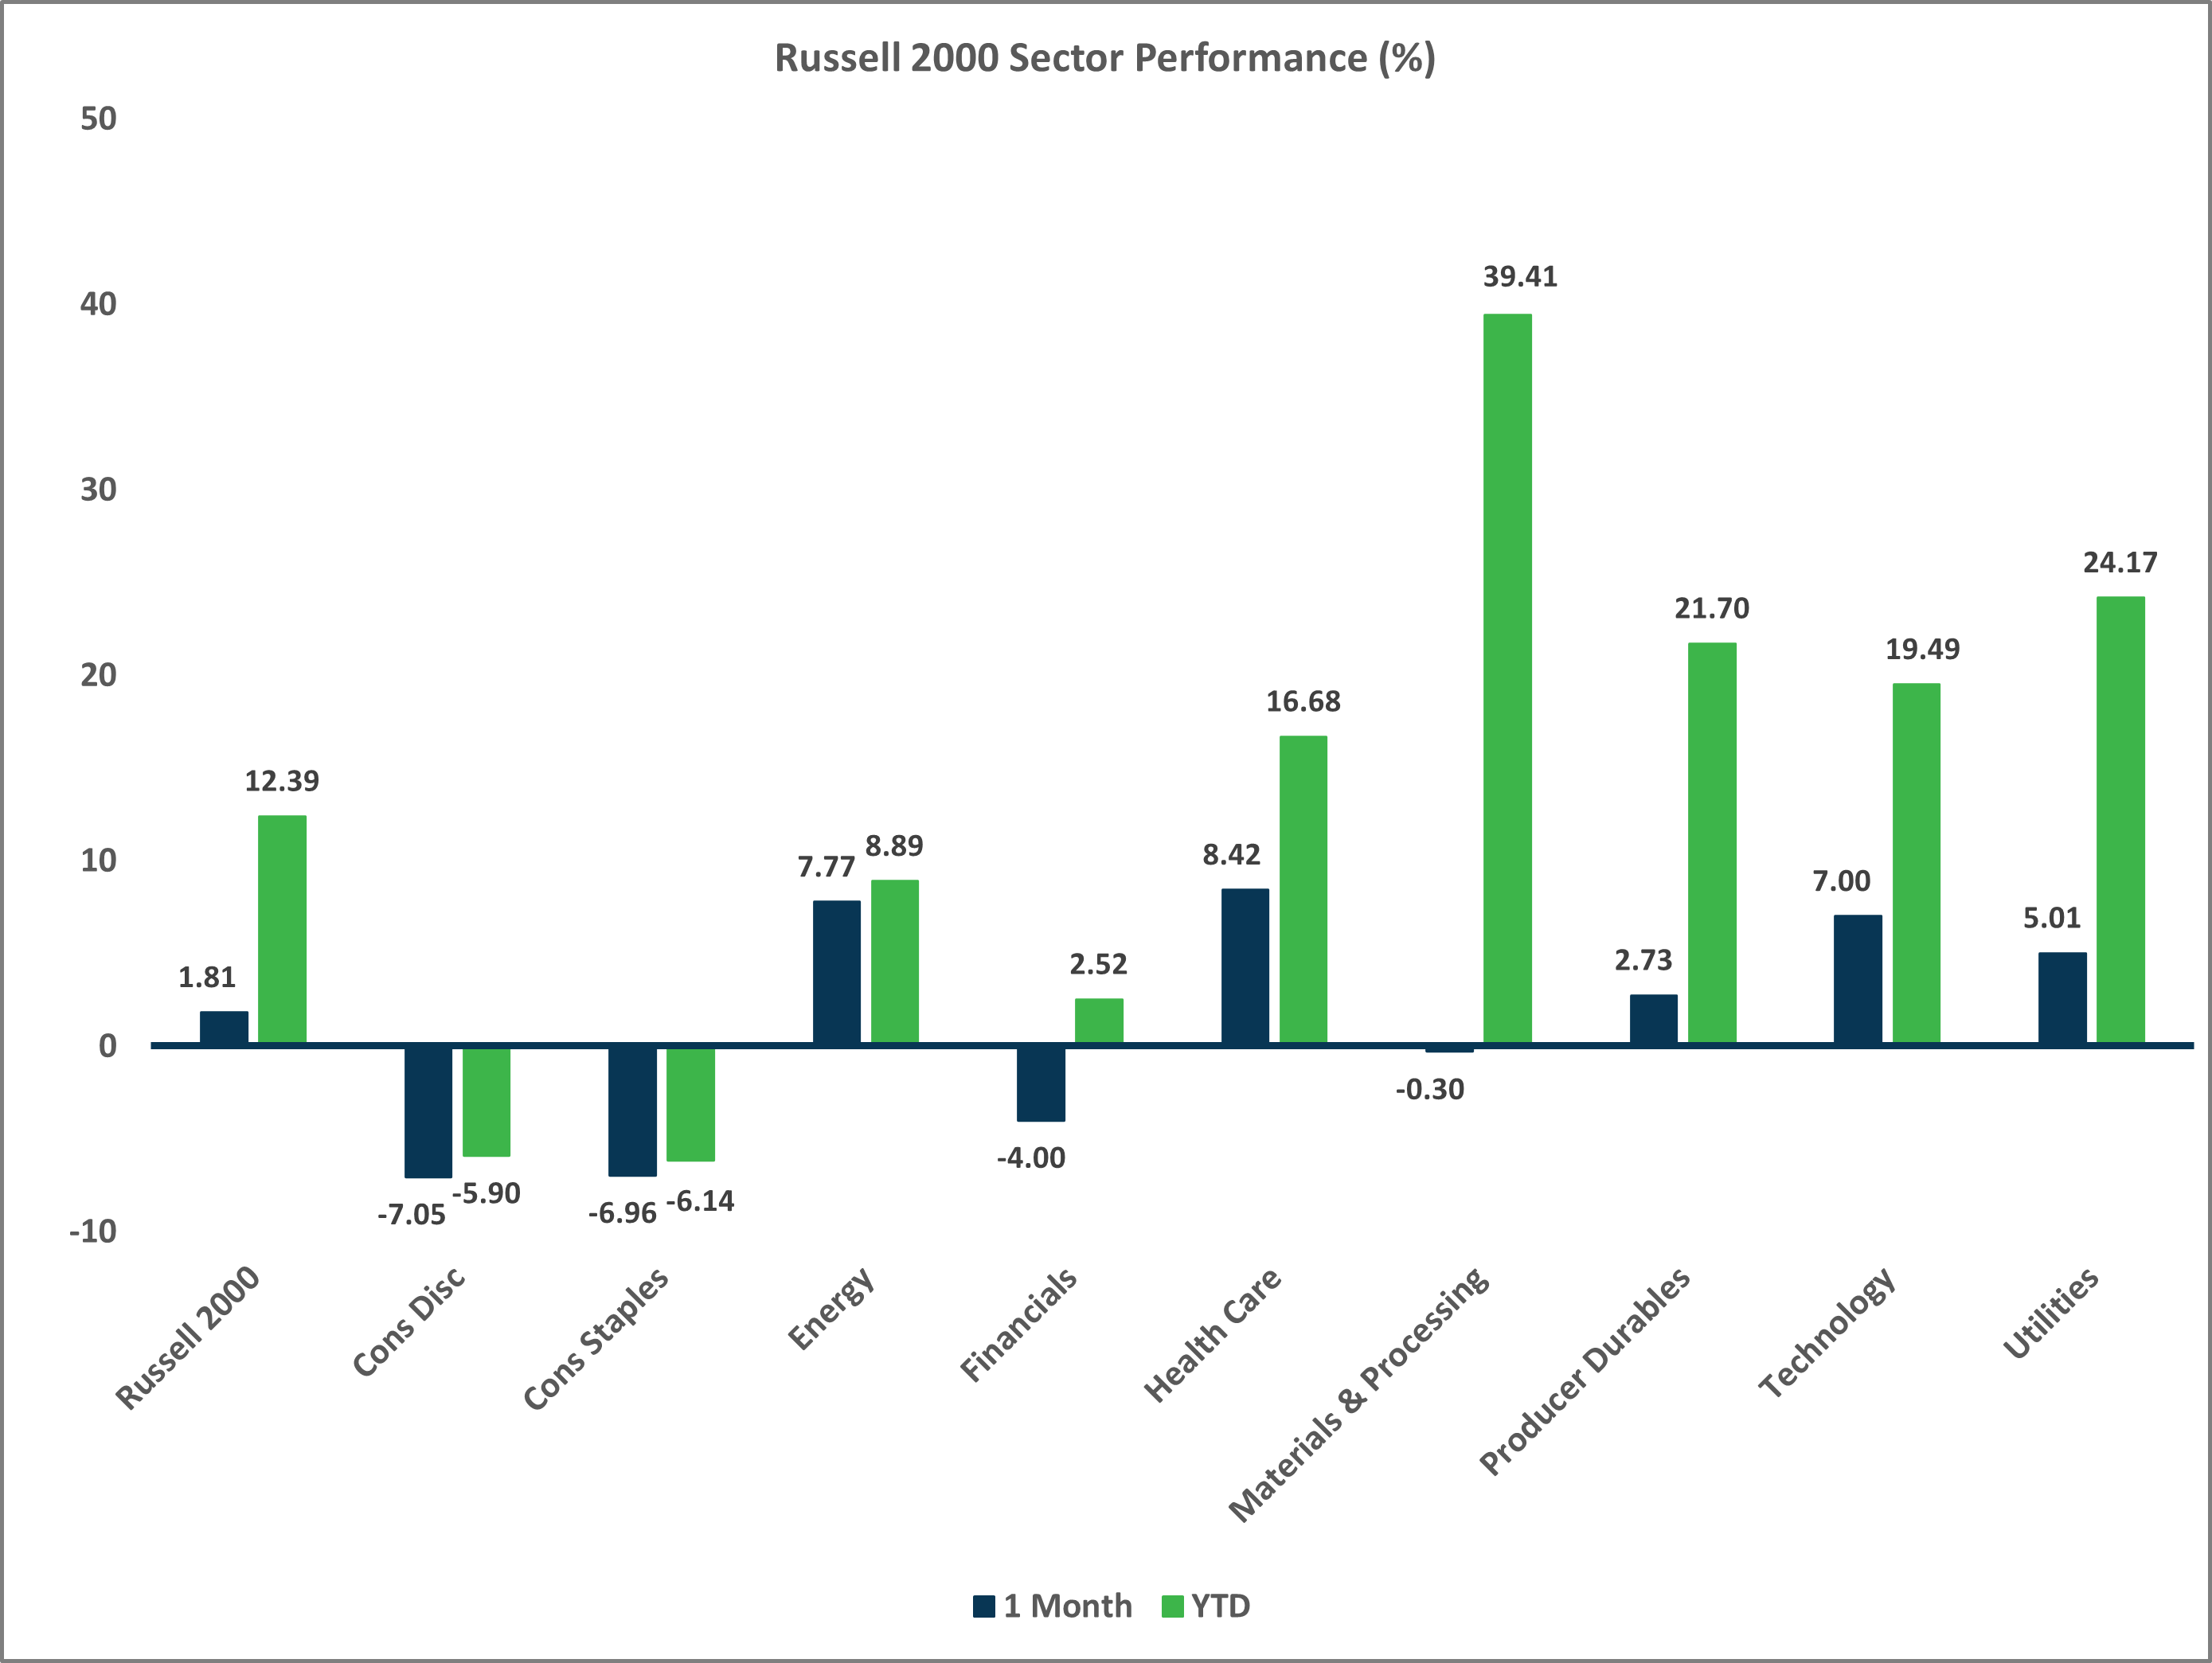
- U.S. equities outperformed in October relative to other developed markets.
- Large caps beat small caps last month and growth trounced value.
- Large cap growth/tech stocks continue to drive the strong gains across U.S. equities in 2025.
Non-U.S. Equities
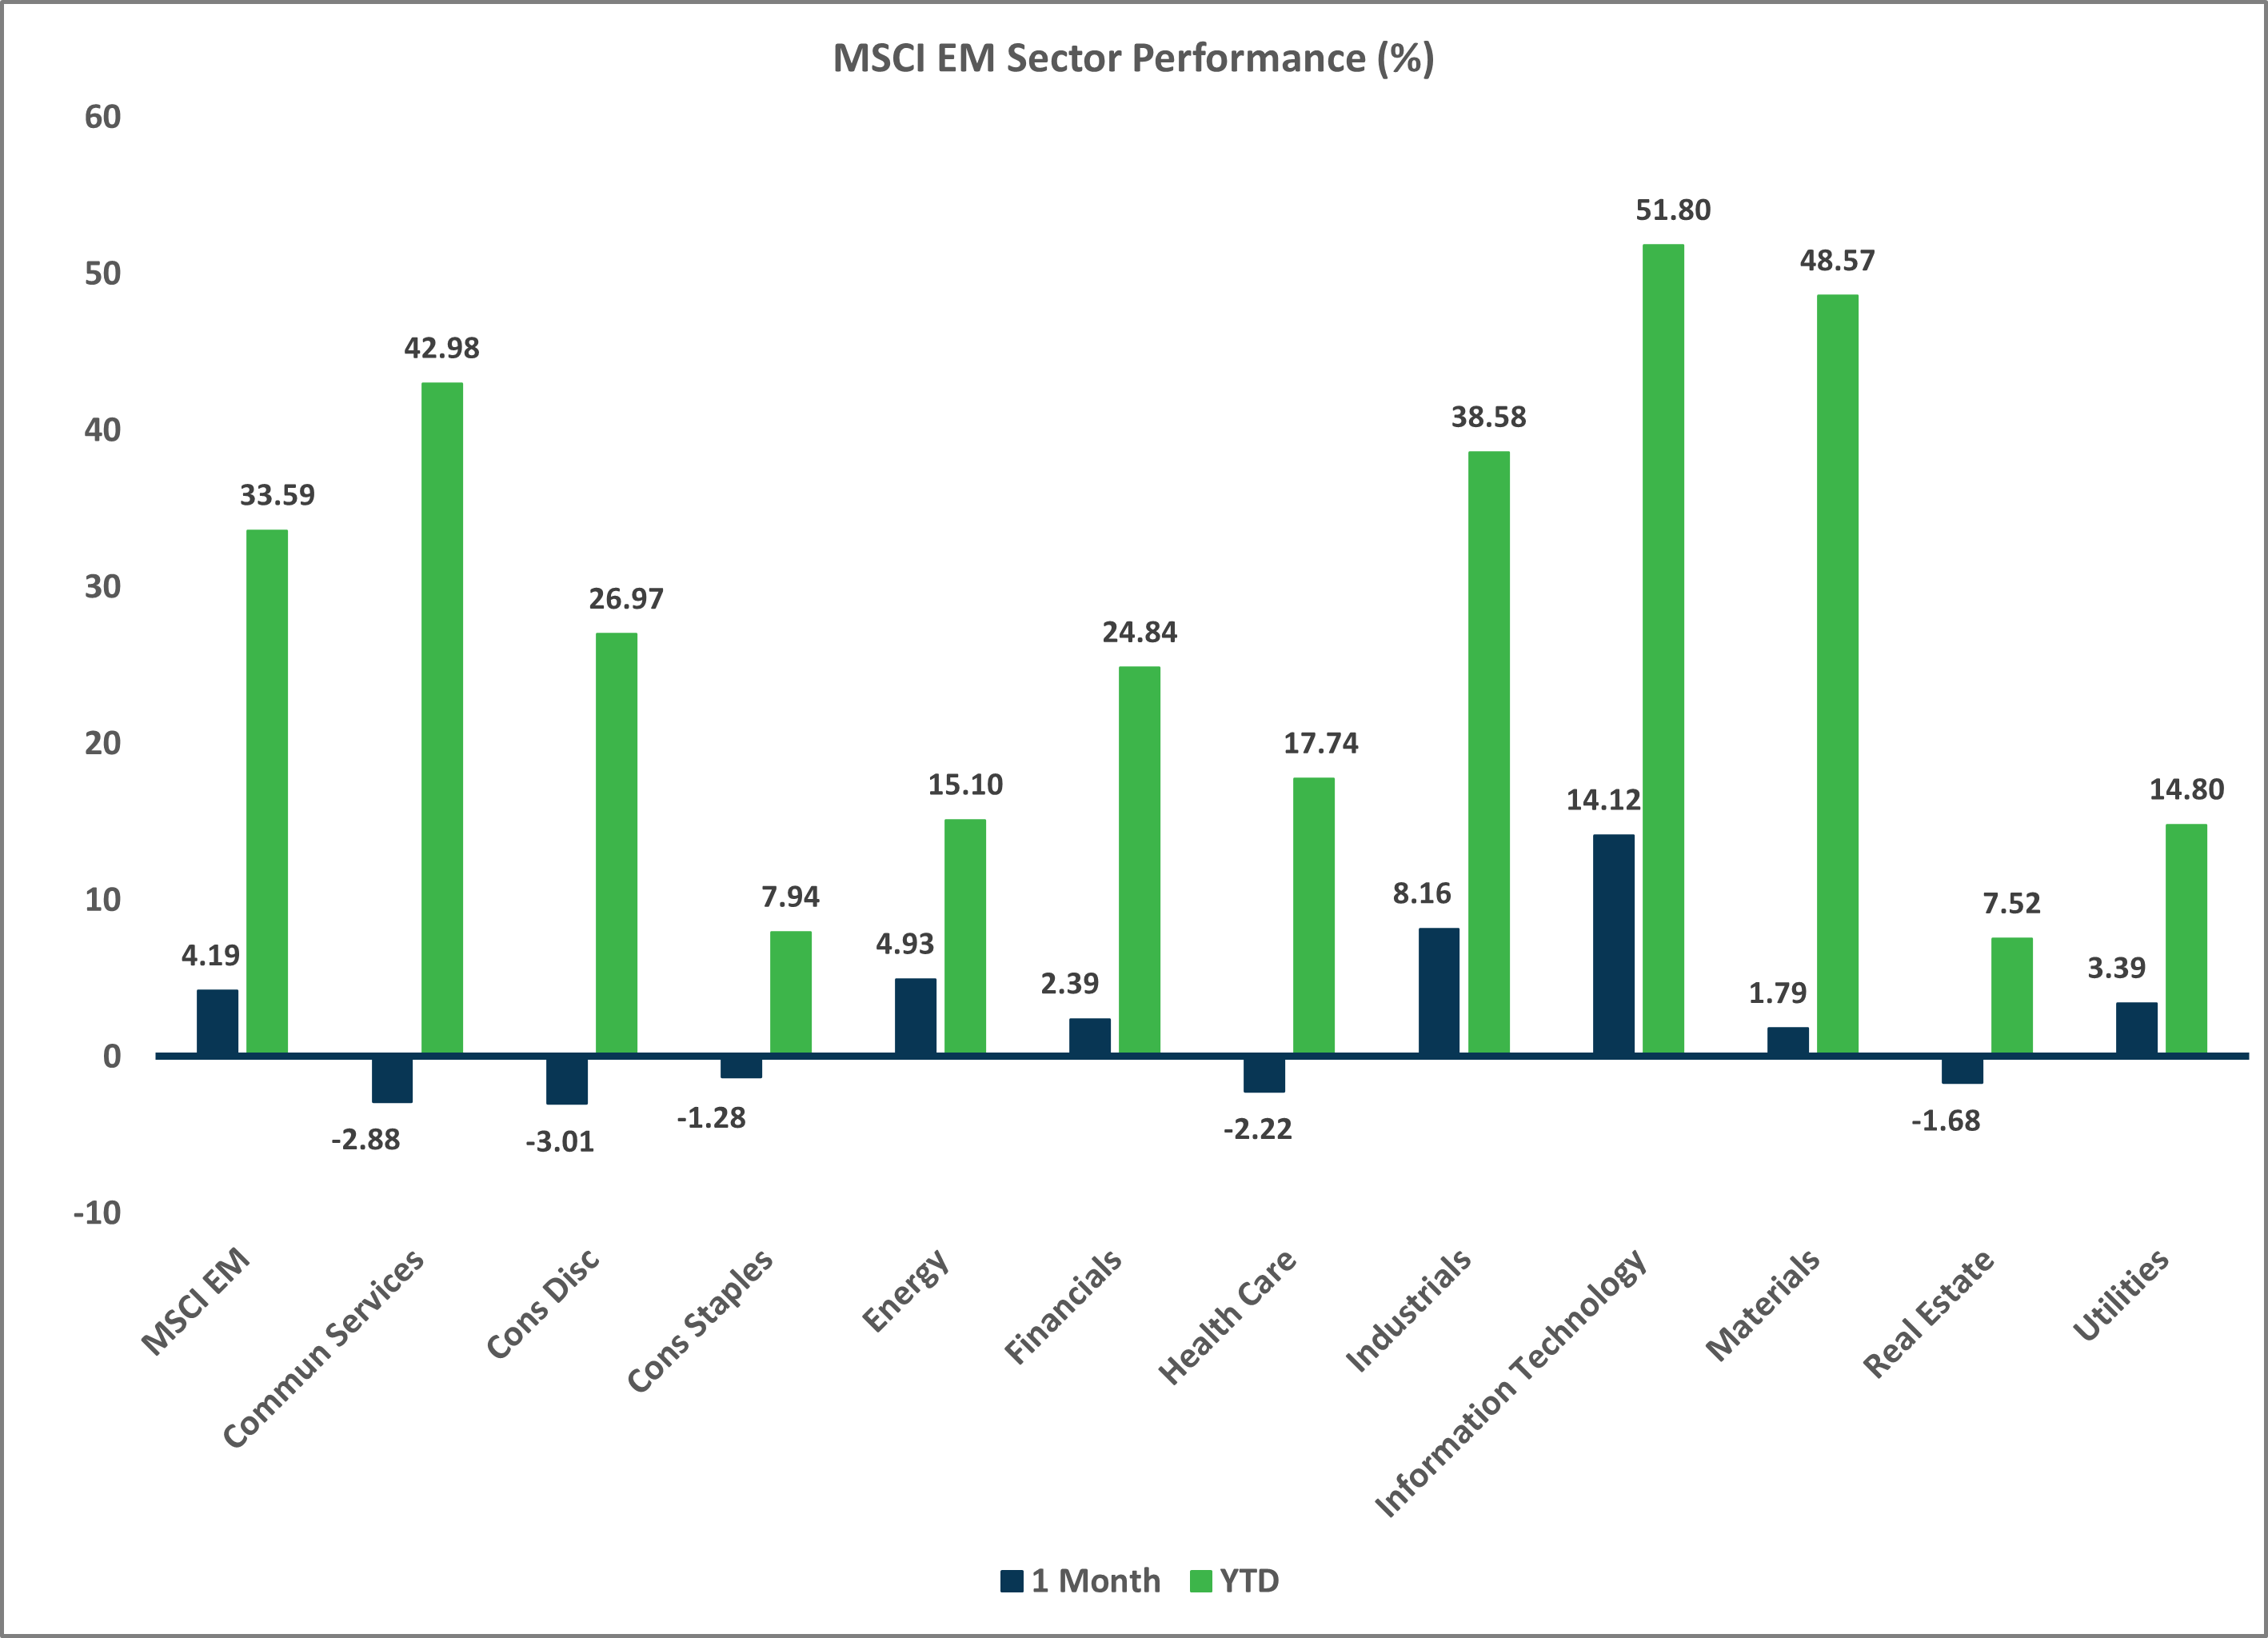
- Stocks outside the U.S. posted modest gains, with some outsized performance from emerging markets.
- Similar to what occurred in the U.S., large caps outpaced small caps and growth stocks beat value stocks.
- EM performance was driven by Eastern Europe and Asia ex-China.
- USD strength cost investors 223 bps in EAFE returns and 43 bps in EM returns.
Sector Performance – S&P 500 (as of 10/31/25)
Sector Performance – Russell 2000 (as of 10/31/25)
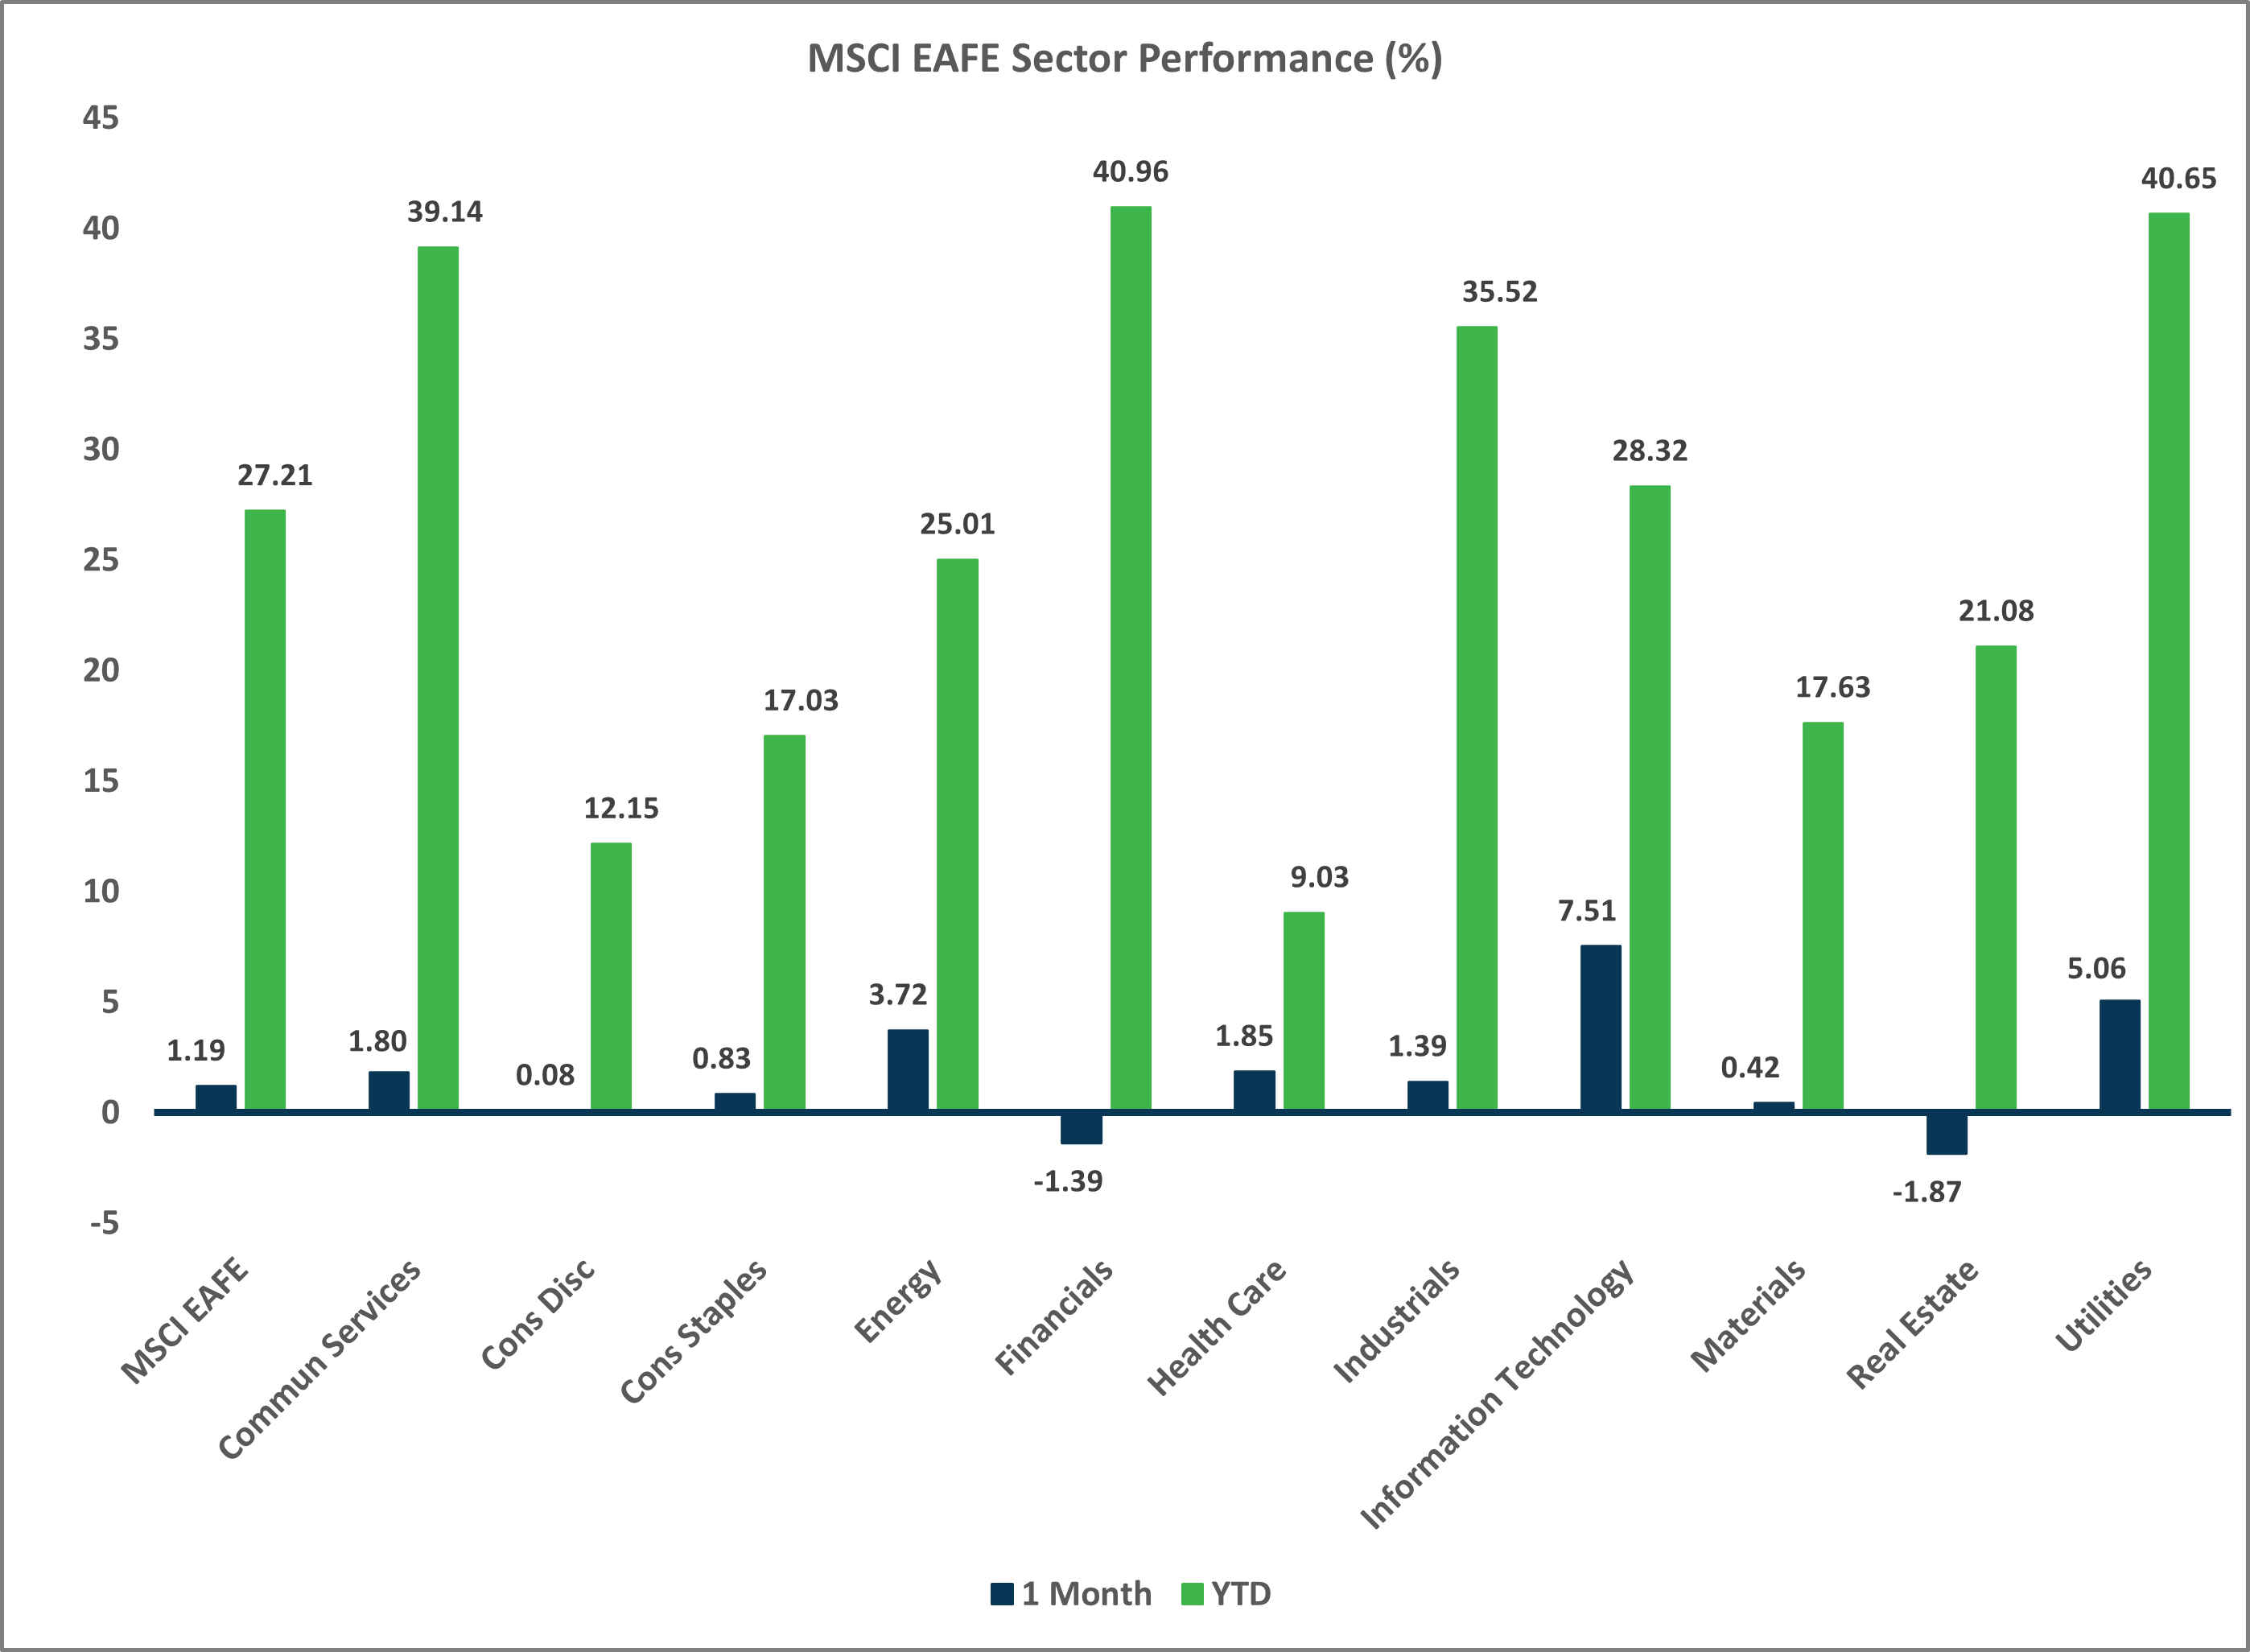
Sector Performance – MSCI EAFE (as of 10/31/25)
Sector Performance – MSCI EM (as of 10/31/25)