Market Flash Report | September 2025

Economic Highlights
United States
- U.S. employers added just 22,000 new jobs to the economy in August, well below the 75,000 estimate. The unemployment rate increased to 4.3% and while the July report was revised slightly higher, the June report was revised down. Average hourly earnings grew 0.3% M/M, or 3.7% Y/Y. The broader U6 unemployment rate surged to its highest level since October 2021 at 8.1%. In addition, the U.S. Bureau of Labor Statistics’ annual revision showed a drop of 911,000 jobs from the economy for the year prior to March 2025. Combined together, labor markets are clearly weakening and this provided sufficient support for the Federal Reserve to cut rates at its September meeting. Another weak reading came from the September Automatic Data Processing report on private payrolls, which fell by 32,000 versus the estimate for a 45,000 job gain. As of 10/1/25, there is a 99% chance of a 25 bps rate cut at the October meeting.
- U.S. GDP grew faster than expected in Q2, based on the final reading from the Commerce Department. Growth of 3.8% was revised higher from 3.3%, driven mainly by upward revisions to consumer spending (2.5% now vs. initial 1.6% estimate). The Atlanta Fed estimates that GDP continued to power through at a robust pace in Q3, forecasting growth of 3.3%.
- The ISM Manufacturing PMI showed slight strength in September, with the headline reading increasing from 48.7 in August to 49.1 in September. While manufacturing remains in contraction territory, the production and employment components strengthened but were offset by weakness in new orders and prices. A lot of businesses cited tariffs as an overall impact to business conditions in the manufacturing sector of the U.S.
- Retail sales in the U.S. increased 0.6% M/M in August 2025, the same as an upwardly revised 0.6% rise in July and beating market expectations of a smaller 0.2% gain. Sales excluding food services, auto dealers, building materials stores and gasoline stations, which are used to calculate GDP, jumped 0.7%. Durable goods orders in the U.S. surged 2.9% M/M in August, beating expectations and rebounding from July’s 2.7% decline. Orders for non-defense capital goods excluding aircraft, a closely watched proxy for business spending plans, rose by 0.6% in August.
Non-U.S. Developed
- Eurozone business activity grew at its fastest pace in 16 months in September but remained modest as new orders stagnated after briefly expanding in August, potentially raising concerns about the sustainability of economic growth. Services in the eurozone drove the overall expansion, with the sector's PMI rising to 51.4 from 50.5 in August, the highest reading in 9 months. However, manufacturing lost momentum with its headline index dropping into contraction territory at 49.5 from 50.7 in August. Germany was a key driver of growth in September while France saw activity decrease for the thirteenth consecutive month.
- Eurozone inflation held steady at 2.2% in September, with core inflation sitting at 2.3%. Most of the increase was due to energy price base effects, which should subside in the coming months. The stronger euro and falling commodity prices should help bring down inflation moving forward. For now, the European Central Bank should remain on hold for future rate cuts.
- Japan's economy expanded much faster than initially estimated in Q2, driven by upward revisions in private consumption and inventories. GDP grew at an annualized rate of 2.2% in Q2, up from the 1% initial reading. Concerns over tariffs should keep the Bank of Japan on the sidelines for any immediate interest rate hikes.
Emerging Markets
- China's manufacturing activity shrank for a sixth month in September, according to an official survey suggesting companies are waiting for further stimulus to boost domestic demand, as well as clarity on a U.S. trade deal. The official manufacturing PMI rose to a six-month high of 49.8 in September versus 49.4 in August. A separate private-sector survey of smaller factory managers from RatingDog showed the fastest expansion since March, buoyed by rising new orders and accelerated production growth, including an uptick in new export orders. Production drove most of the improvement, driven by manufacturing of equipment, high-tech and consumer goods, with notable gains in both output and new orders.
- The official non-manufacturing PMI, which includes services and construction, edged lower to 52.9 in September from 53 in the prior month while the RatingDog general services PMI eased to 50 from 50.3.
- Economists believe recent data in China suggest a strong case for further stimulus and policy support in the coming months. China’s economy expanded by 5.3% in the first half of 2025, putting the country on track to meet its full-year growth target of 5%. The government may tolerate a slowdown in H2 as long as it doesn’t jeopardize the full-year growth target of 5%.
- India’s economy grew at a faster-than-expected annual rate of 7.8% in Q2, boosted by the manufacturing, construction and service sectors. The Reserve Bank of India (RBI) has raised its projection of India's GDP growth rate to 6.8% for 2025-26 from 6.5%. The RBI believes the Indian economy has been more resilient in 2025 and some structural reforms should provide a boost later in the year. The World Bank and International Monetary Fund project that the country’s economy will grow 6.3% and 6.4%, respectively, for the fiscal year 2026.
Fixed Income
- Interest rates across the globe continued to trend lower in September, leading to gains in core fixed income and municipal bonds.
- The combination of higher starting yields and tighter credit spreads led to nice gains across credit.
- Bonds outside the U.S. benefited from the decline in the U.S. dollar, which helps boost non-U.S. asset prices.
U.S. Equities
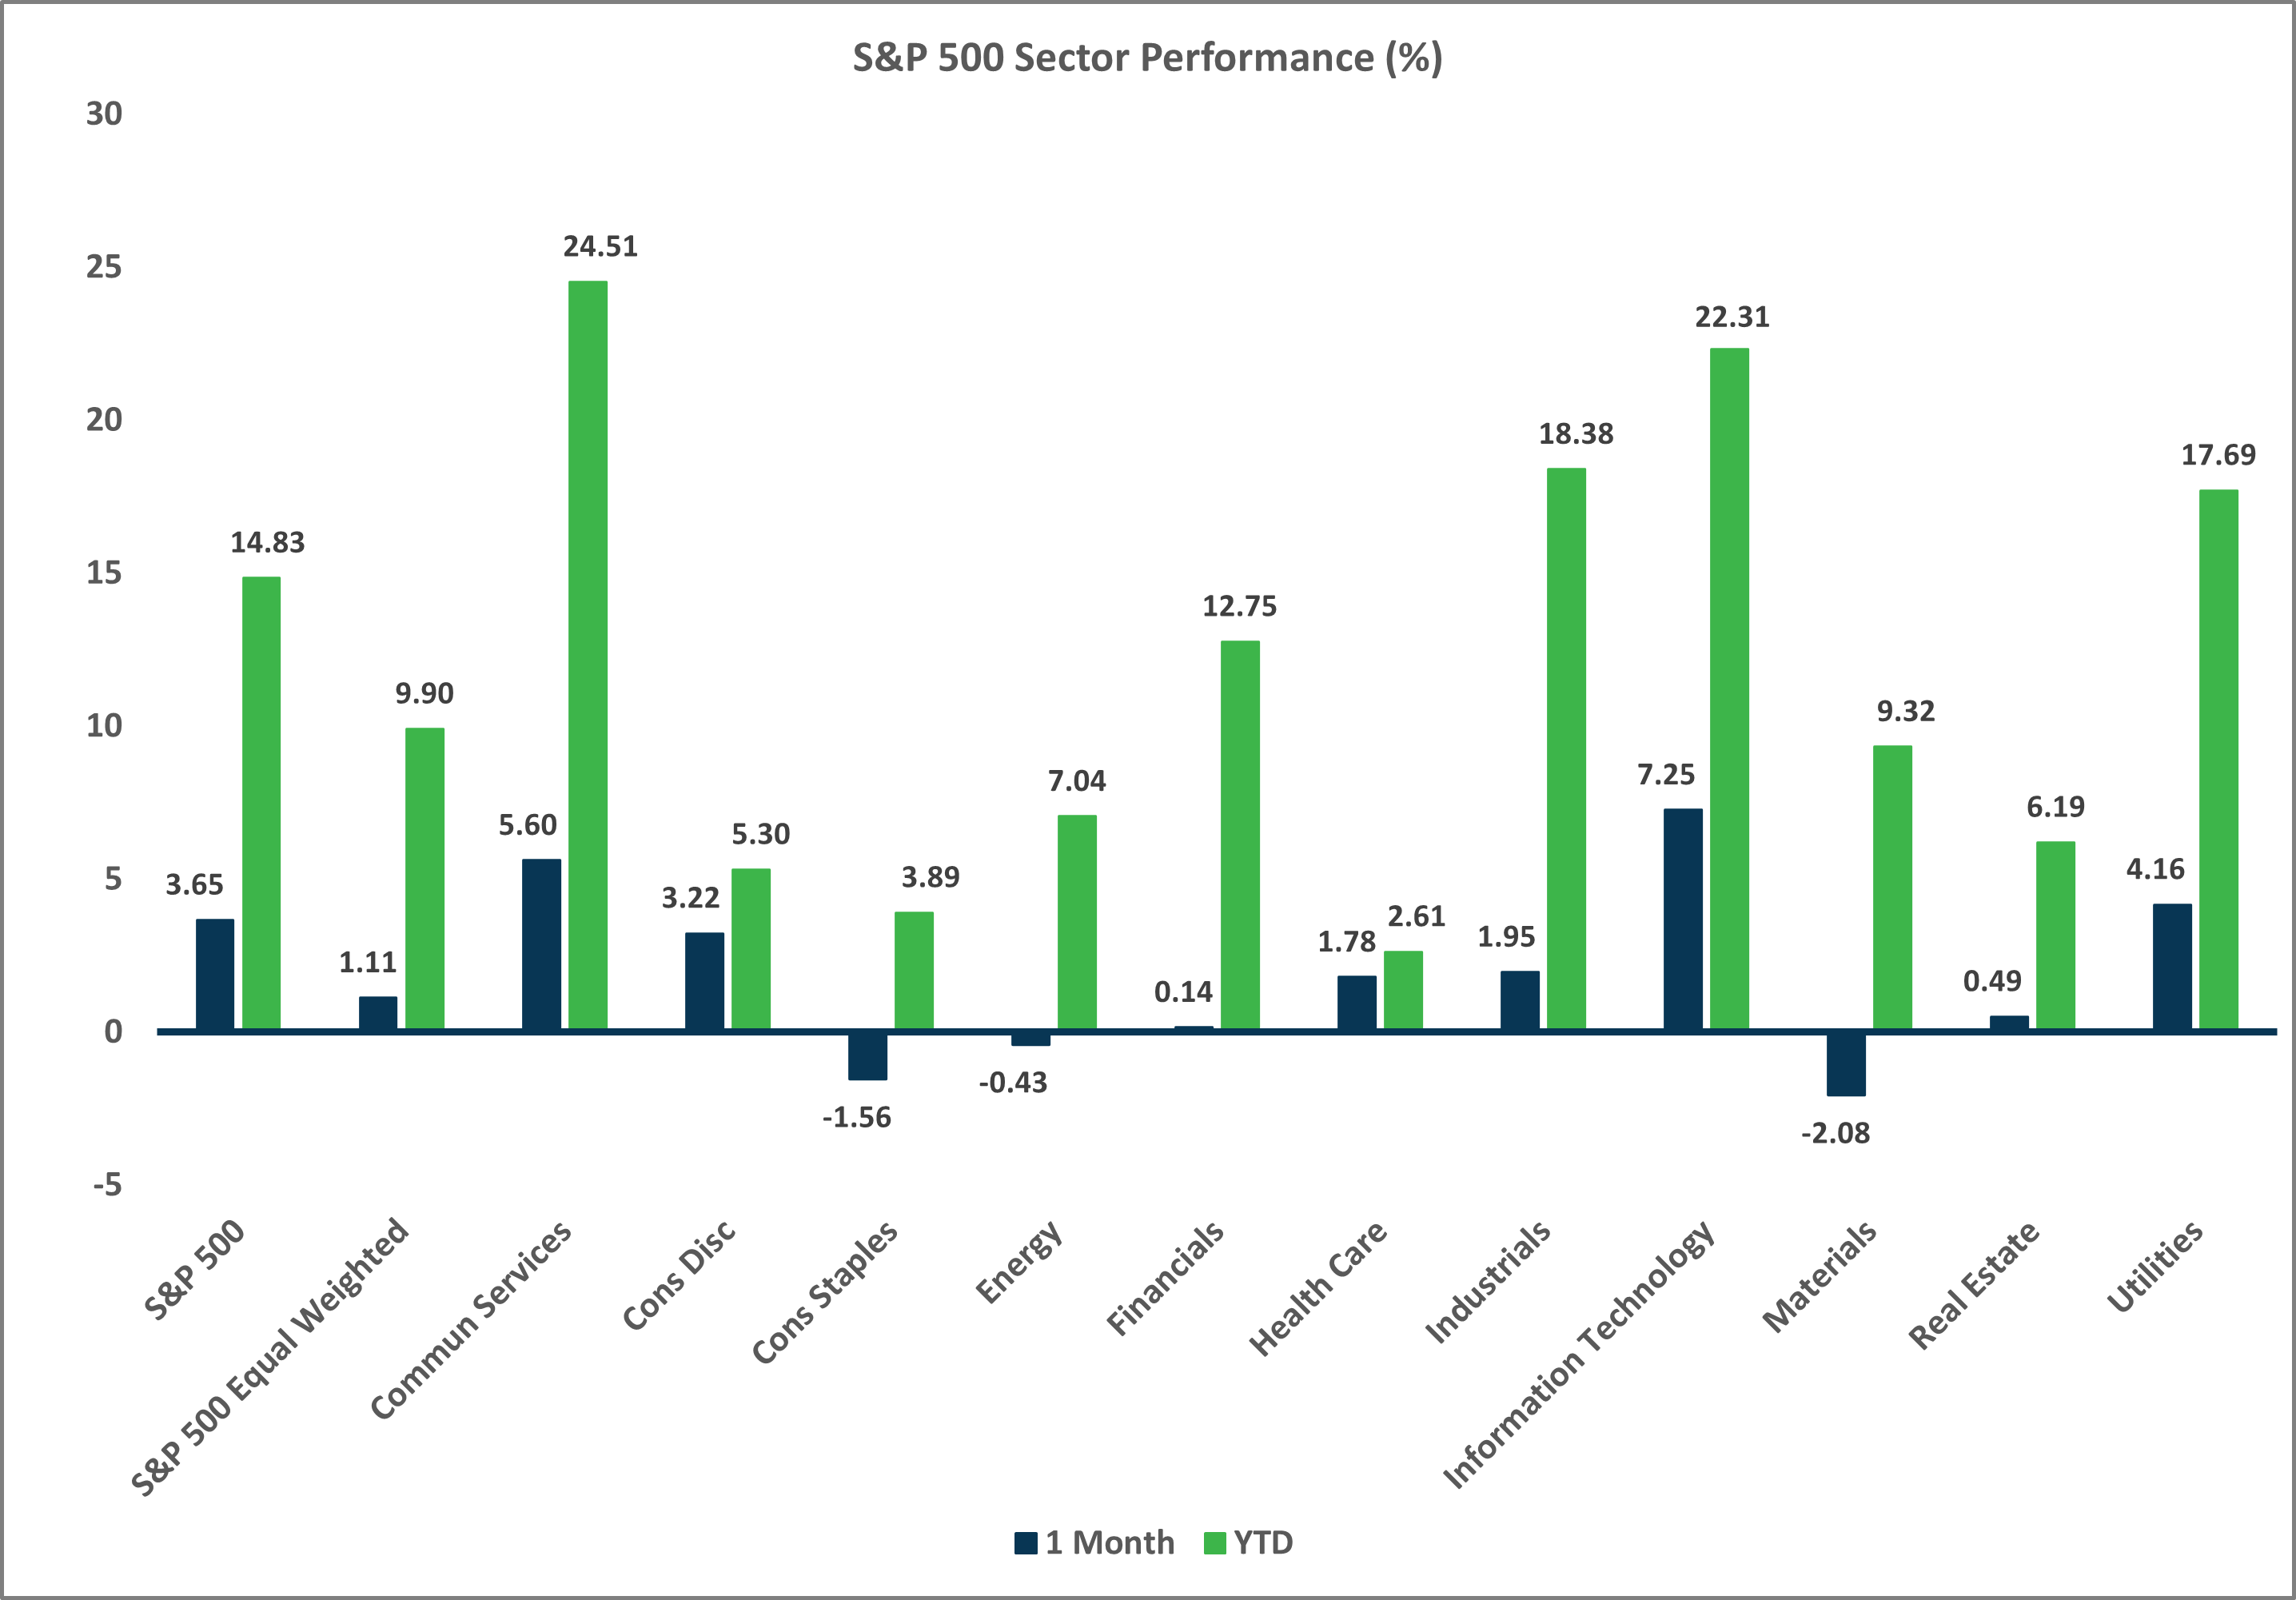
- U.S. equities gained ground in September, fueled by strong returns from tech/growth stocks.
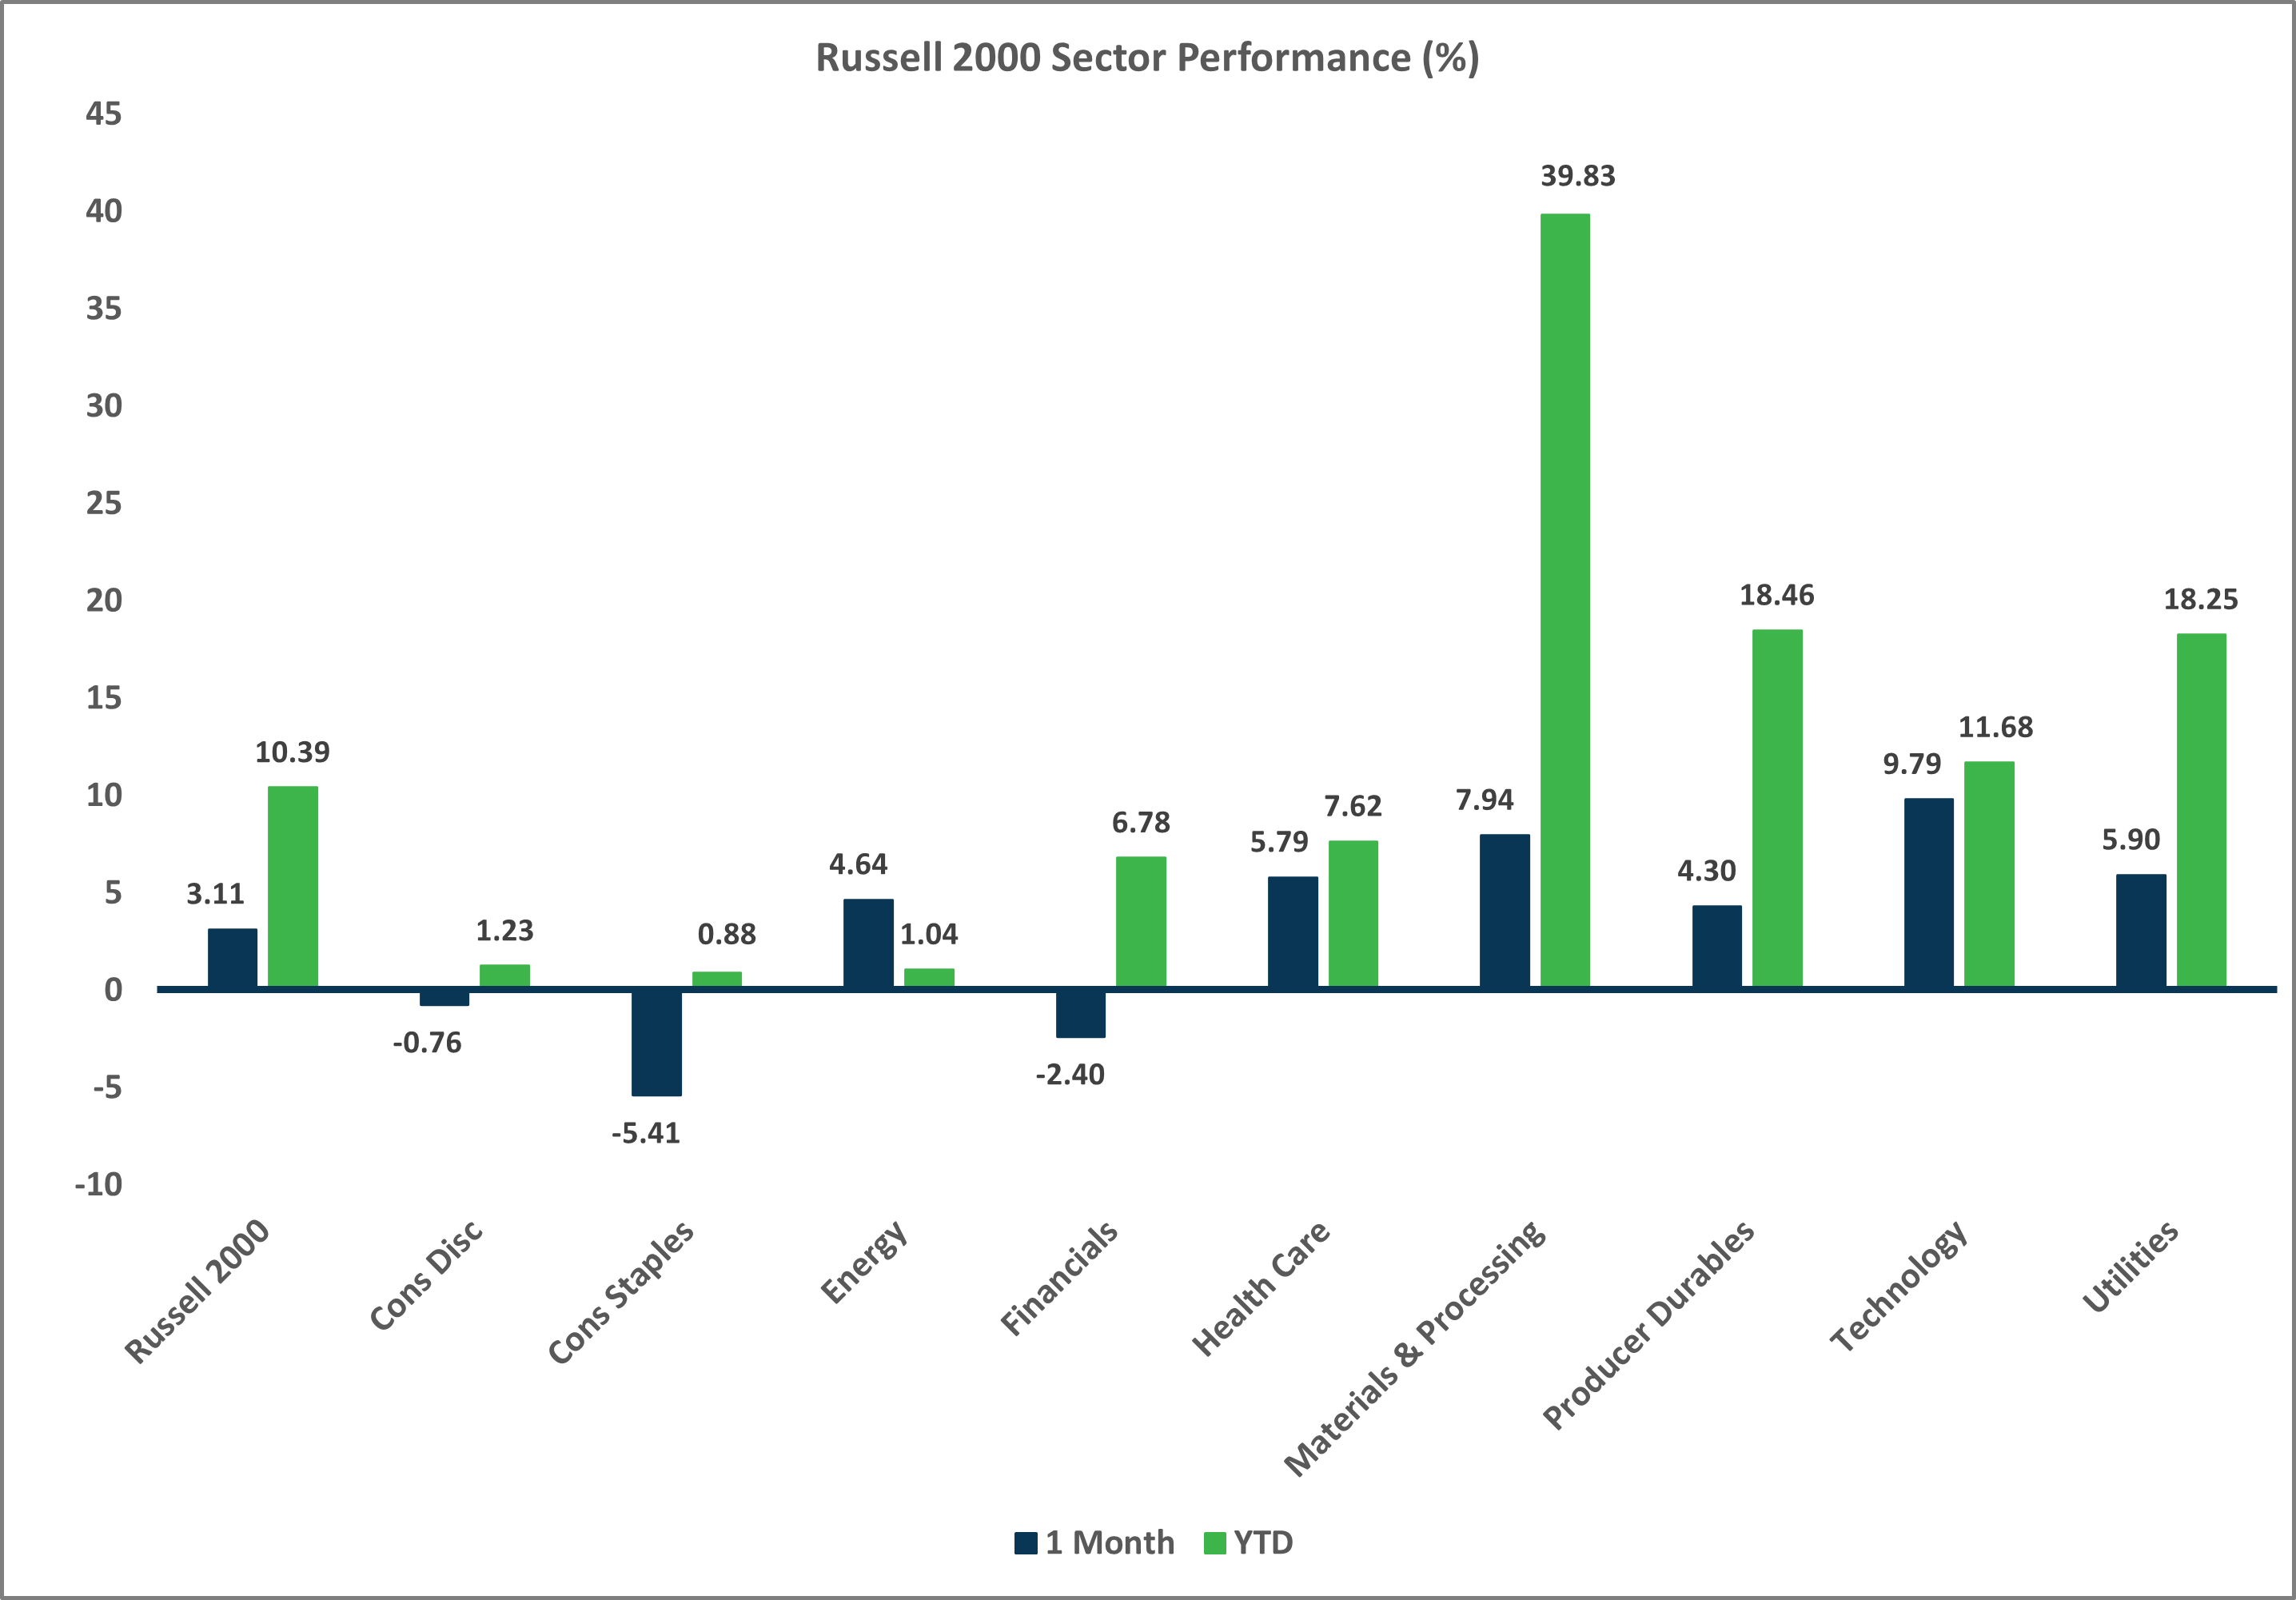
- Growth beat value across all market capitalizations and large caps slightly outperformed small caps.
- After a slow start to the year, U.S. equities have posted a very solid V-shaped recovery.
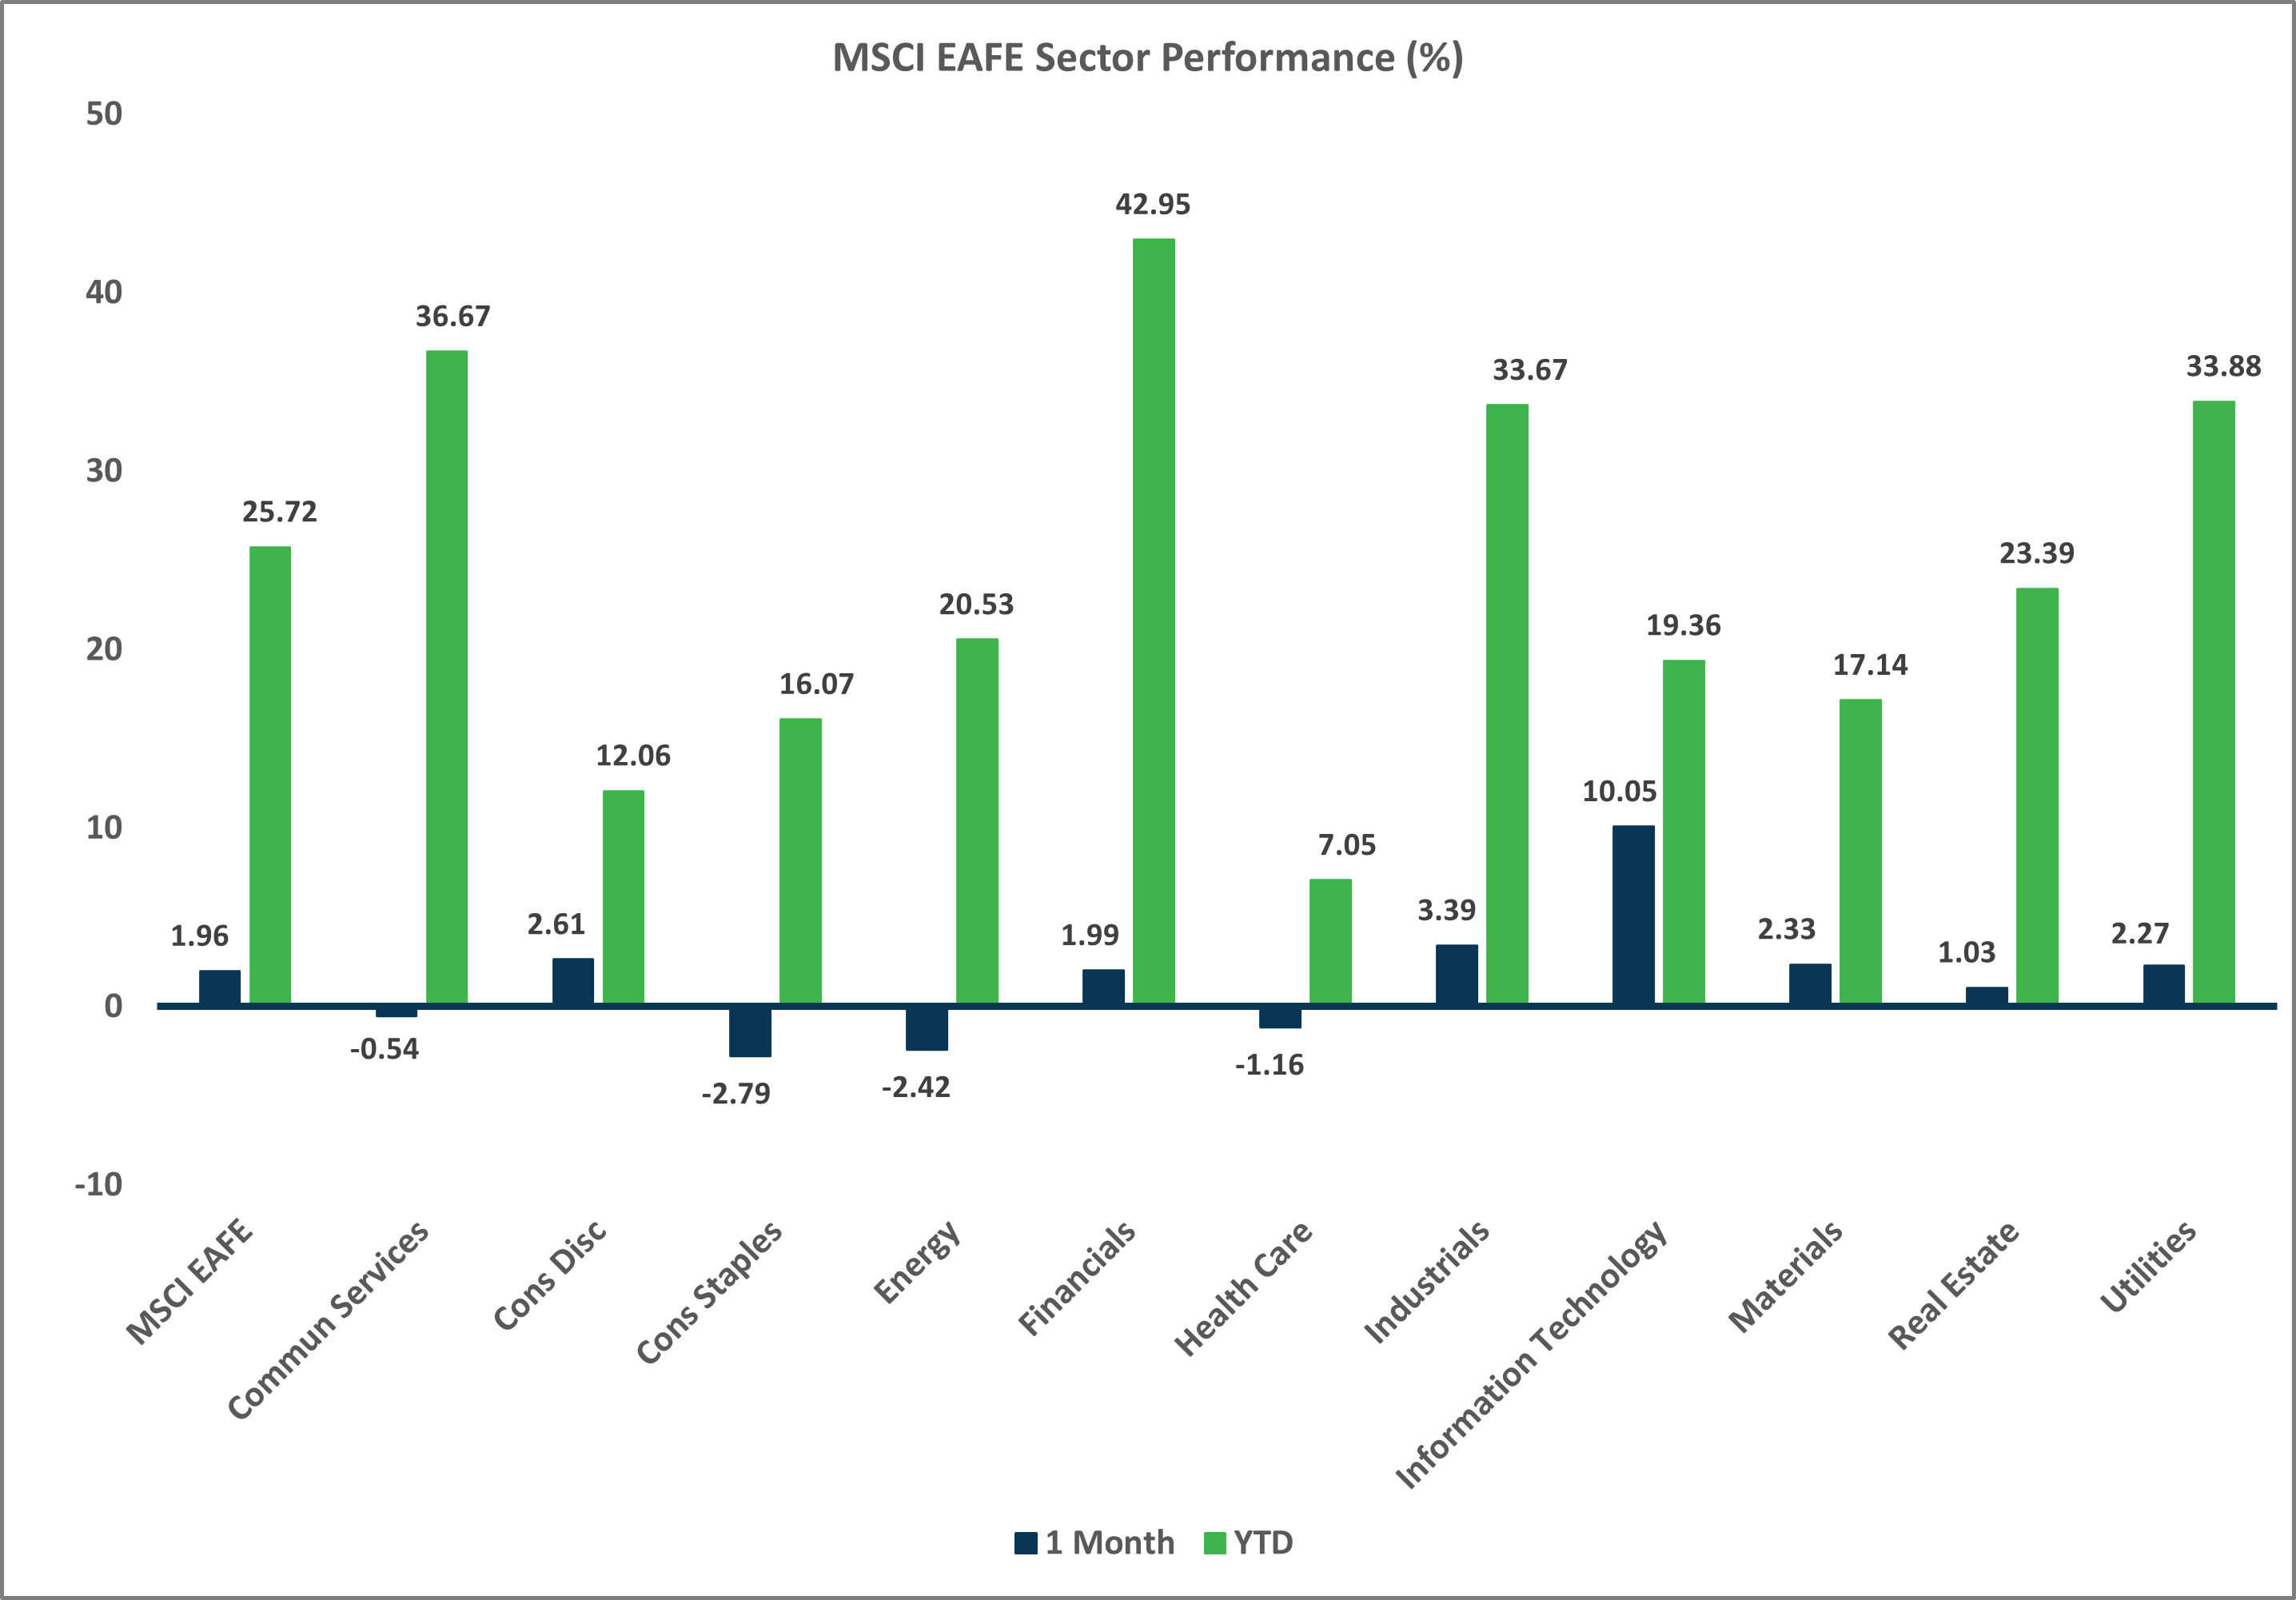
Non-U.S. Equities
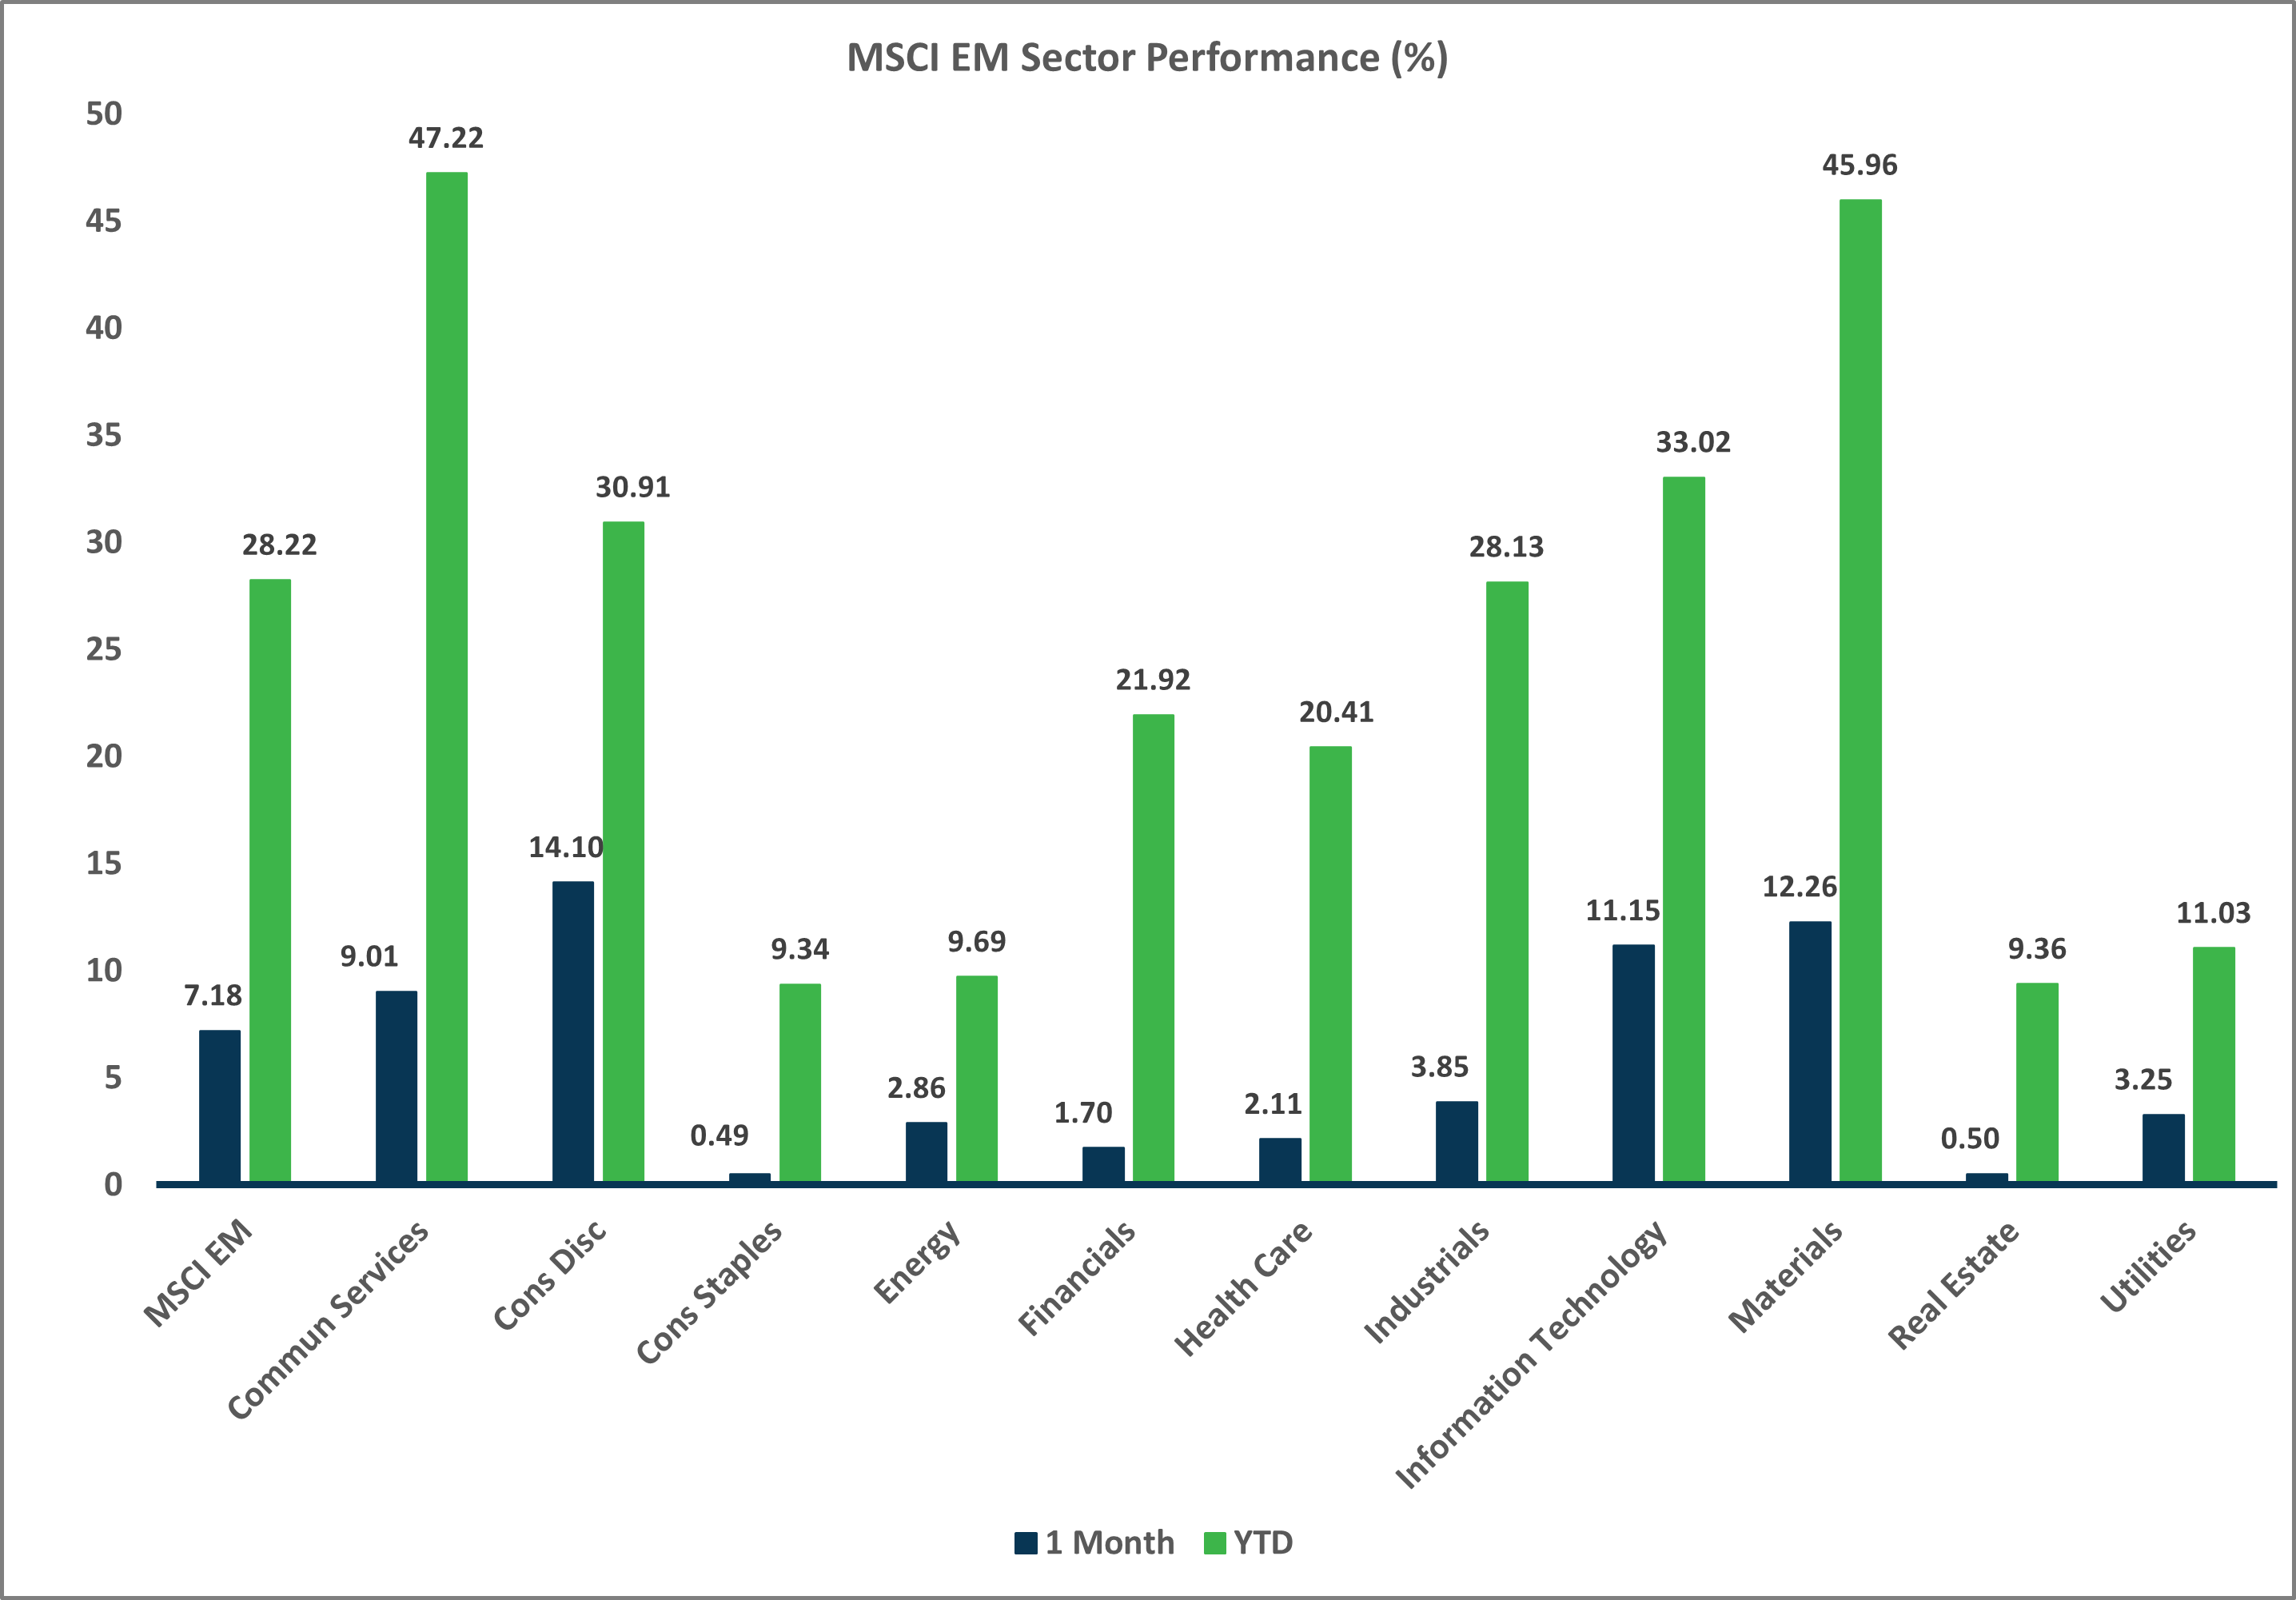
- Stocks outside the U.S. posted solid gains last month, driven by emerging markets and U.S. dollar weakness.
- Similar to the trend in the U.S., growth beat value and large caps outpaced small caps.
- EMs rose more than 7%, driven by strong gains in China and Latin America.
- USD weakness added 12 bps to EAFE returns and 10 bps to EM returns.
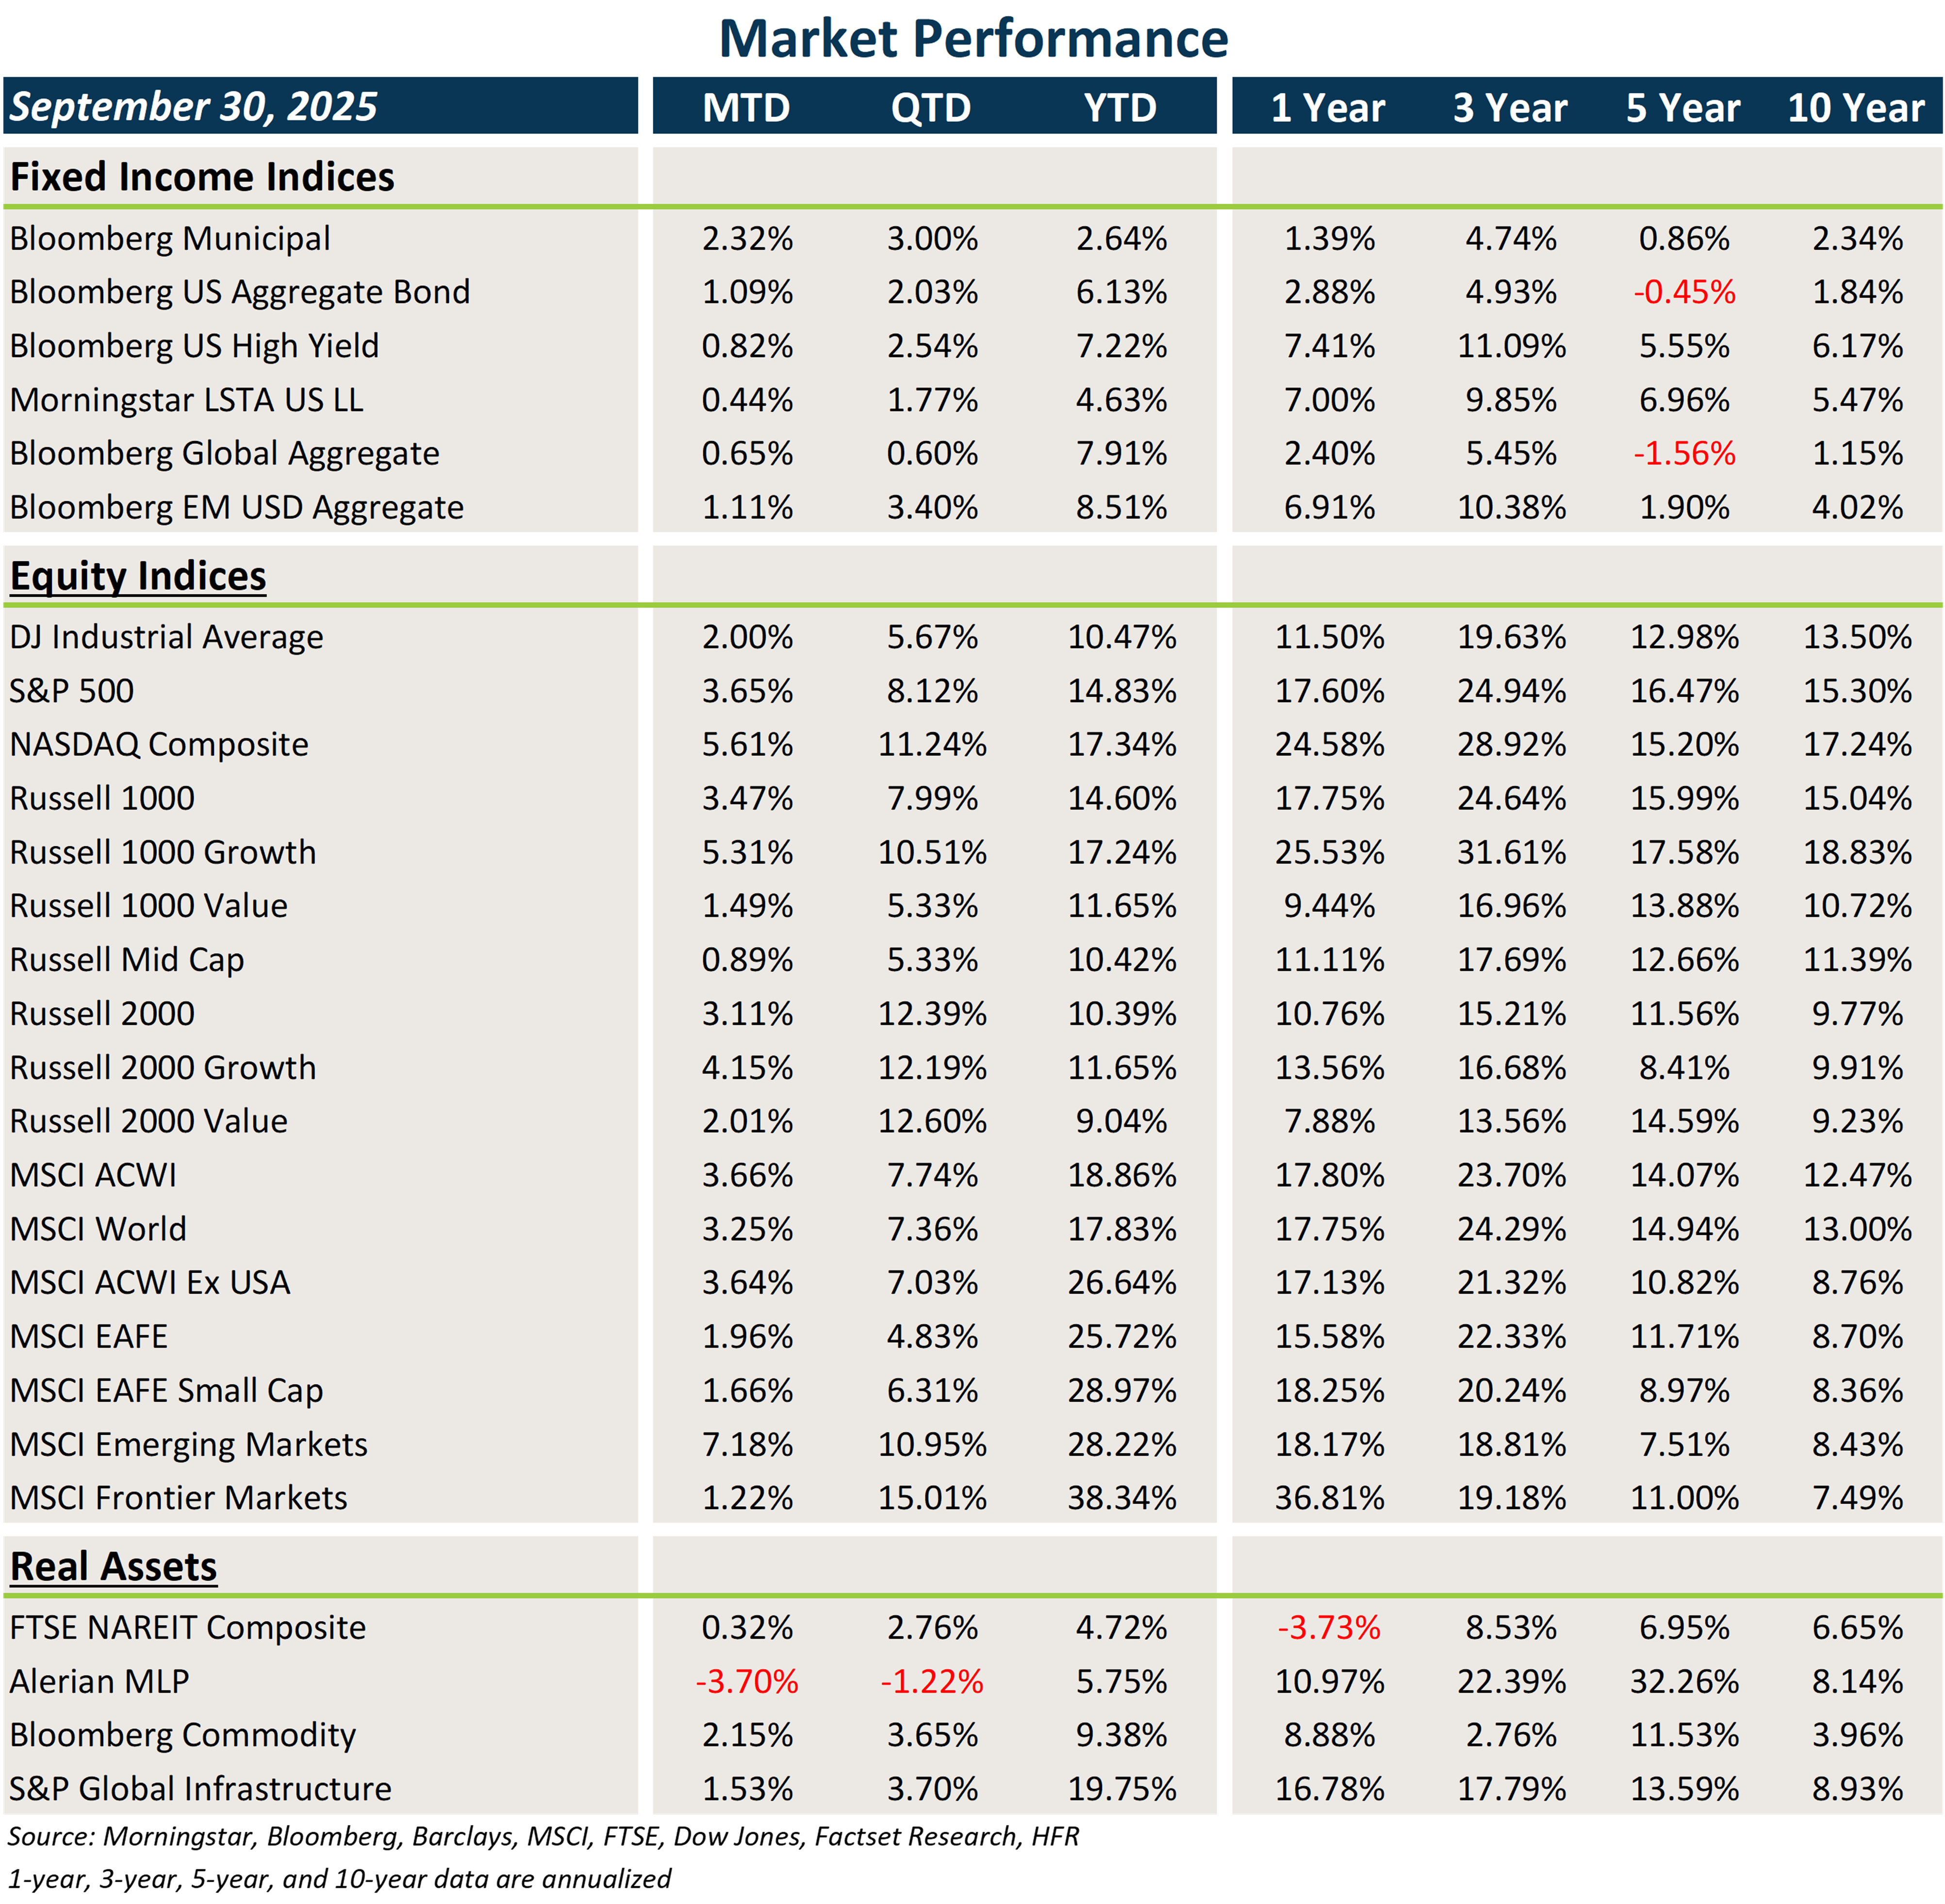
Market Performance (as of 9/30/25)
Sector Performance – Russell 2000 (as of 9/30/25)
Sector Performance – MSCI EAFE (as of 9/30/25)
Sector Performance – MSCI EM (as of 9/30/25)