
2021 Q1 Summary
- Equity markets performed strongly in the first quarter of 2021 as investors become increasingly optimistic about a “return to normal”.
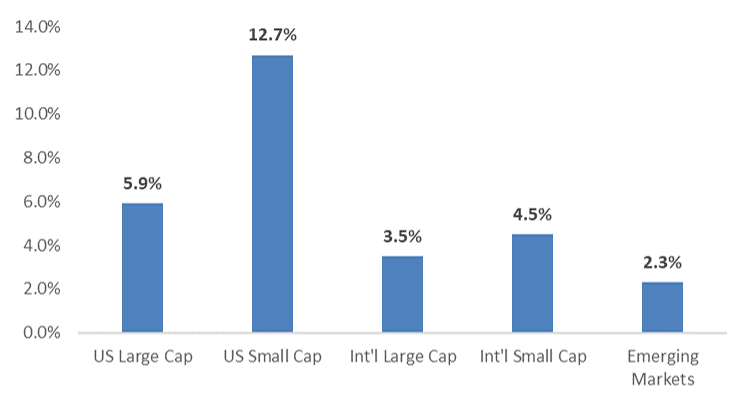
- US Stocks outperformed International and Emerging Market equities.
- US Small Cap stocks booked the strongest performance of any major equity asset class.
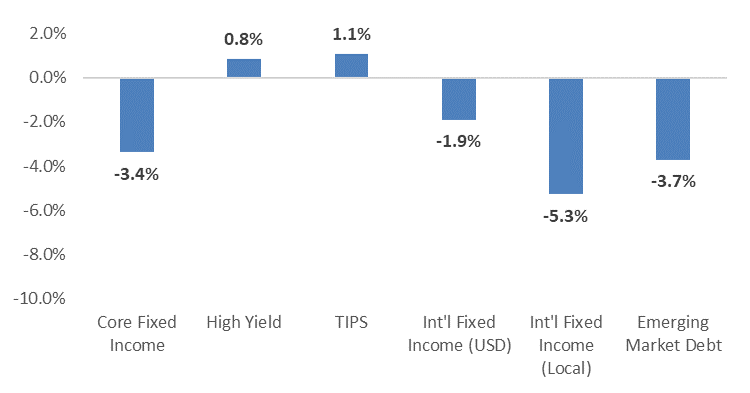
- Fixed Income markets struggled as economic growth and inflation expectations increased during the quarter.
- Fixed income markets across the globe sold off as many investors began to price in the potential for higher interest rates.
- TIPS and High Yield were the only major fixed income asset classes to post gains in the first quarter.
Equity Performance Q1 2021
Fixed Income Performance Q1 2021
2021 Theme: The Virus and Vaccines
- US equity markets have grown increasingly optimistic about economic growth due to the progress being made with COVID vaccinations.
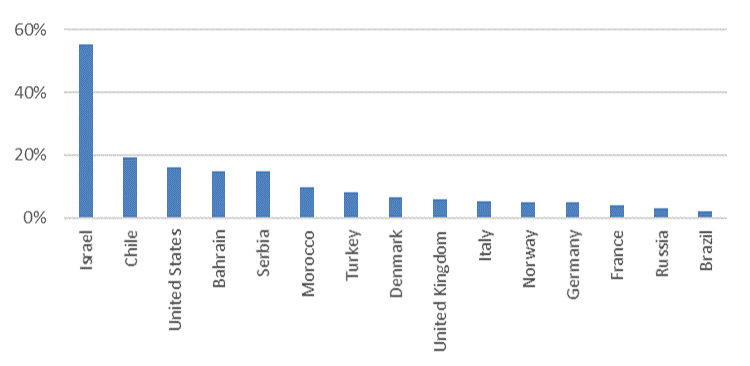
- Few countries are further along in their vaccination programs than the US. Only Israel and Chile have fully vaccinated a higher percentage of their populations.
- Most of the developed world struggled with the beginning of their vaccination rollouts but have made strides to pick up the pace of vaccinations in recent weeks.
- The UK looks set to become the first European country to achieve herd immunity.
Takeaway
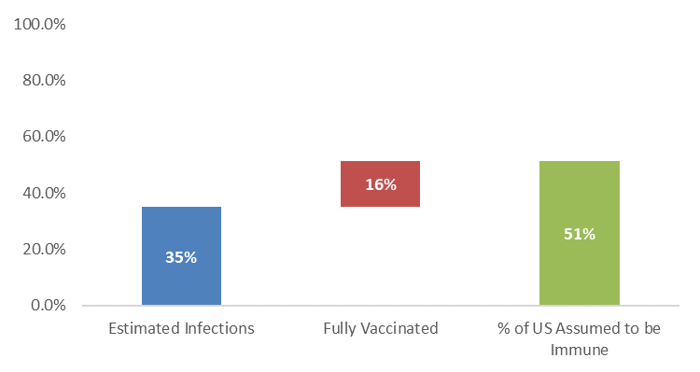
The combination of infections and vaccinations indicates that the US could reach “herd immunity” by the end of the 2nd quarter.
Share of Population Fully Vaccinated Against COVID-19
US Progress to Herd Immunity
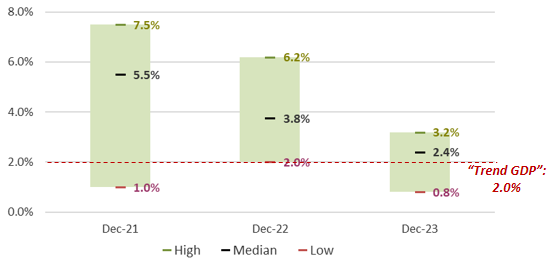
2021 Theme: Above Trend Economic Growth
Economic Growth
- Due to the progress of vaccinations and the potential release of pent-up demand, a surge of economic activity is expected in the second half of 2021.
- In 2021, the US is likely to have its highest level of economic activity in decades.
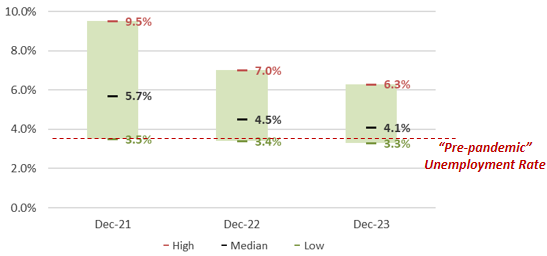
Unemployment
- Unemployment has continued to decline from its peak in the spring of 2020.
- Recent employment data has indicated that many of the industries most impacted by the pandemic (hospitality, travel, entertainment, etc) are beginning to add staff.
- Despite the progress, it is likely that the level of unemployment in the US will remain above its pre-pandemic level through the end of 2021.
Takeaway
Markets have been expecting a strong recovery in 2021, which is already reflected in asset prices.
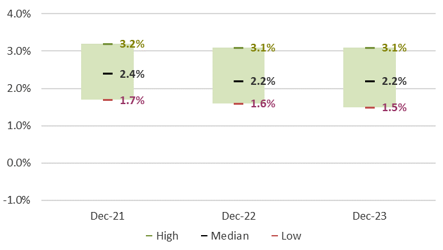
Range of US Economic Growth Forecasts
Range of US Unemployment Projections
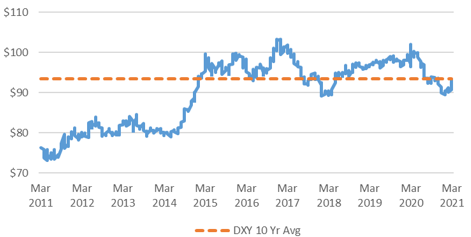
2021 Theme: US Dollar Weakness
- The US dollar strengthened in the first quarter as US interest rates moved higher and international economies struggled with vaccination rollouts.
- Despite its recent strengthening, the dollar is likely to depreciate relative to many international currencies due to the following:
- Coordinated global economic growth is likely to lead to “capital flight” out of the US and into International/Emerging Market economies.
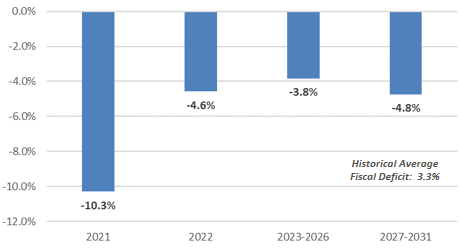
- Explosive growth of money supply and expanding US fiscal deficit as a result of stimulus measures.
Takeaway
The value of the dollar will likely weaken as international economies began to reopen in the months ahead.
US Dollar Index
Fiscal Deficit Projection (as a % of GDP)
2021 Theme: Reflation
- Although the risk of significantly higher levels of inflation remain low, inflation expectations are likely to move higher in 2021.
- Any increase in inflation expectations is likely to be short term in nature.
- Inflationary expectations are likely to increase over the short term due to:
- Explosive growth in US money supply as a result of massive stimulus measures.
- The Federal Reserve’s commitment to achieve “above target” inflation over the short term.
- An imbalance between supply and demand that results from the release of “pent up demand” and existing supply chain issues.
Takeaway
Although price levels are expected to increase meaningfully in the months ahead, the risk of “run away inflation” is low.
Range of US Inflation Forecasts
2021 Theme: Low Rates
- Despite the strong economic outlook, the Fed has continued its commitment to loose monetary policy for the foreseeable future.
- The Fed will not raise rates until its unemployment and inflation targets are met.
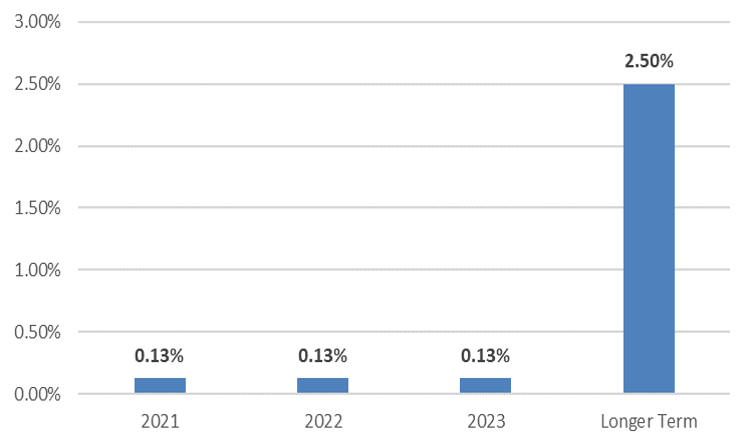
- Estimated short term inflation target: Around 2.5%.
- Estimated unemployment target: Around 4%.
- Before the Fed raises its short term policy rate, it will begin to trim its “quantitative easing program” first.
- Although the Fed may begin to discuss this option publicly in 2021, it is likely meaningful changes will not occur in 2021.
Takeaways
- Short term interest rates likely will not change until 2022- at the earliest.
- Any plans to “unwind” quantitative easing will likely create short term volatility in intermediate and long duration fixed income assets.
Projected Fed Funds Rate Target
2021 Theme: Fiscal Policy
- Since the pandemic began, US Congress has passed a total of 6 stimulus packages totaling nearly $5T.
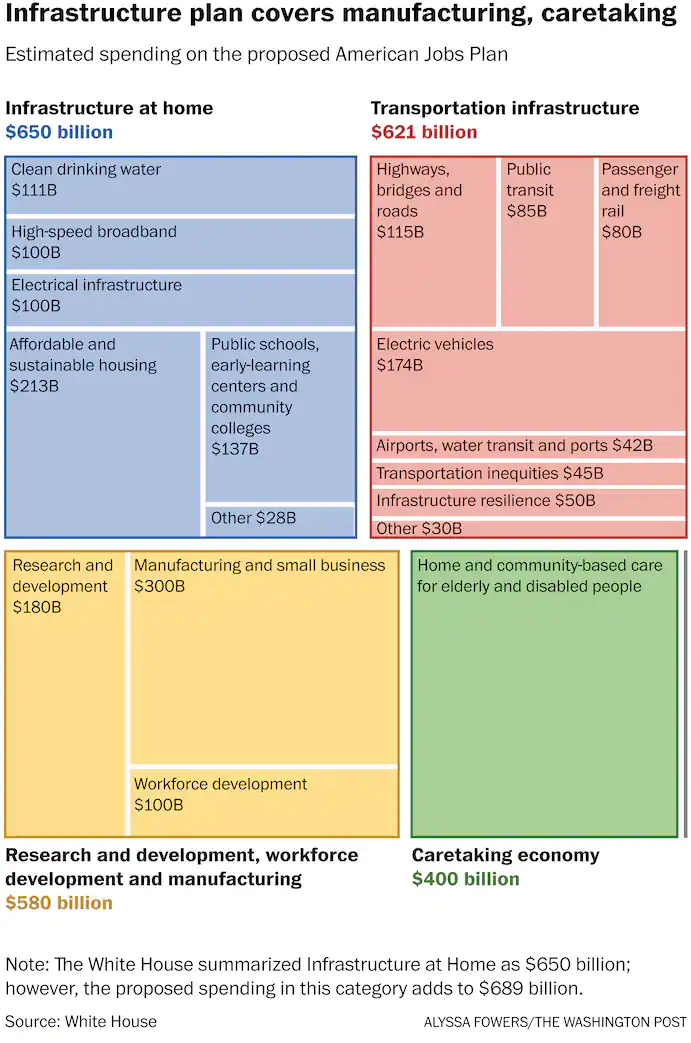
- Another stimulus is being debated in Washington, the “American Jobs Plan”, would provide another $2T in fiscal stimulus.
- The current proposal includes spending on physical and digital infrastructure, research and development, and health care.
- The current proposal is likely to change as it makes it way through the House and Senate.
- It is also possible that another round of fiscal stimulus is debated before year end.
Takeaway
The market has been expecting an “infrastructure” stimulus for some time and much of what is currently expected is already priced into markets.
2021 Theme: Tax Reform
- To fund the next round of fiscal stimulus, the Biden Administration is proposing to reform the current tax code in the following ways:
- Increase the corporate tax rate from 21% to 25-28%.
- Increase the marginal tax rate from 37% to 39.6% for taxpayers earning more than $400K in annual income.
- Increase the capital gains tax rate to 25-28% for households earning more than $1M a year.
- While some of the Biden administration’s tax proposals may not make it into the final bill, a tax bill is likely to pass in 2021 and become effective in 2022.
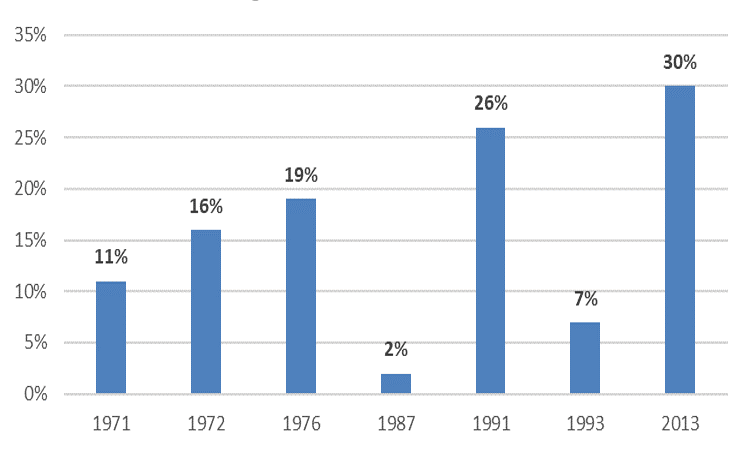
- Even though the potential for higher taxes may concern some investors, historically US equity markets have performed well during years when taxes increased.
- That said, investors should not be surprised if there is a short-term negative reaction on the back of any tax reform.
Takeaway
The prospect of higher capital gains taxes may create the most short-term selling pressure for assets that have generated large gains in recent years (ex: large cap tech).
US Large Cap Equity Returns During Years When Taxes Increased

2021 Playbook: Global Equity
- US equities outperformed International and Emerging Market equities in the first quarter, thanks to significant outperformance during the month of March.
- Emerging markets and International equities struggled to keep up with US stocks due to the latter's strong pace of vaccinations.
- Given the run up in equity prices over the past 12 months, stocks across the globe are rather expensive from a fundamental valuation perspective.
- While equities are far from being “cheap” as an asset class, the most attractive equity asset classes are International and Emerging Market equities.
Takeaway
As global economic recovery takes hold, expect International and Emerging Market equities to outperform US equities.
Relative Valuation
US Large Cap vs International Large Cap
Forward P/E
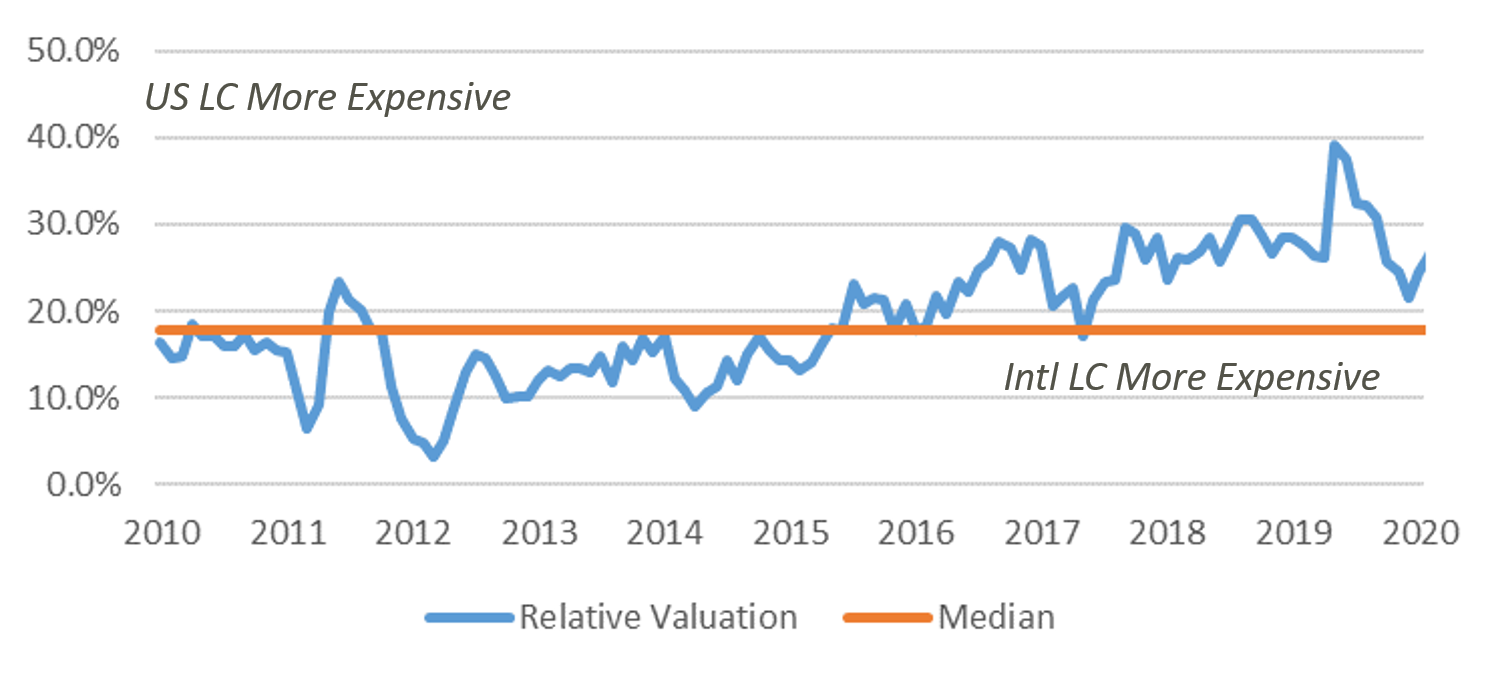
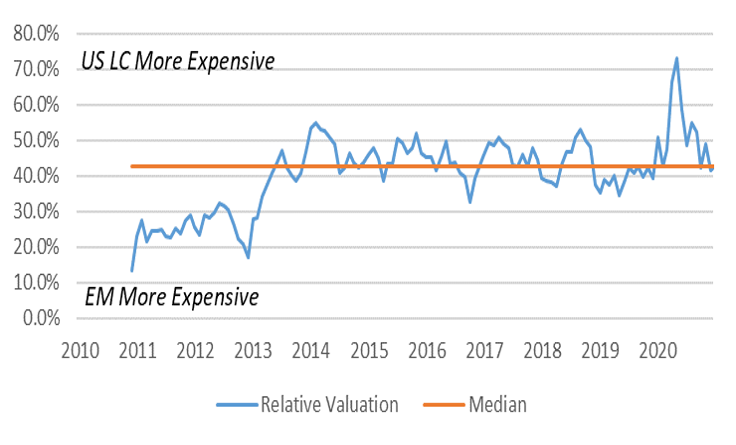
Relative Valuation
US Large Cap vs Emerging Markets
Forward P/E
2021 Playbook: US Equity
- US Small Cap was the strongest performing asset class in 1Q and value outperformed growth.
- Valuations remain high for mega-cap stocks and growth stocks.
- Higher valuations in these asset classes may be harder to justify if interest rates and/or corporate taxes rise within the next few years.
- Despite Value’s recent outperformance, US Large Cap Value looks particularly attractive compared to US Large Cap Growth.
- From a fundamental valuation perspective, US Small Cap stocks look attractive compared to US Large Cap stocks.
Takeaway
As the US economic recovery takes hold, expect Value to outperform Growth and Small Cap to outperform Large Cap.
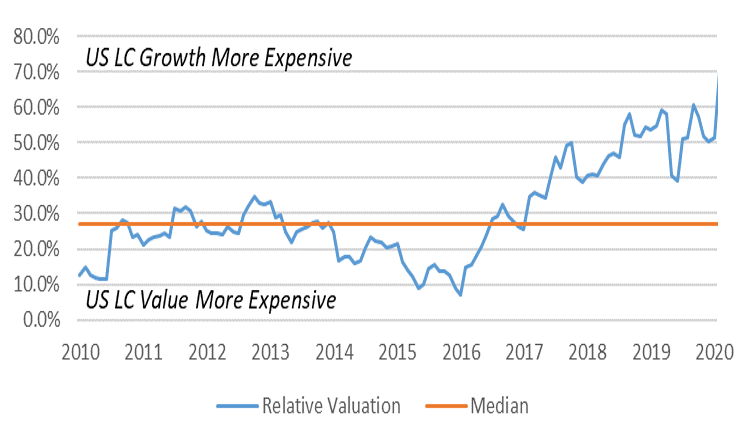
Relative Valuation
US Large Cap Growth vs US Large Cap Value
Forward P/E
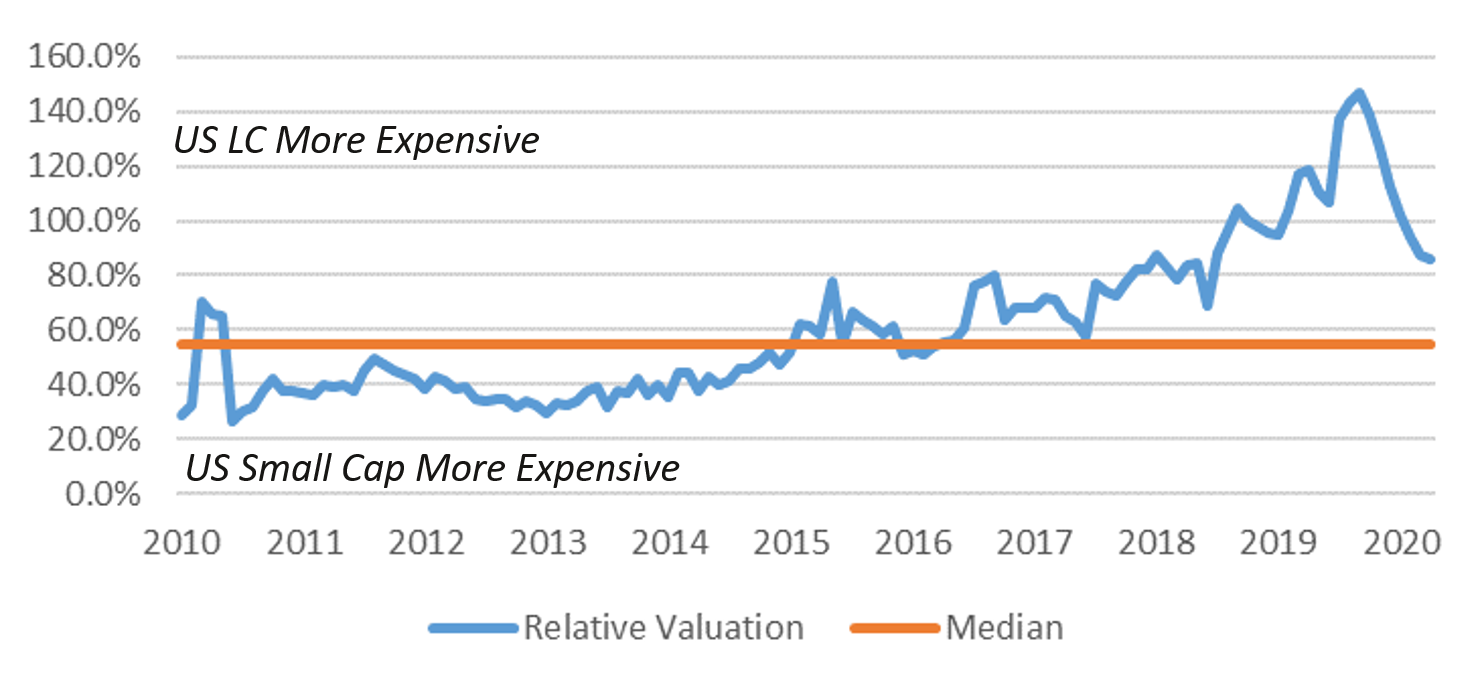
Relative Valuation
US Large Cap vs US Small Cap
Forward P/E
2021 Playbook: Fixed Income
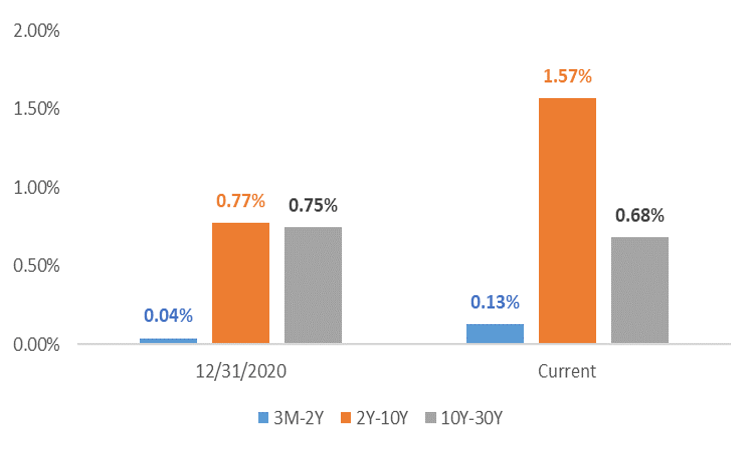
- Yields for longer date investment grade fixed income assets increased significantly in the first quarter.
- A steeper yield curve was not unexpected, but the pace of the steepening caught a lot of investors off guard.
- The yield differential between 2 and 10-year treasuries, for example, more than doubled in the first quarter.
- Short dated yields are likely to stick close to current levels until the Federal Reserve adjusts its monetary policy to become less accommodative.
- While longer dated yields are expected to continue to increase as the economic recovery takes hold, it is likely that the pace of increase is gradual until the Fed signals an adjustments in its monetary policy.
Takeaway
Shorter duration fixed income is likely to continue to outperform longer duration fixed income as the economic recovery gains momentum.
US Treasury Yield Spreads
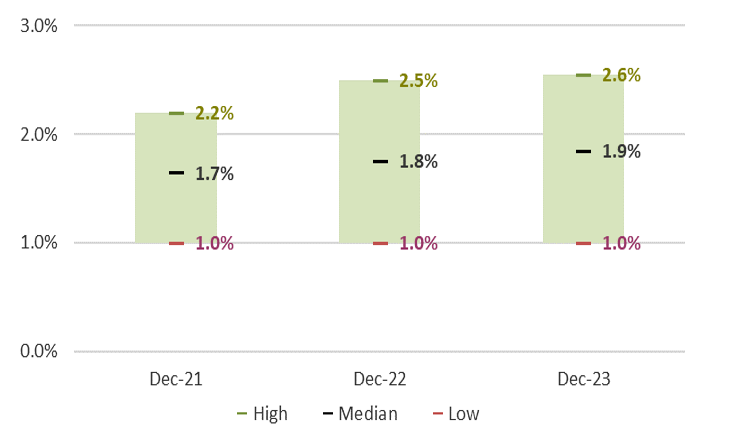
Range of 10 Year Treasury Yield Forecasts
2021 Playbook Summary
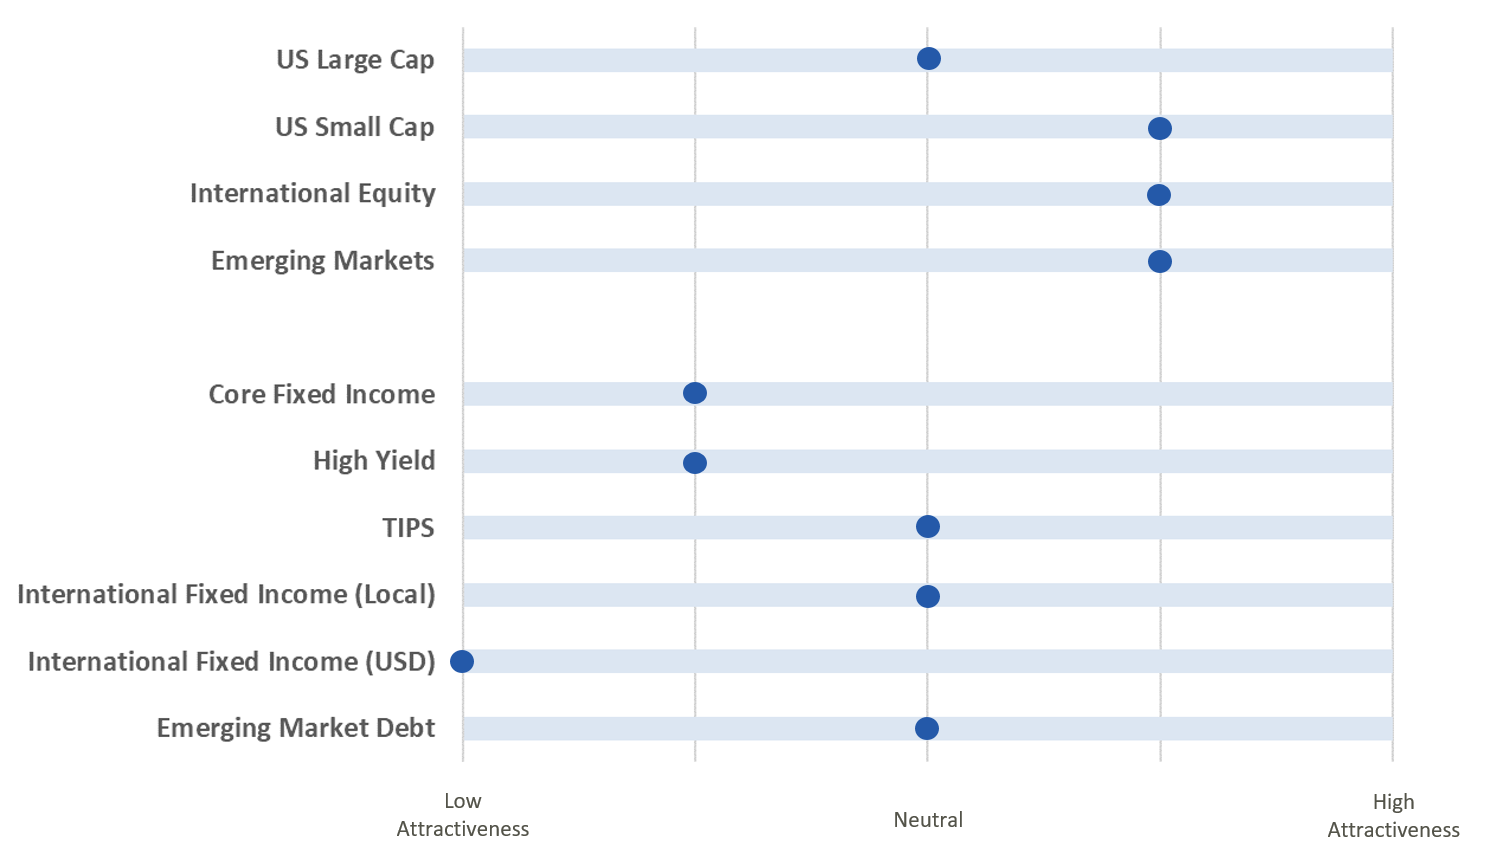
- The adjacent table indicates where each major investment asset class falls on the distribution of attractiveness (from low to high). This table is meant to provide a standardized and comparable view of the level of opportunity in each asset class category.
- In subsequent quarters, we will discuss any movement along the scale for each asset class and the driving forces behind the change in outlook.

