Market Flash Report | July 2025

Economic Highlights
United States
- The July employment report was much weaker than anticipated, with significant downward revisions to the May and June reports. U.S. employers added just 73,000 new jobs to the economy last month, below the 100,000 estimate. June and May totals were revised sharply lower, down by a combined 258,000 from previously announced levels. The unemployment rate ticked up by 0.1% to 4.2%, and the broader U6 unemployment rate rose to 7.9%. Average hourly earnings increased 0.3% M/M or 3.9% Y/Y. Health care and social assistance combined for around 94% of the job growth.
- Q2 GDP increased 3% Y/Y, well ahead of the 2.3% estimate from economists and the 0.5% contraction reported in Q1. Consumer spending rose 1.4% in the second quarter, better than the 0.5% in the prior period. While exports declined 1.8% during the period, imports fell 30.3%, reversing a 37.9% surge in Q1. GDP posted its strong rise, without help from government spending. Federal spending declined 3.7%, while state and local government spending rose 3%. Business spending was solid but slowed down from its Q1 pace.
- The Personal Consumption Expenditures (PCE) price index, the inflation gauge The Federal Reserve uses for its 2% target rate, rose 0.3% M/M or 2.6% Y/Y, the highest since February. Core PCE increased 0.3% M/M or 2.8% Y/Y. The PCE price index was expected to heat up slightly in part because of rising gas prices, which had been falling for much of the year, as well as pricier goods from businesses passing along tariff-related costs to consumers. Energy prices rose 0.9% while goods prices increased 0.4%.
- July’s ISM Manufacturing PMI remained in contraction territory for the fifth consecutive month. The headline reading of 48.0 was down from 49.0 in the prior month. While new orders and production strengthened in July, the gauges for employment and prices both fell. Most components are in contraction territory with the exception of prices, which reflects the higher inflation environment over the past few years.
Non U.S. Developed
- The eurozone's GDP grew by a modest 0.1% in the second quarter of 2025, a slowdown from the 0.6% growth in the first quarter. This growth is attributed to a combination of factors, including stronger-than-expected performances in countries like Spain and France, while others, like Germany and Italy, experienced contractions. The slowdown in eurozone GDP growth in Q2 came as no surprise as the boost from tariff front-running waned. Spain continued to shine, expanding by 0.7% on the quarter, while French growth at 0.3% was also above average. Meanwhile, Italy and Germany both shrunk by 0.1%.
- Eurozone inflation held steady at 2% for the second straight month in July. Core inflation, which strips out more volatile food, energy, alcohol and tobacco prices, came in at 2.3% in July. Services inflation eased last month after a hotter-than-expected reading in June. The European Central Bank is expected to hold rates steady at its next meeting, after 8 rate cuts over the past year.
- Economists expect Japan’s GDP to grow marginally in Q2 2025, due largely to resilient consumption and net exports. Q2 GDP is forecast to grow at an annualized clip of 0.4% after declining in Q1. The Bank of Japan kept rates steady at its end of July meeting but offered a more upbeat assessment of the economy after the trade deal was reached with the U.S.
Emerging Markets
- China’s economy grew at a faster-than-expected rate in Q2 2025, keeping the country on track to meet its full-year target of 5% and easing some pressure on policymakers to step up stimulus to underpin growth. GDP increased 5.2% in Q2, ahead of the 5.1% expectation but below the 5.4% rate seen in Q1. Domestic consumption contributed 52% of GDP in the first half of 2025. The share of consumption rose in Q2 while the contribution of trade fell. This is important, albeit for a short period of time, for rebalancing the Chinese economy away from investments and trade towards consumption.
- Chinese exports remained largely resilient in Q2 as businesses diverted trade to alternative markets. U.S.-bound shipments have shrunk 10.9% YTD through June 30, while exports to Southeast Asia nations and European Union countries (the groupings China counts as its two largest trading partners) jumped 13% and 6.6%, respectively. It is important to note that much of the resilience has come on the back of significant price discounts.
- In June, Chinese retail sales growth slowed to 4.8% from a year earlier, compared with the 6.4% year-on-year increase in May. Industrial output expanded by 6.8% Y/Y, ahead of estimates.
- India’s economy expanded 6.5% in its most recent fiscal year ending 3/31/25. This represented the slowest pace of growth since the COVID-19 pandemic. Most economists expect growth to be in the range of 6-6.5% in the coming fiscal years, but some downward revisions are occurring due to U.S. tariffs. President Trump announced 25% tariffs on Indian goods, and economists believe it will generally impact the economy by 20-30 bps, while some believe the impact could be closer to 1% of GDP.
Fixed Income
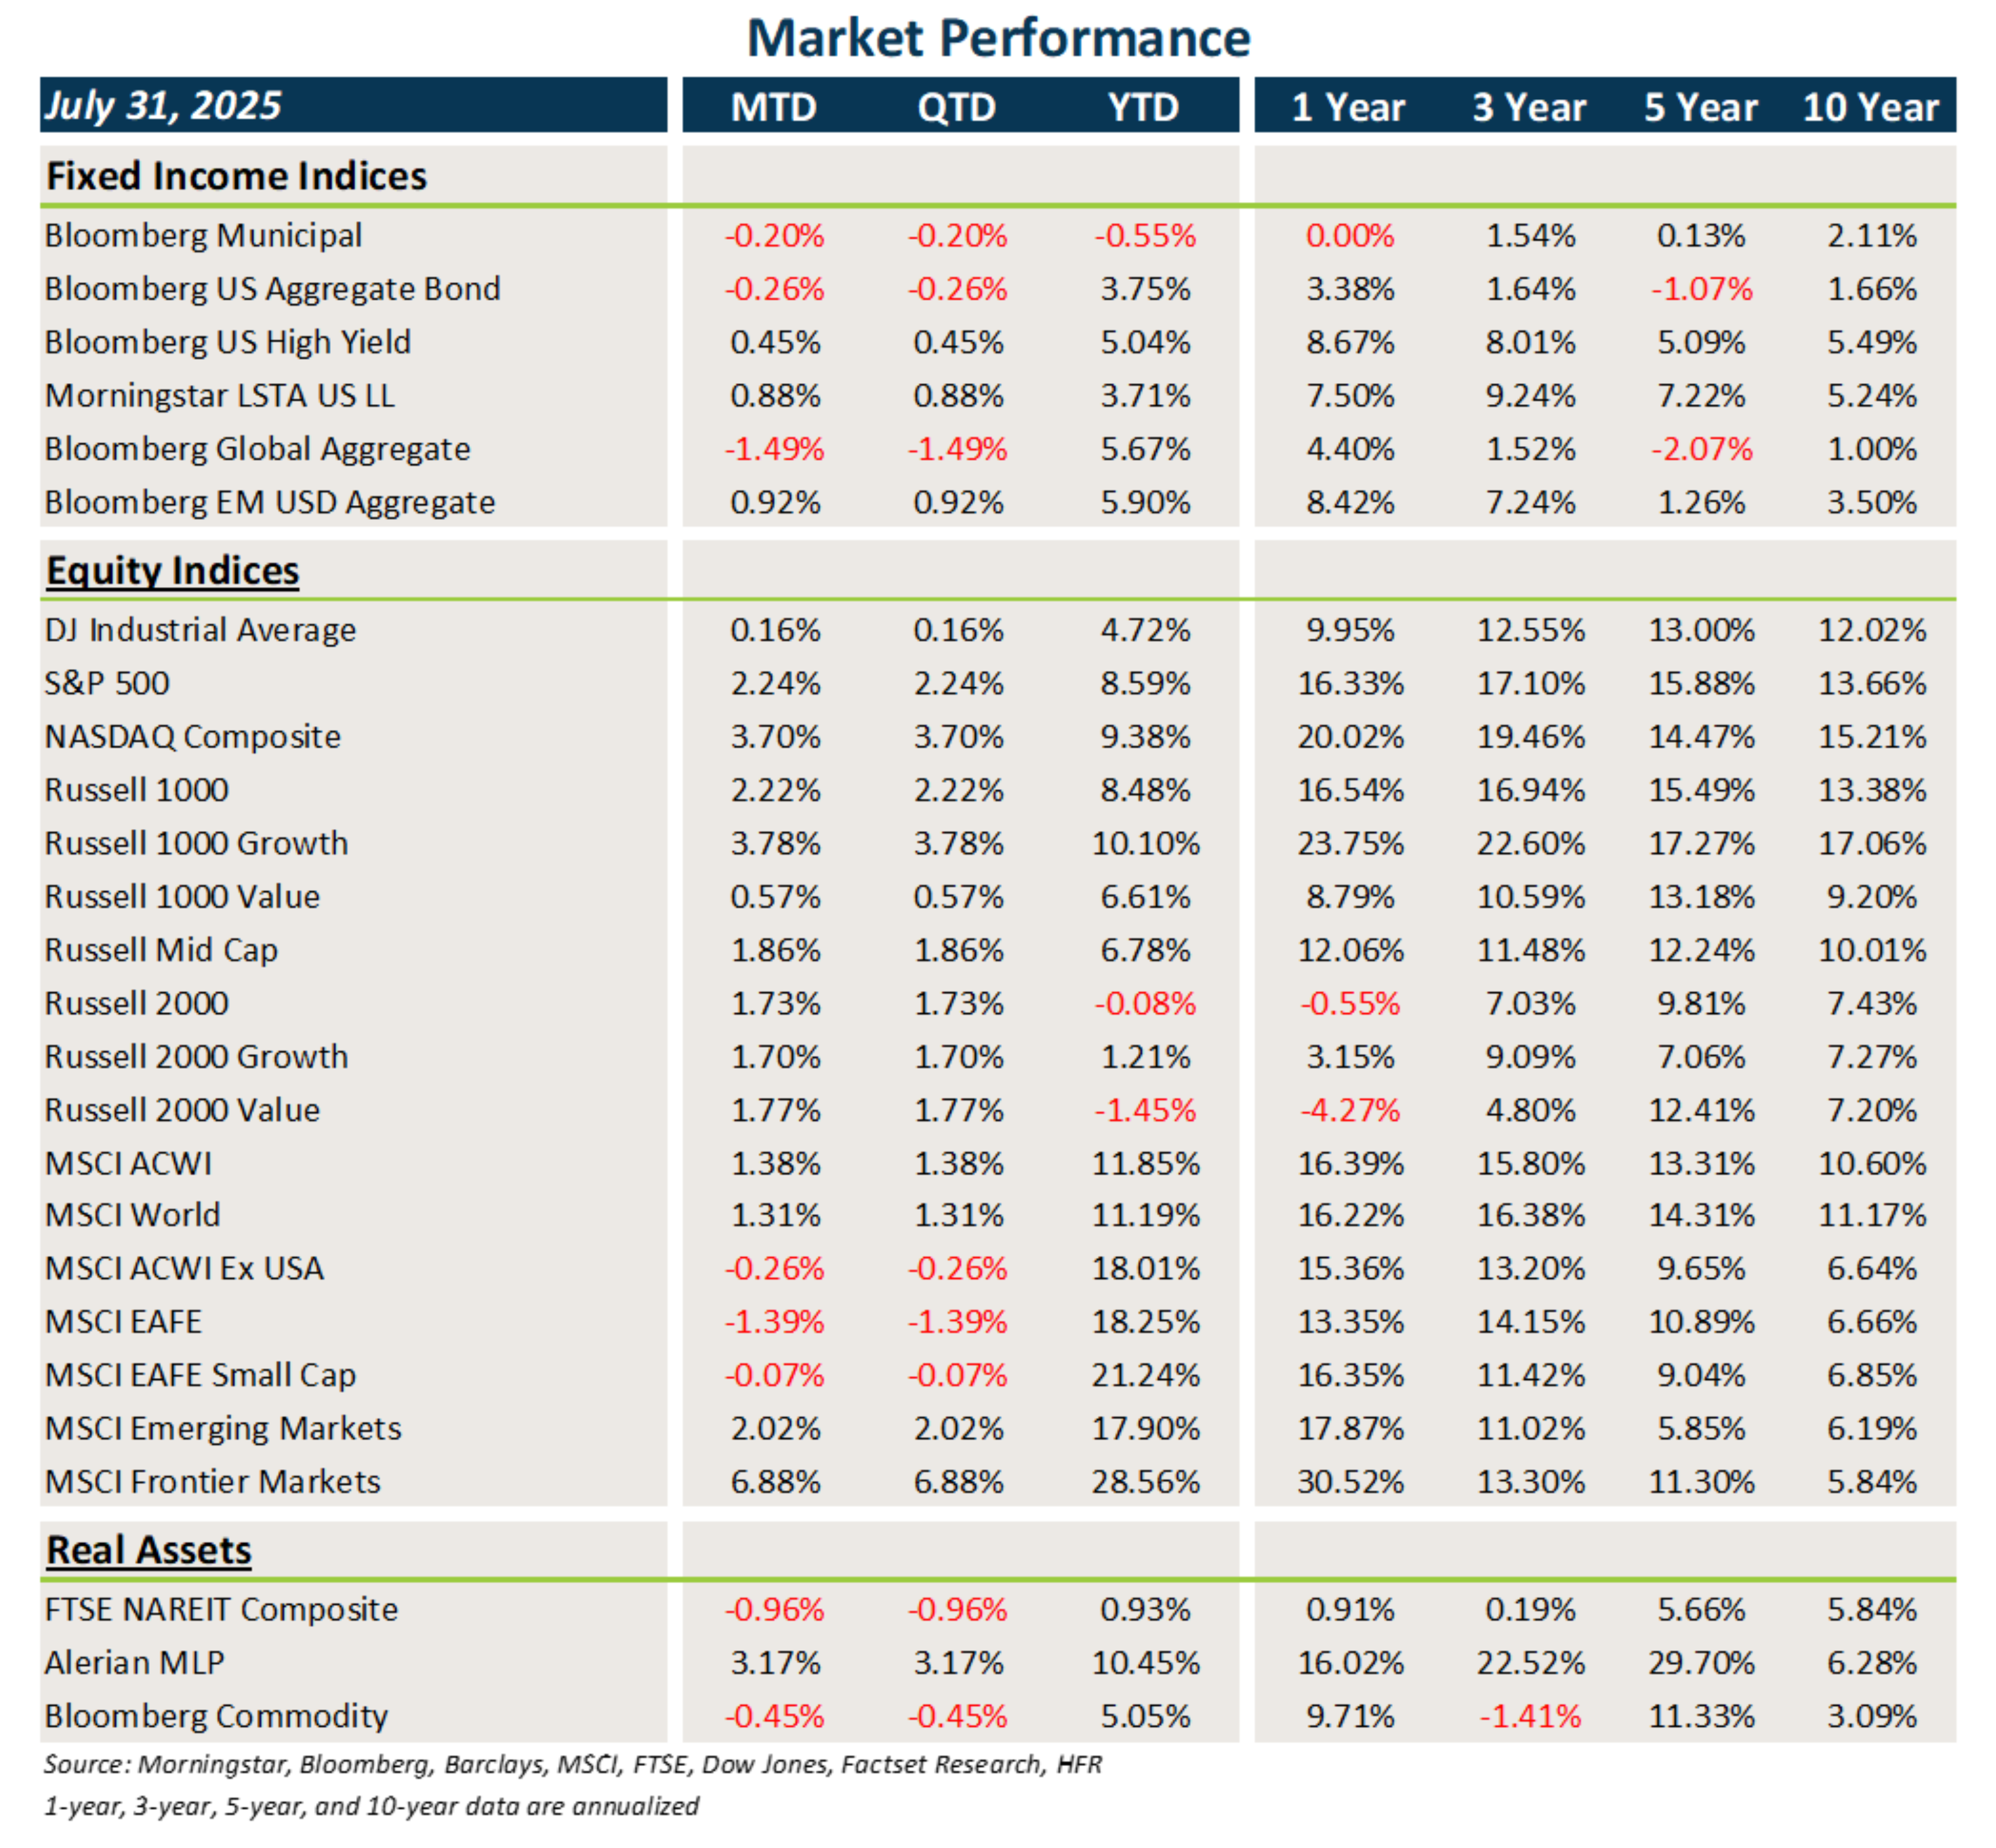
- Interest rates were volatile as usual in July, but they ultimately trended slightly higher, leading to modest losses in core fixed income and municipal bonds.
- Credit posted another month of essentially clipping coupons. The credit backdrop remains fairly benign, outside of the riskiest issues.
- Bonds outside the U.S. were hurt by USD strength and the slight backup in rates. EMD’s higher yields provided a boost.
U.S. Equities
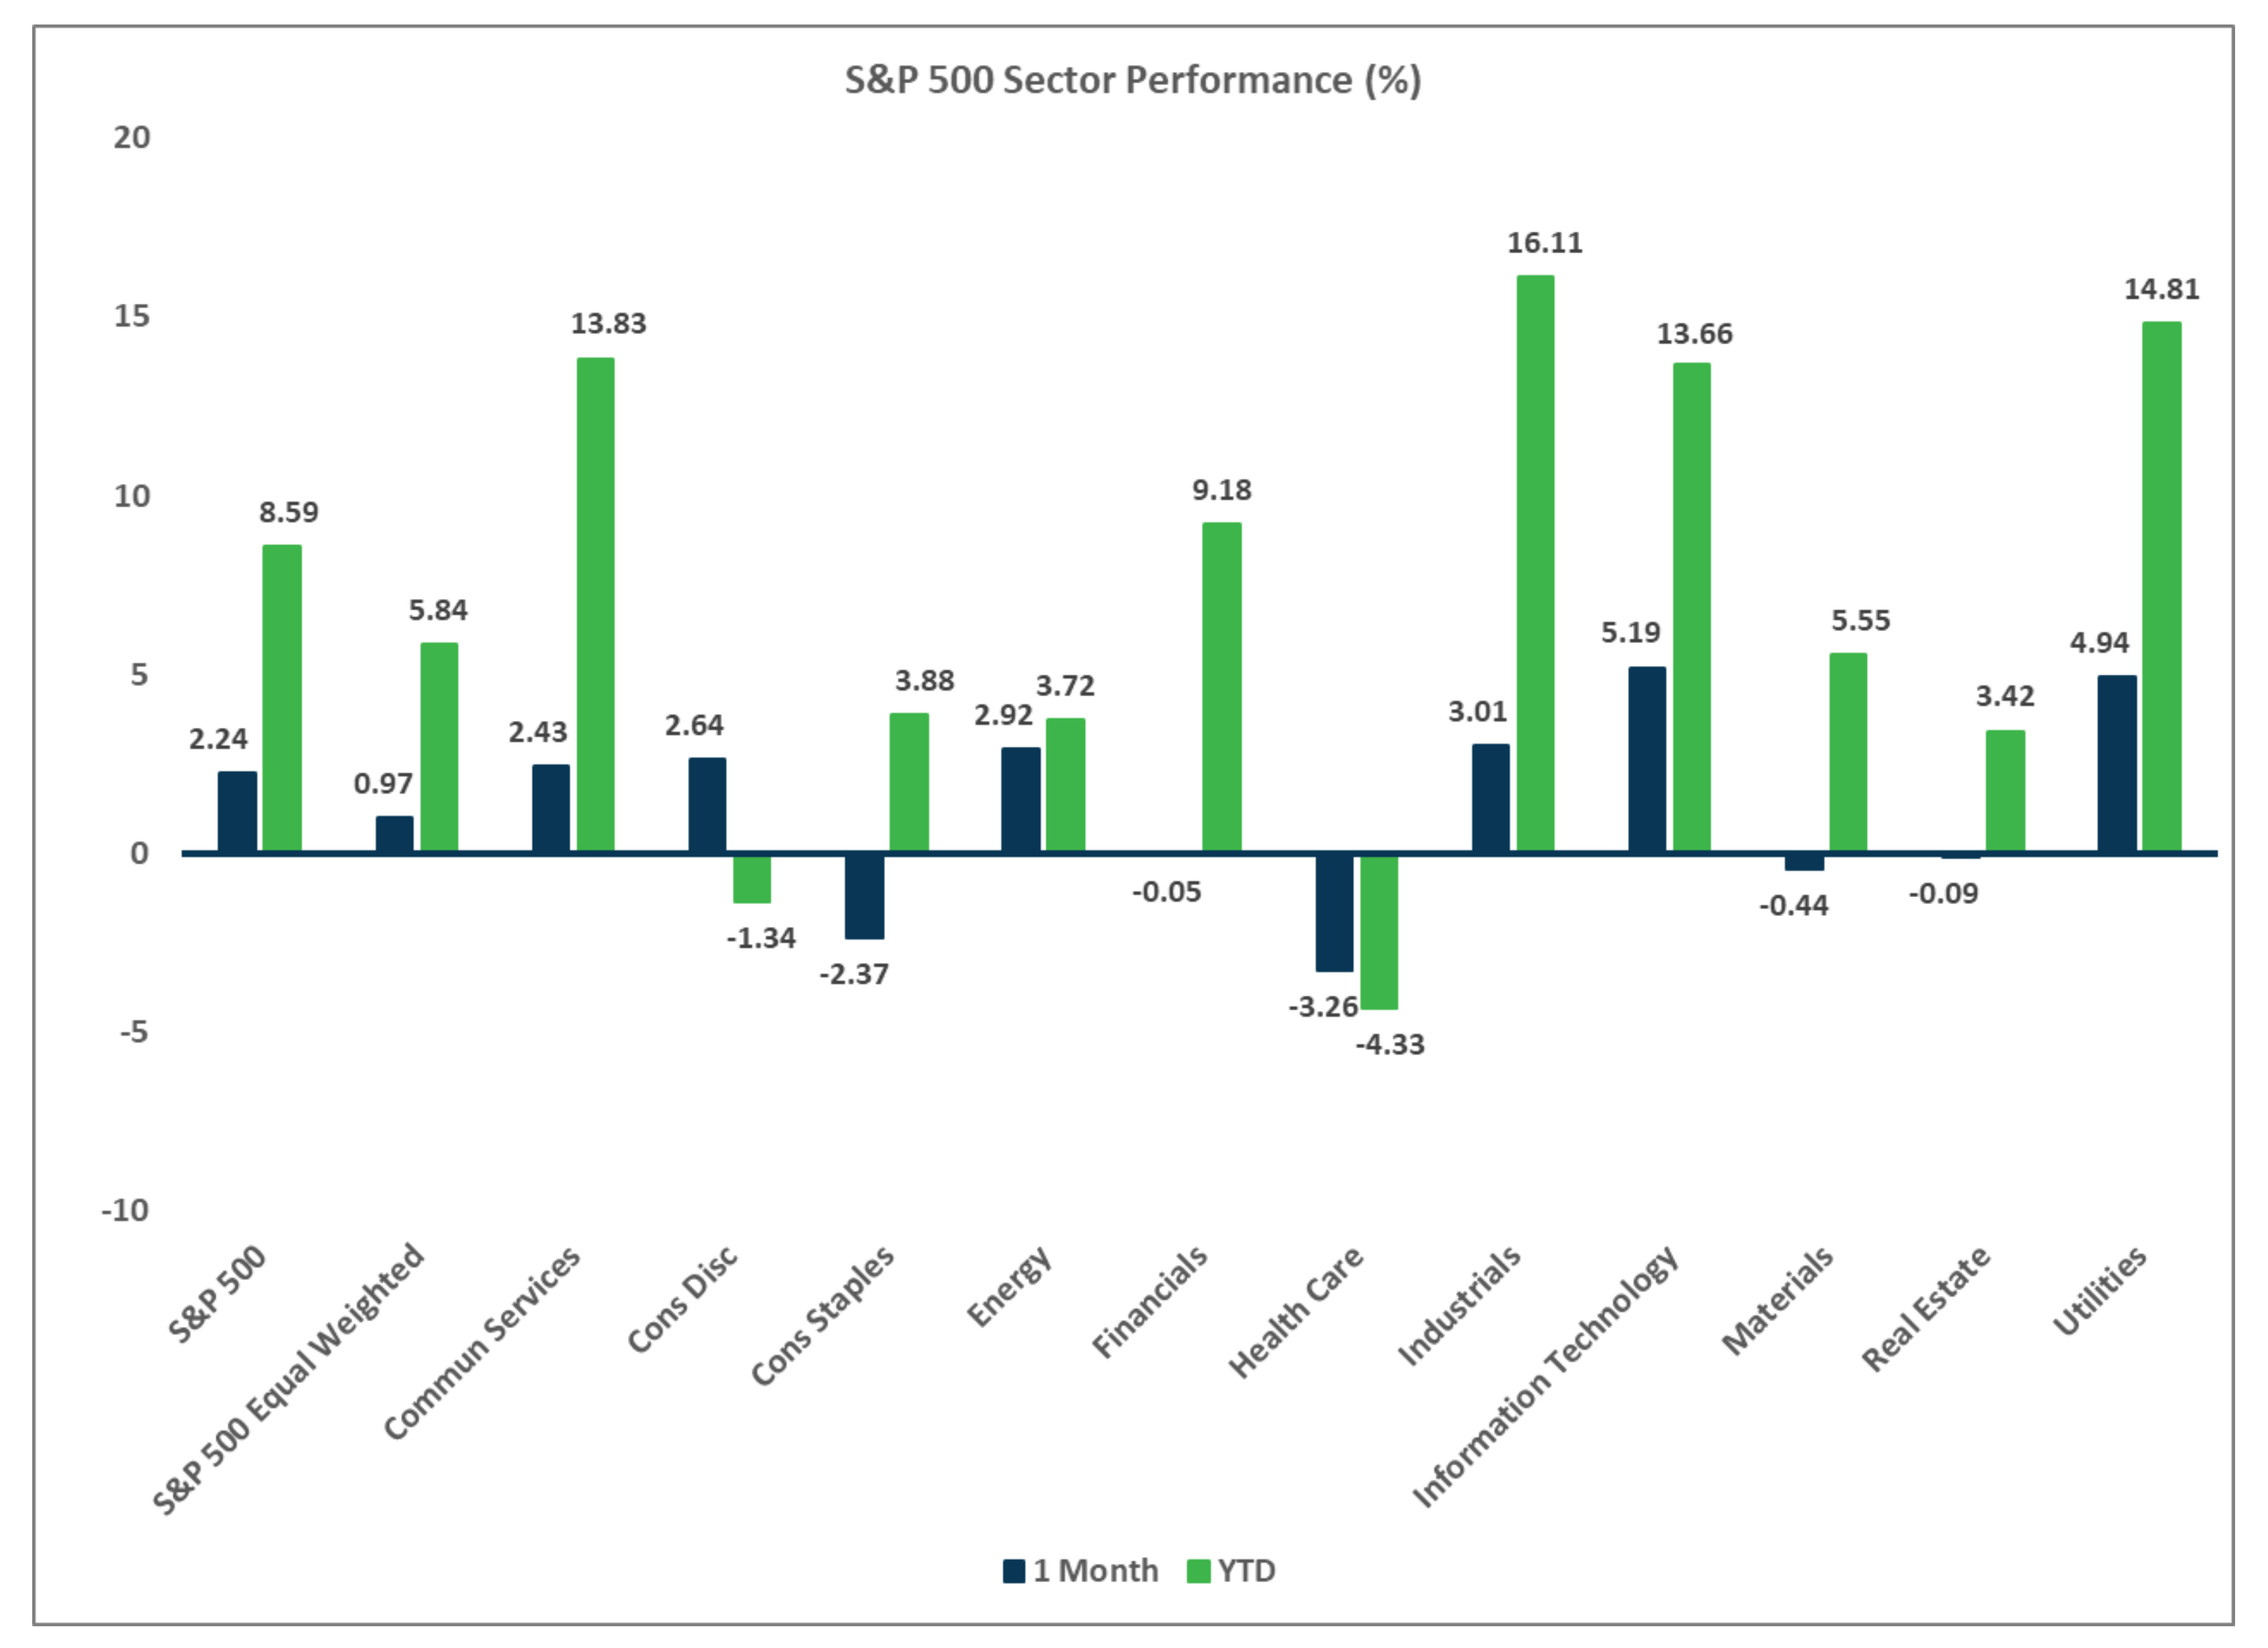
- U.S. equities posted solid gains in July, led by tech/growth stocks delivering solid earnings growth.
- Large caps outperformed small caps last month, and growth trounced value across large caps.
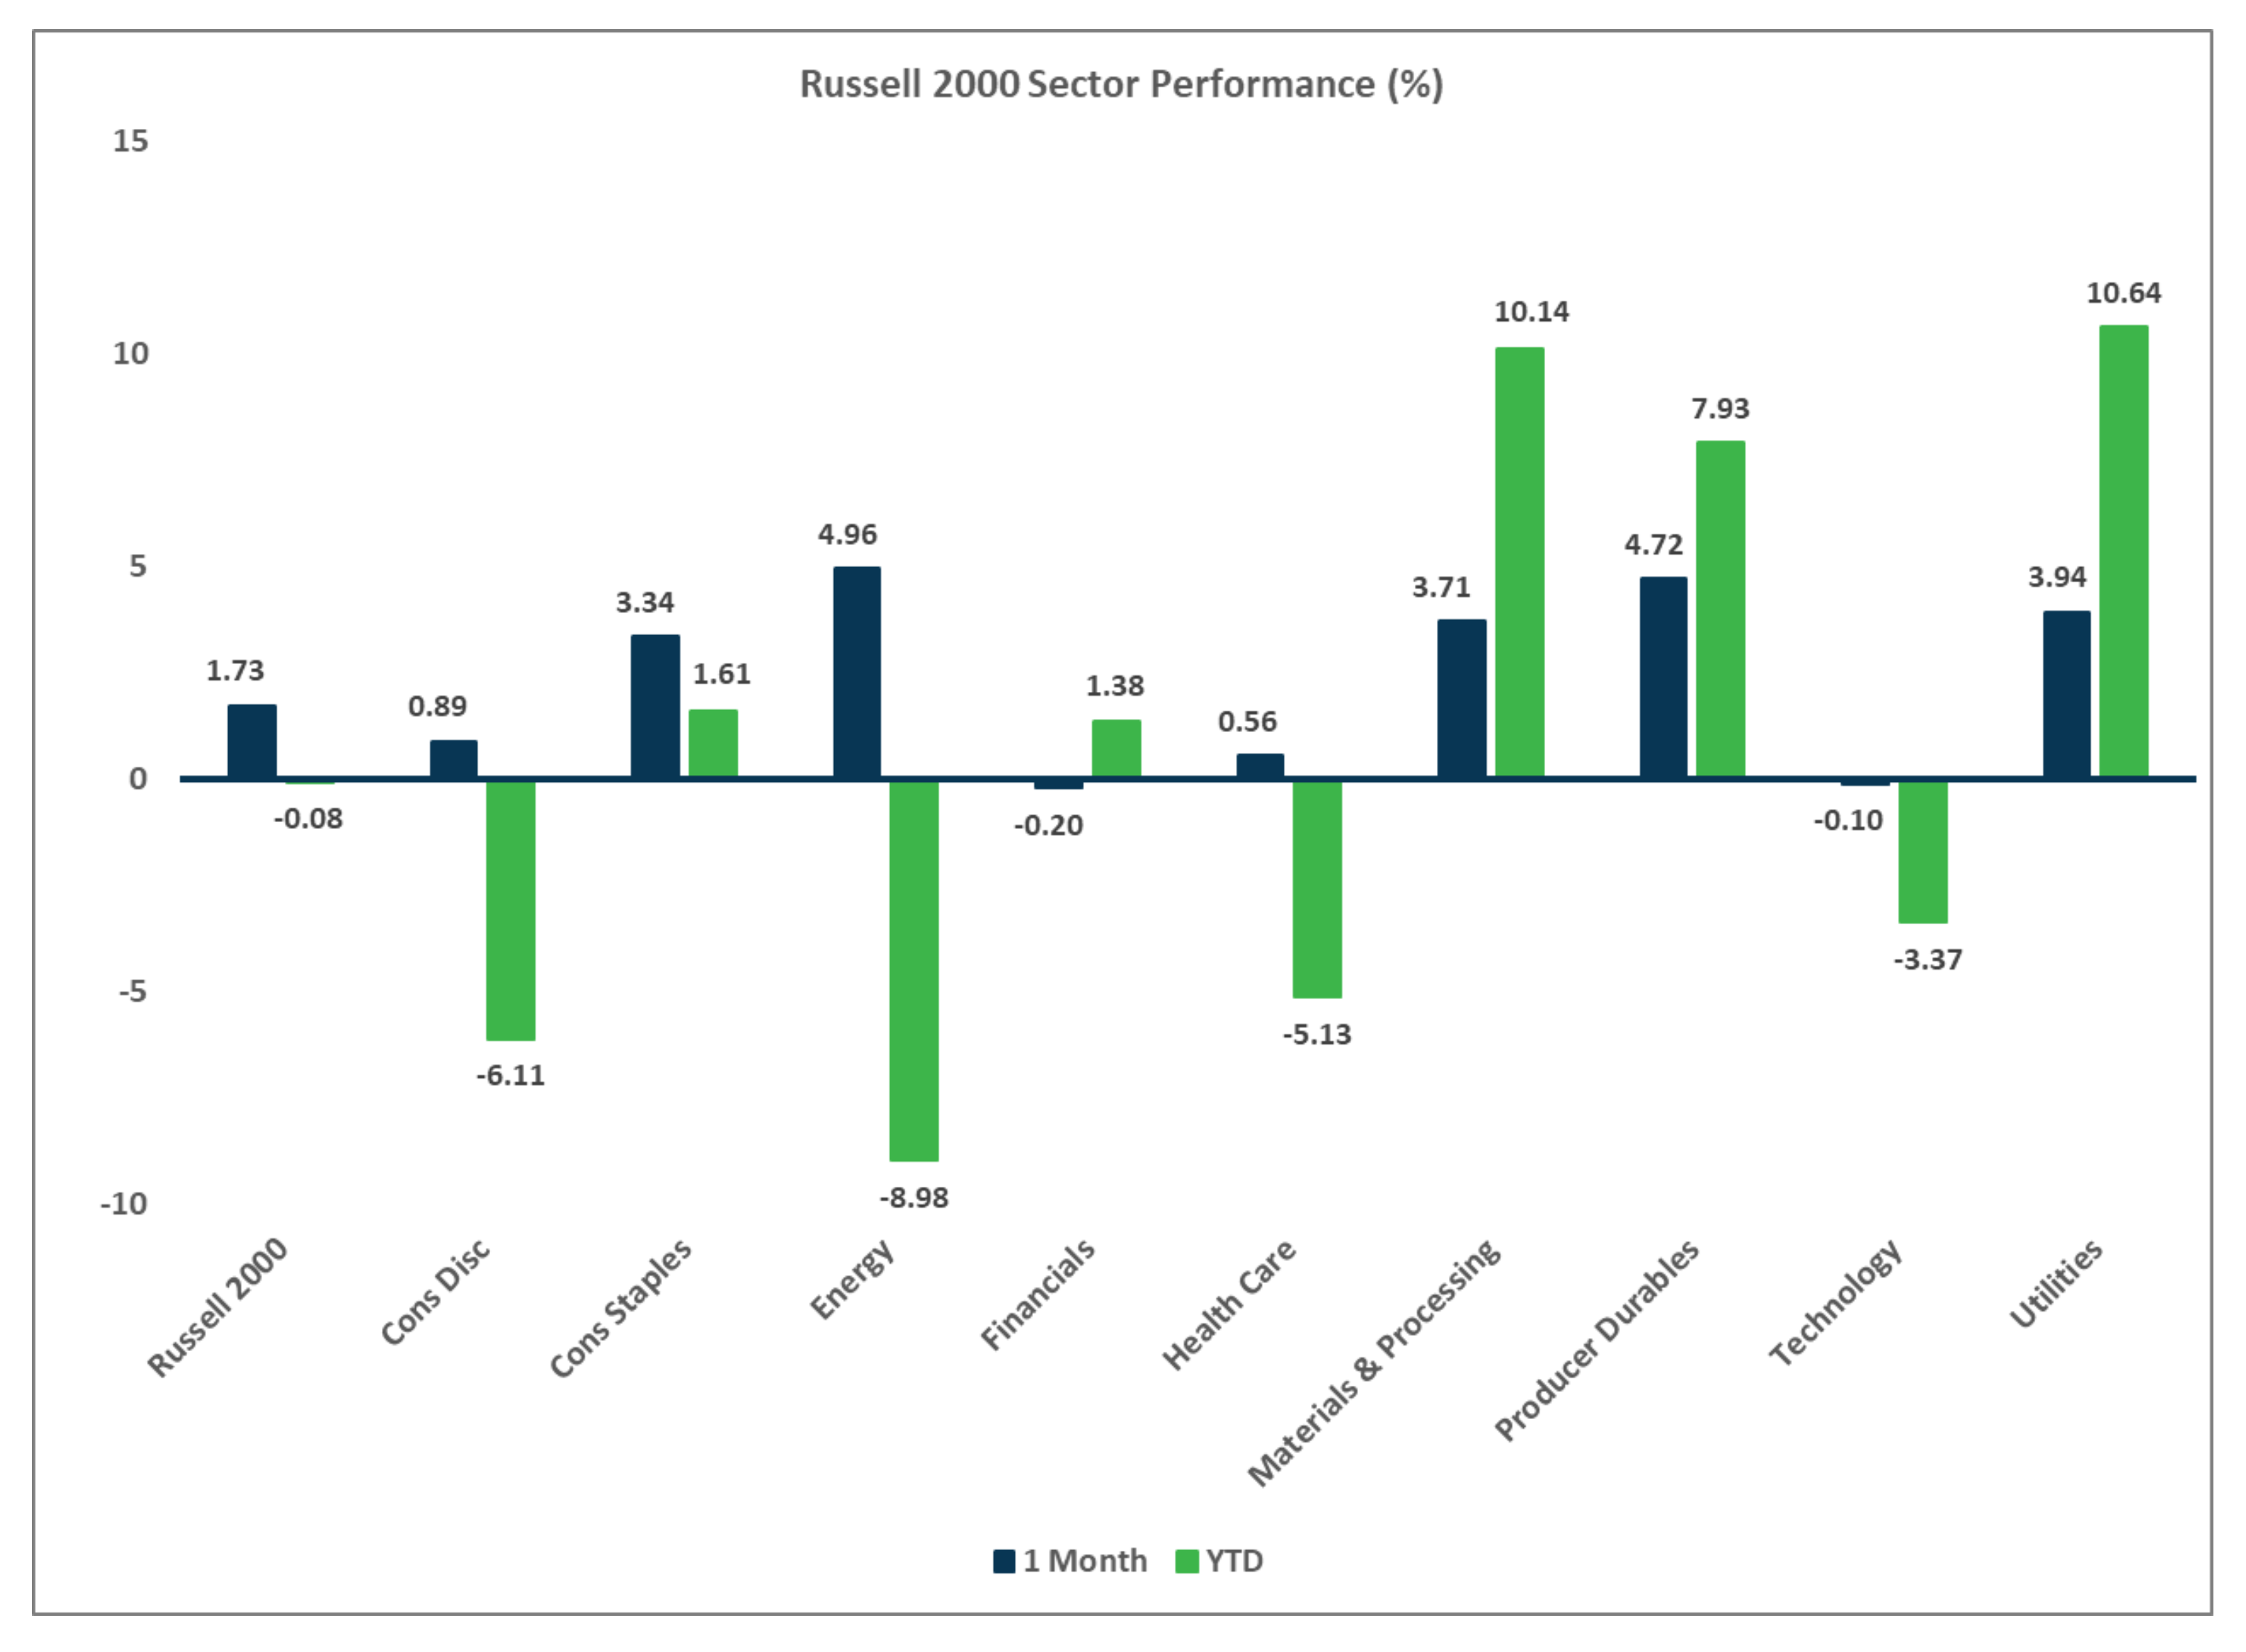
- There was little difference between growth and value stocks within small caps.
Non U.S. Equities
- Developed markets outside the U.S. fell last month, with most of the move coming from the stronger U.S. dollar.
- Unlike U.S. markets, value outperformed growth within EAFE markets, and small caps beat large caps.
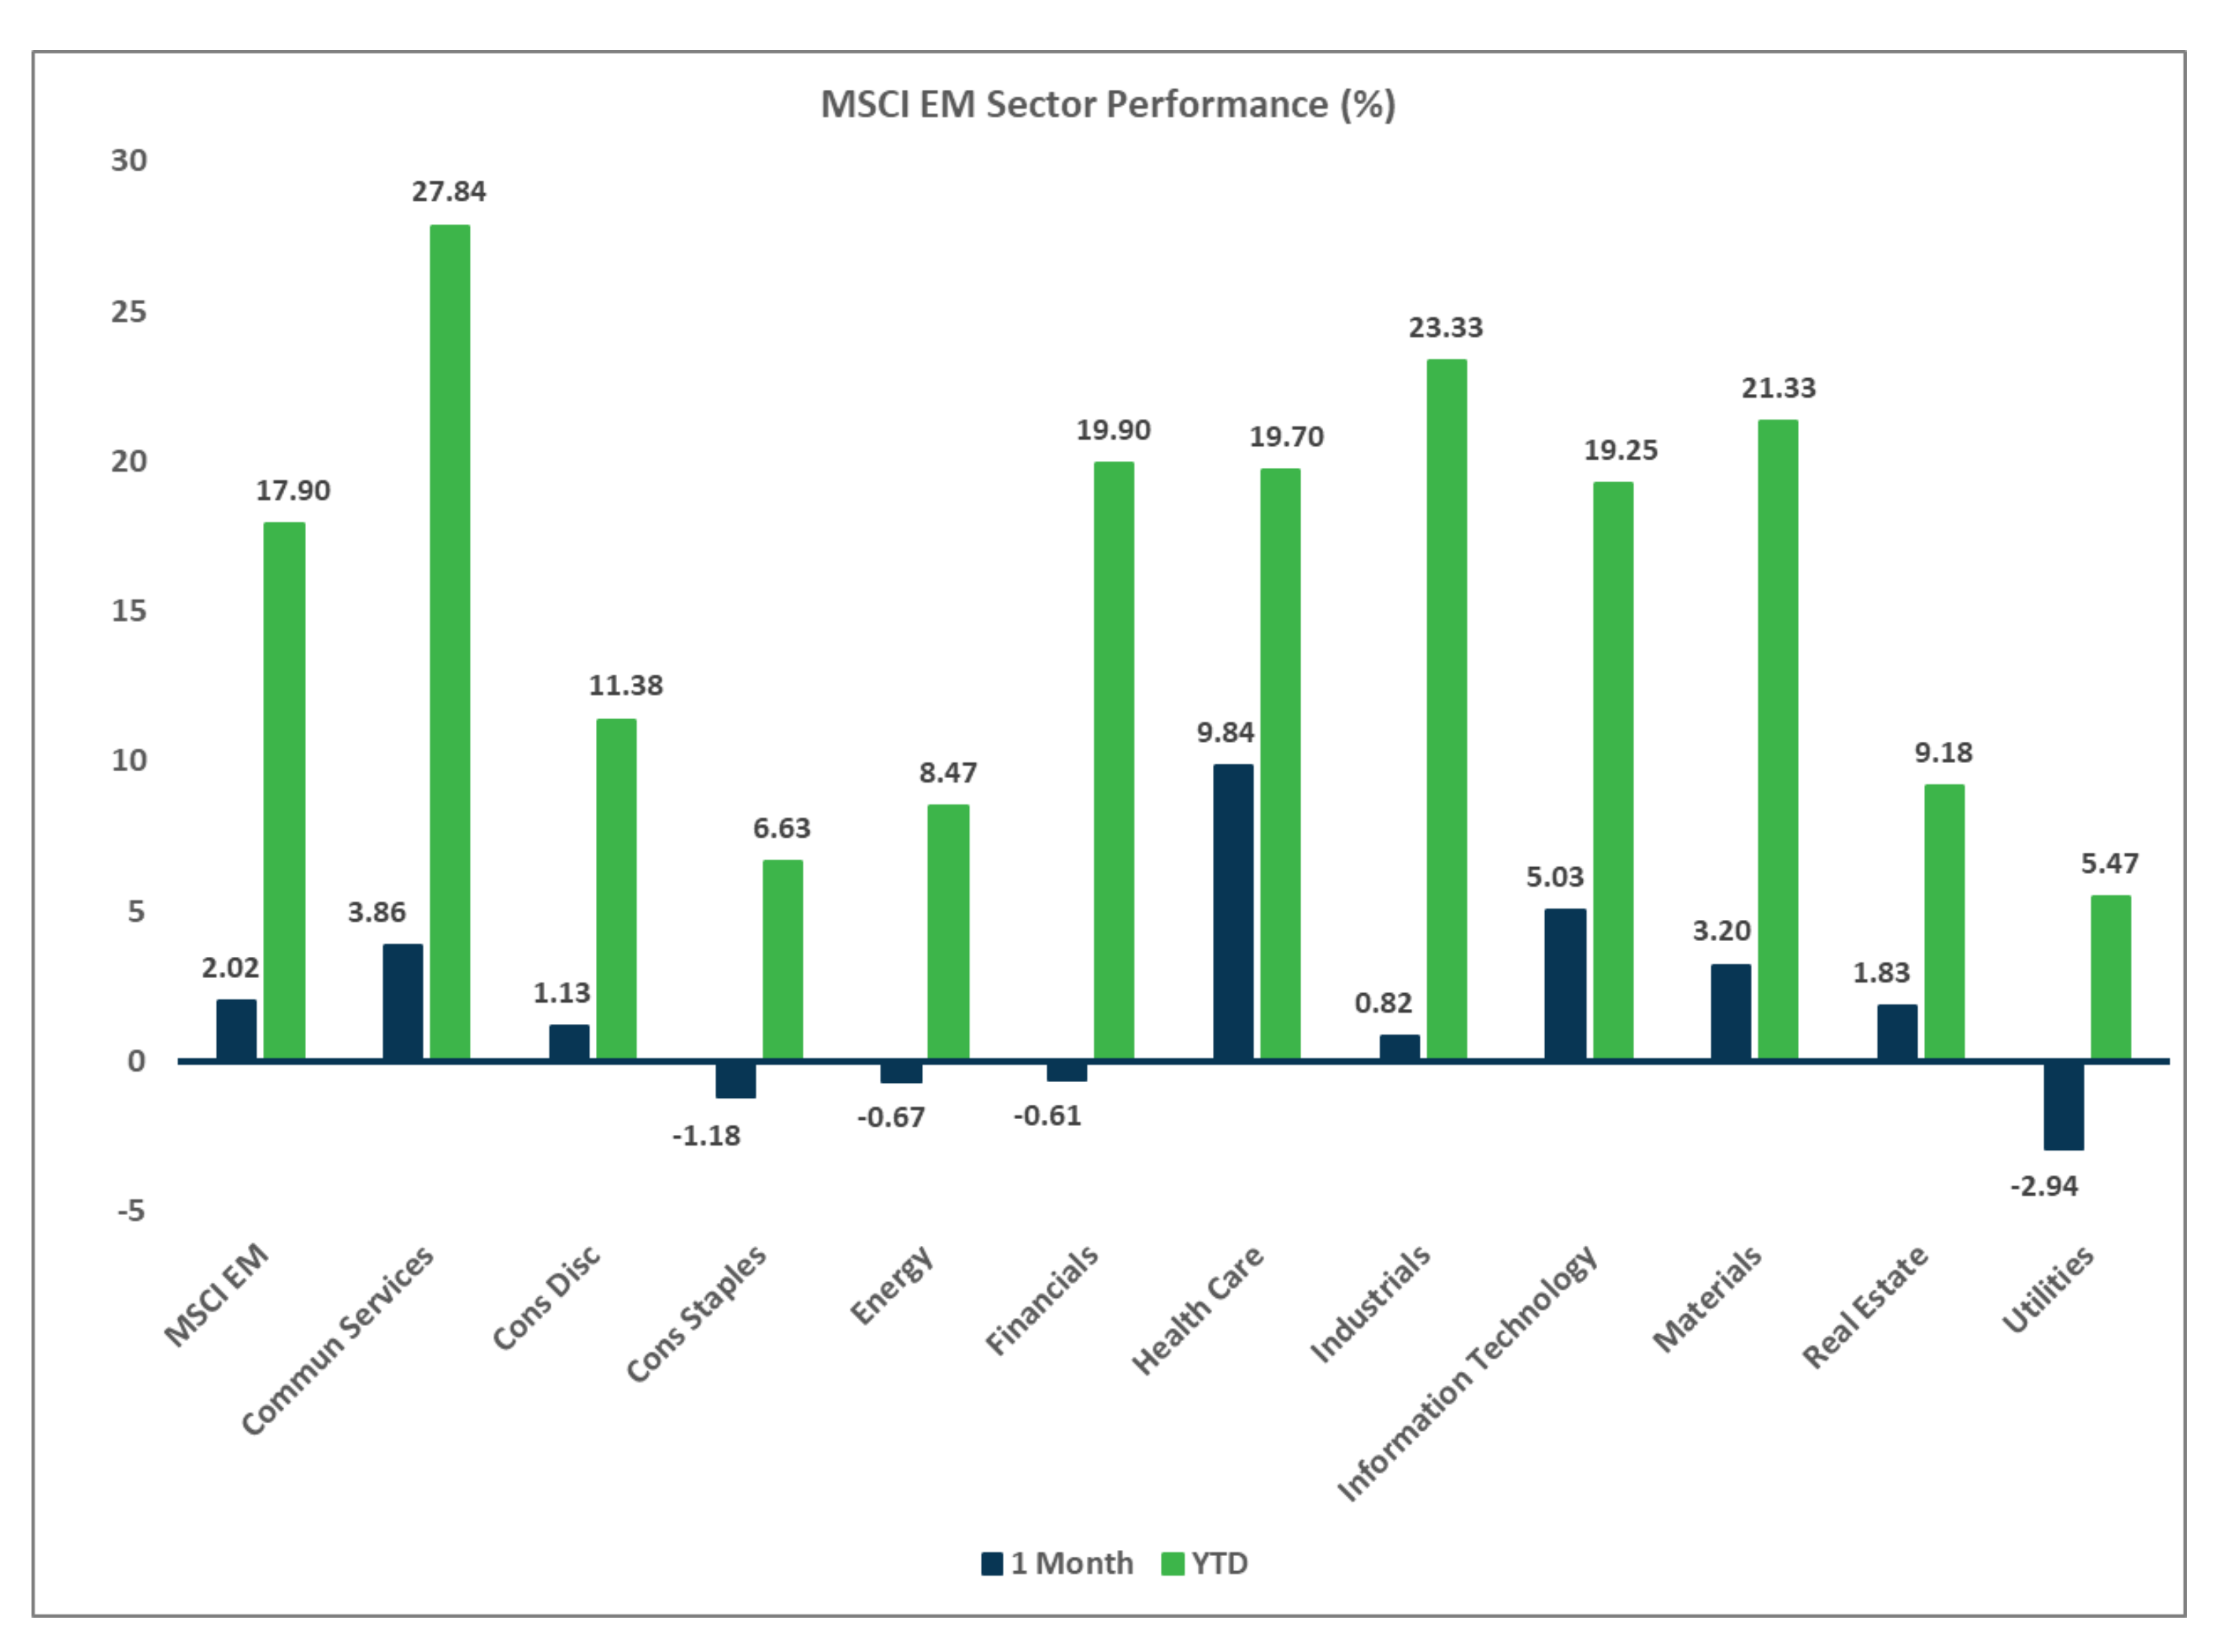
- EMs gained another 2% in July, driven by strong returns from Chinese equities.
- USD strength cost 278 bps to EAFE returns and 142 bps in EMs.
Sector Performance - S&P 500 (as of 07/31/25)
Sector Performance - Russell 2000 (as of 07/31/25)
Sector Performance - MSCI EAFE (as of 07/31/25)
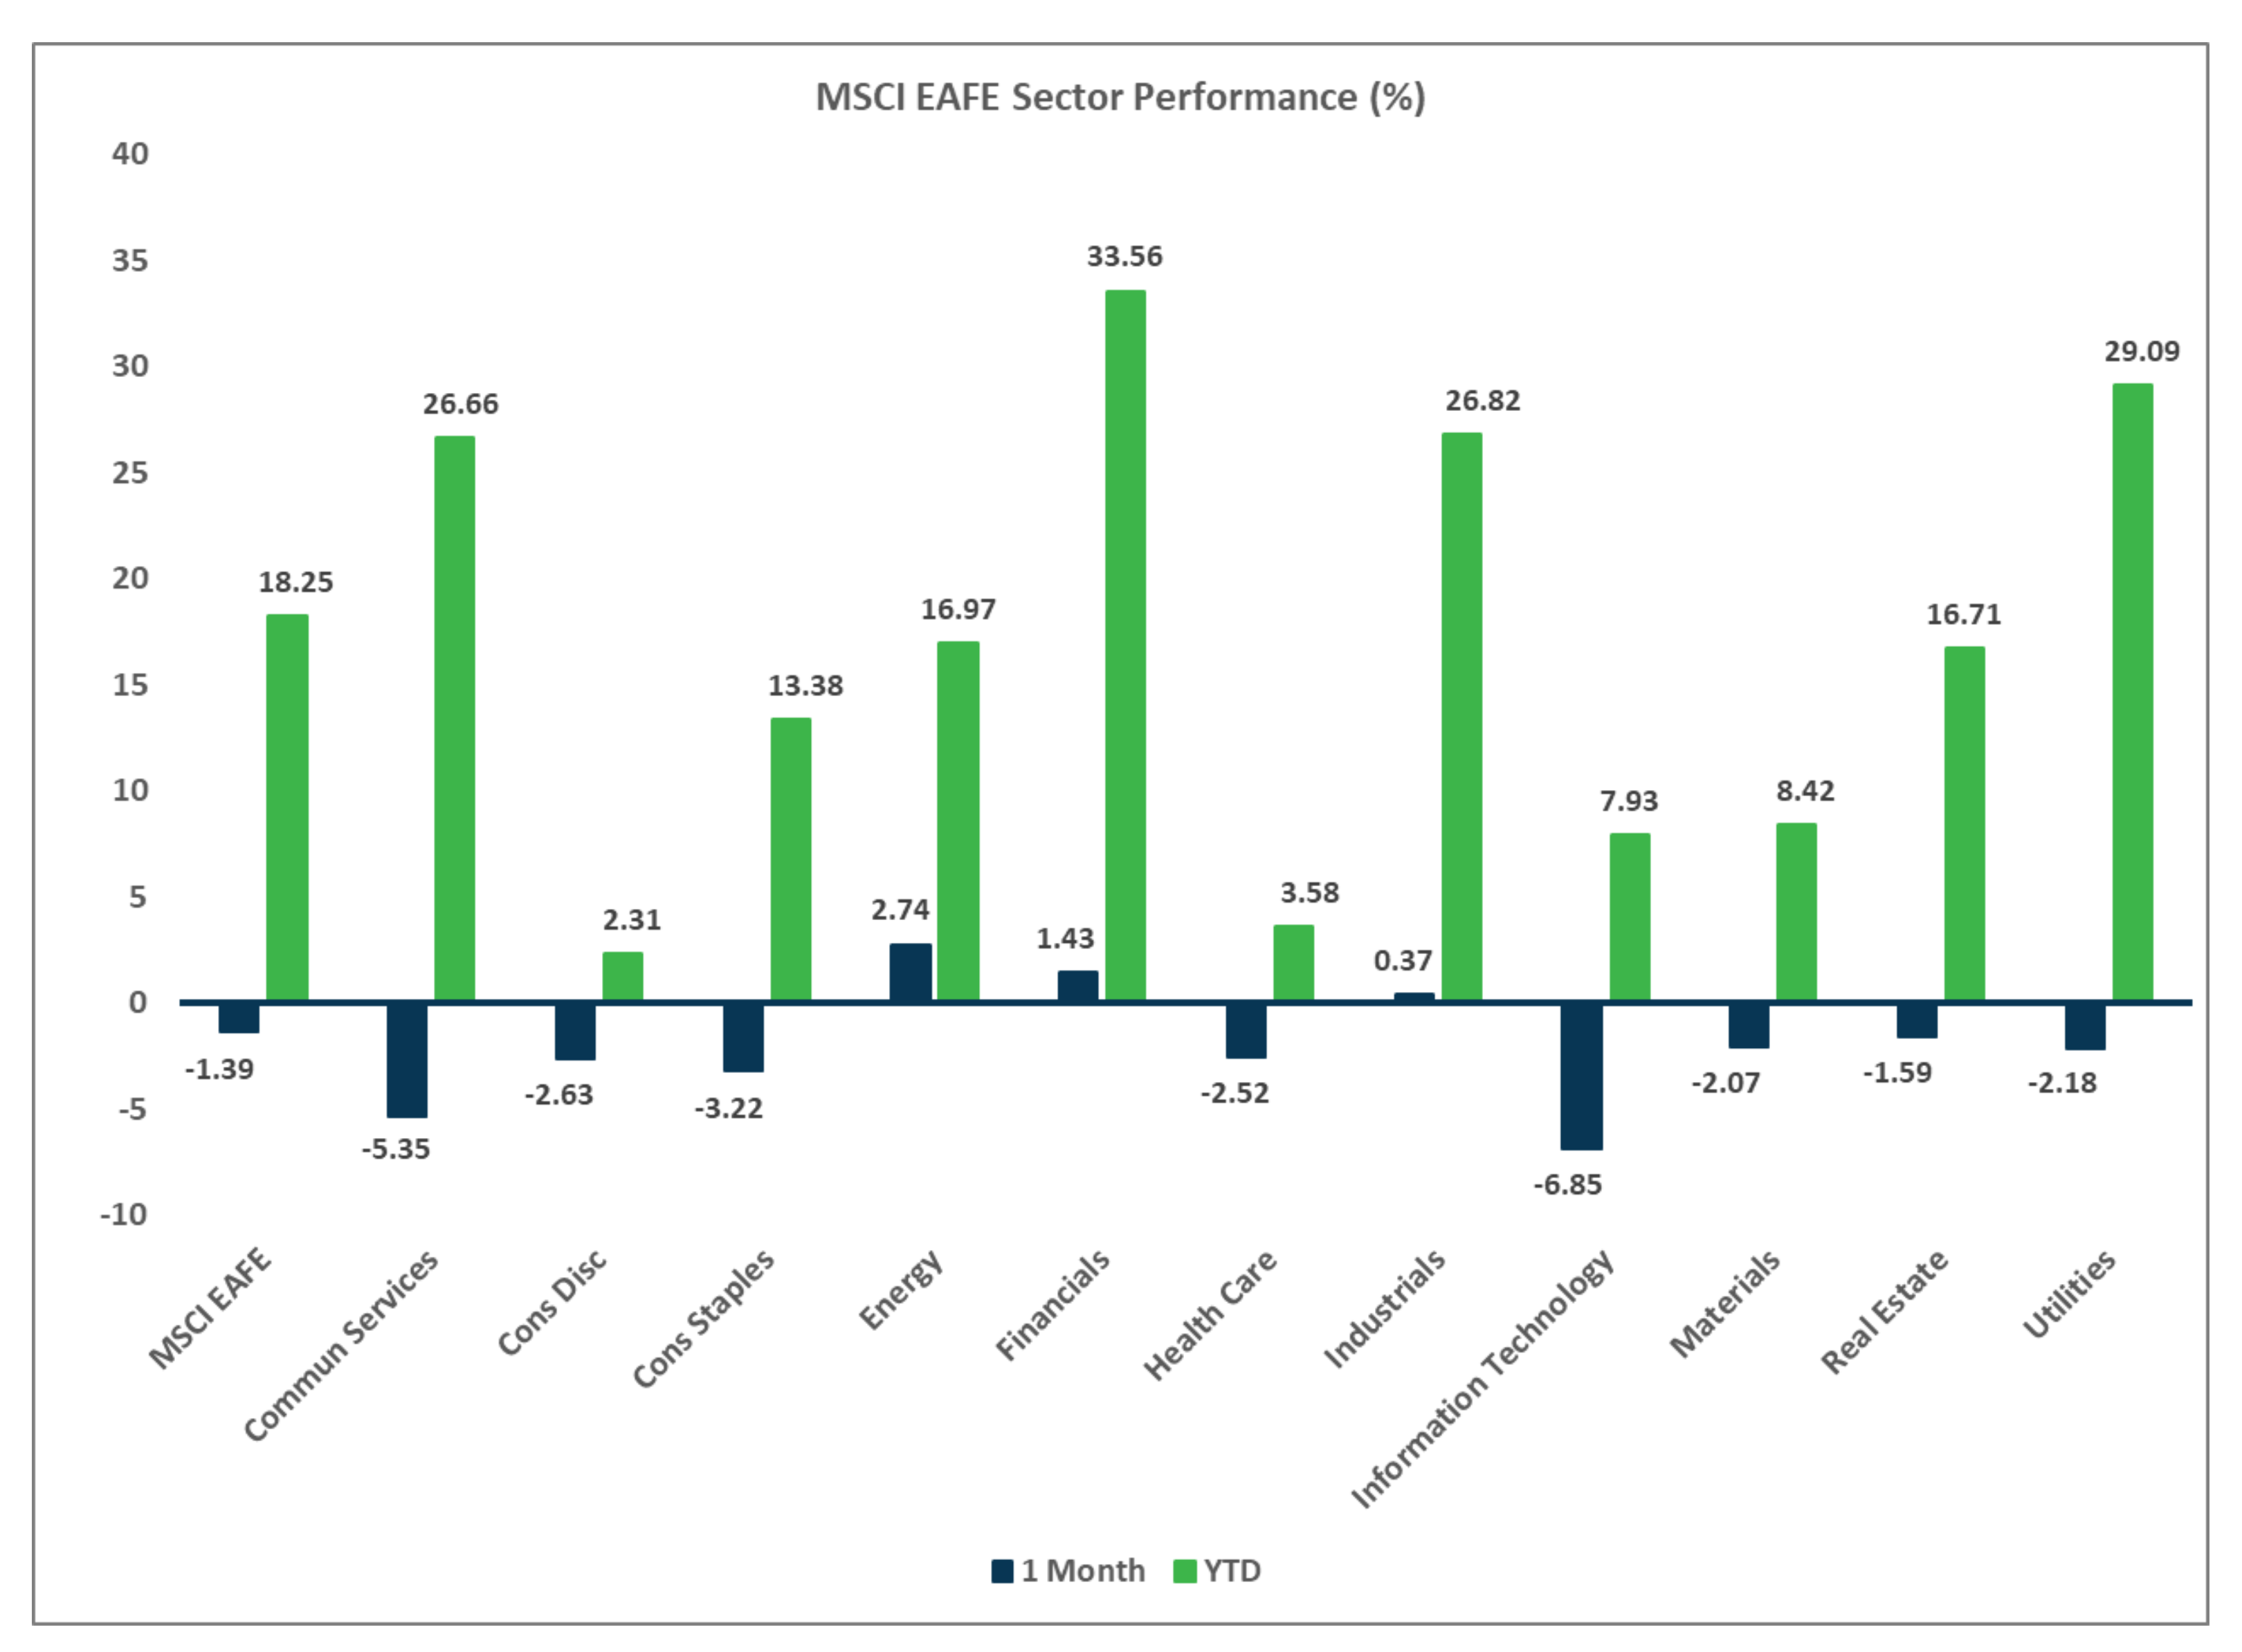
Sector Performance - MSCI EAFE (as of 07/31/25)