

2021 Q2 Summary
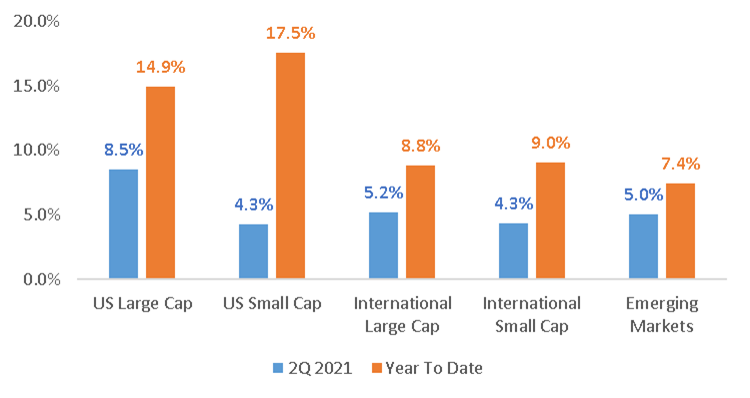
- Riskier asset classes rallied and ended the first half of 2021 with strong, broad based returns, but Q2 experienced a different leadership tone than the prior two quarters.
- US Large Cap outperformed most major equity asset classes in the second quarter as investors began to price in the potential for more volatility in the months ahead.
- Despite relative underperformance in the second quarter, US Small Cap has outperformed major equity asset classes so far in 2021.
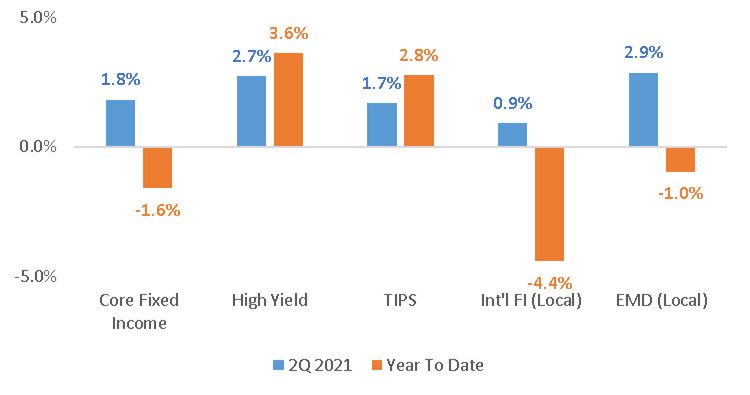
- Fixed income markets performed well in the second quarter, rebounding from a sharp sell off in the first three months of the year.
- All major fixed income asset classes posted gains in the second quarter, but only TIPS and High Yield posted positive returns in the first half of 2021.
Equity Returns
Fixed Income Returns
Macroeconomic Outlook for the Second Half of 2021
- Economic Growth
- Economic activity in developed countries (including the US) will continue to grow above long-term trend rates.
- Economic growth in the US and China may have peaked in the second quarter of 2021, but strong economic growth is set to continue into 2022.
- The global economic rebound will continue at an uneven pace.
- Emerging Market economies may be the fastest growing economies as the global rebound continues.
- Economic activity in developed countries (including the US) will continue to grow above long-term trend rates.
- Inflation
- Goods inflation (ex: building materials, energy) is likely to slow in the months ahead, while services inflation (ex: travel and leisure) is likely to accelerate.
- Supply disruptions and shortages will likely slow in the months ahead, but shortages may linger into 2022.
- Expect inflation to remain higher than the Federal Reserve’s 2% target over the short term (sustained “runaway inflation” is unlikely)
- Monetary Policy
- Monetary policy will remain highly accommodative for the rest of 2021.
- The Fed’s short-term policy rate will remain close to 0% until 2023.
- The Fed may begin tapering its quantitative easing program in late 2021 or early 2022.
- Fiscal Policy
- Another round of fiscal stimulus in the US may fall short of earlier expectations, but some agreement on additional spending is likely in 2021.
- Another round of fiscal stimulus in the US may fall short of earlier expectations, but some agreement on additional spending is likely in 2021.
Market Outlook for the Second Half of 2021
- Changes in monetary policy, fiscal policy, inflation and interest rates will likely create short-term periods of volatility in equity and fixed income markets.
- Fiscal stimulus ($1T) may pass before the end of the summer.
- Another round of fiscal stimulus ($2T-$3T) is being debated, but the outcome is uncertain.
- Monetary policy will remain accommodative. The Fed may announce plans to taper asset purchases before the end of 2021, but short-term policy rates will remain unchanged.
- A short-term, moderate pull back in US equity markets is likely (and healthy).
- US Large Cap equities appear “rich” from a fundamental perspective.
- On a relative basis, International and Emerging Market equities remain attractive from a fundamental perspective.
- Value remains attractive relative to growth and is poised to outperform as the global economic recovery continues.
- Fixed income may continue to struggle as intermediate and long-term interest rates are likely to move higher.
- Short duration fixed income may be the best performing fixed income asset class in the second half of the year.
- Expect short-term yields to remain near the “zero lower bound”.
- Expect the yield curve to steepen by the end of the year.
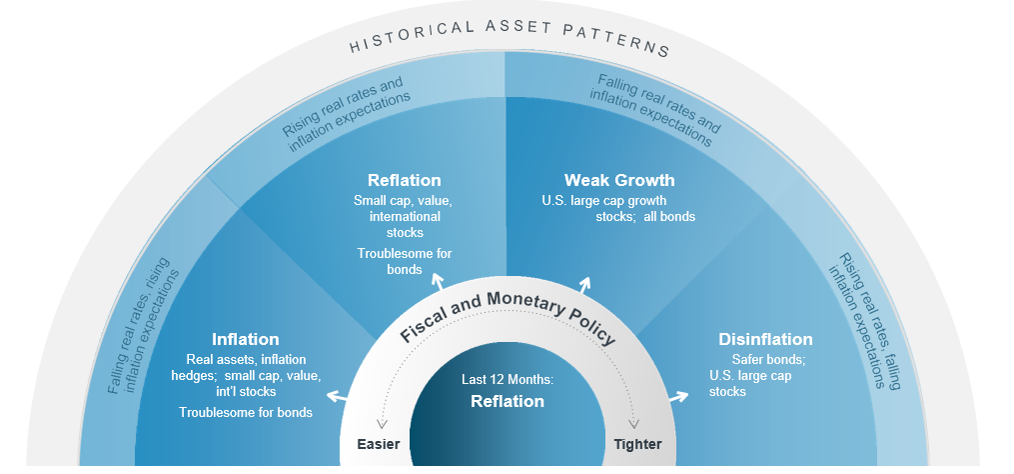
Policy, Inflation and Rates Are Critical to Market Leadership
- The macroeconomy can be classified into one of four distinct categories: Inflation, Reflation, Weak Growth and Disinflation.
- The classification is dependent on 1) how easy or tight monetary and fiscal policies are, and 2) expectations for inflation and interest rates.
- Markets experienced a reflationary dynamic of rising inflation expectations and real interest rates over the past year, which helped some assets classes more than others (ex: small cap, value stocks).
- Rising real interest rates, slightly higher inflation expectations, loose monetary policy and continued fiscal spending suggest that “reflation” may continue in the months ahead. A period of weak growth may begin in earnest once monetary and fiscal policy become less accommodative.
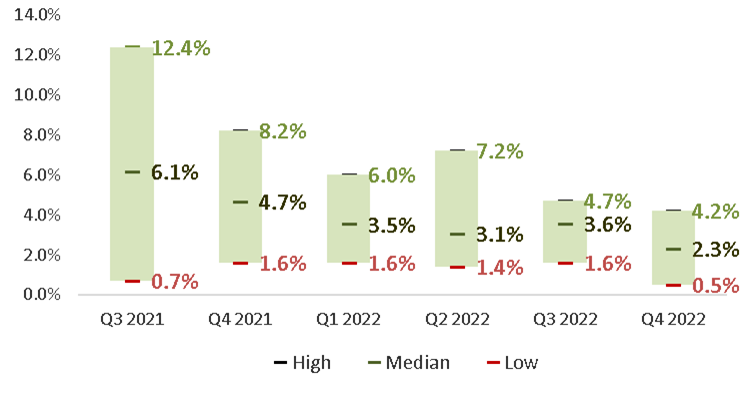
2021 Theme: Above-Trend Economic Growth
- US economic growth has been robust so far in 2021.
- US economic growth, as measured by real GDP, increased by more than 6% in the first quarter.
- Second quarter GDP, which has not been published yet, may exceed 8.5% (year over year).
- While the economy will continue to show strength throughout the rest of 2021, it is reasonable to assume that growth will begin to decelerate in the months ahead.
- By the end of 2022, economic growth in the US is expected to remain slightly above its long-term trend of 2%.
- Takeaway
- A deceleration of economic growth should not be a reason for alarm, it is a byproduct of extremely strong growth that is tough to replicate.
- A deceleration of economic growth should not be a reason for alarm, it is a byproduct of extremely strong growth that is tough to replicate.
US GDP Growth Projections (YOY)
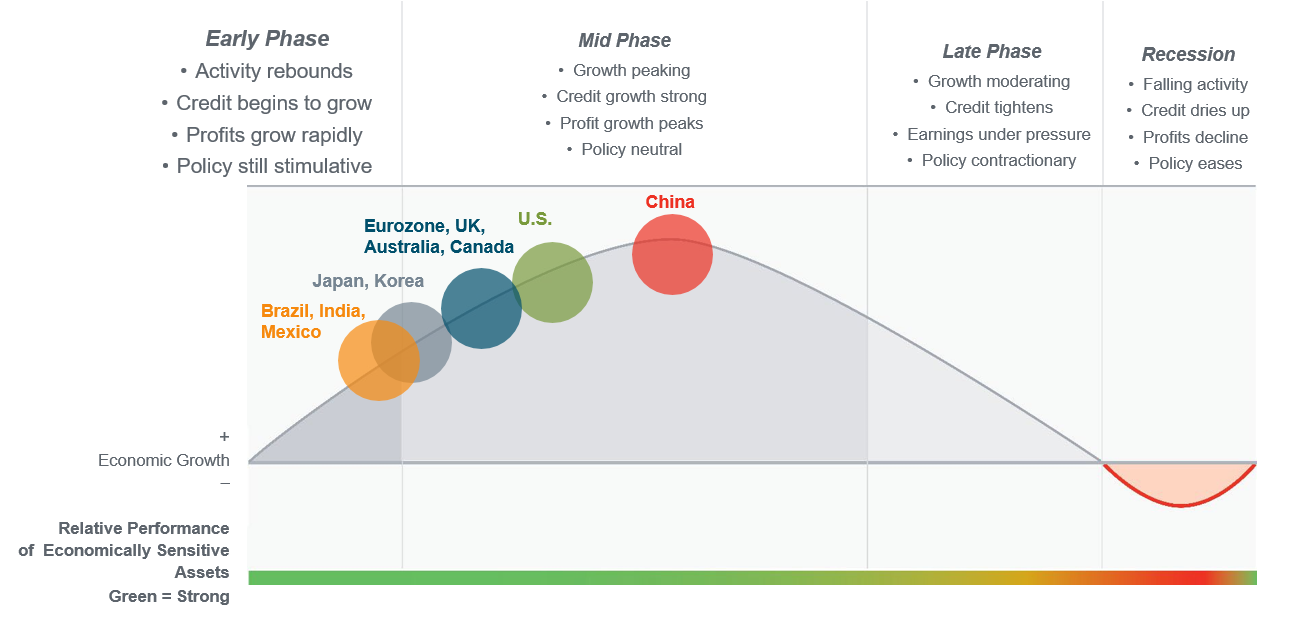
Global Economic Growth is Uneven
- The US economy has likely shifted into the mid-cycle phase, as a broadening expansion accompanied the economy’s reopening. China’s recovery is further along than any other major economy.
- Major economies are on differing trajectories, with a number of developing countries inhibited by their more limited vaccination and reopening progress.
- The global cycle’s momentum is widening, with staggered reopenings likely leading to ongoing improvement.
The Economic Cycle
2021 Theme: The Virus and Vaccines
- The “Delta” variant is beginning to concern market participants as case counts accelerate in the US.
- In the first two weeks of July 2021, case counts rose by more than 50%.
- Despite the acceleration in COVID-19 infections, however, case counts remain far below levels seen in January 2021.
- It is likely that COVID-19 case counts will continue to rise in the weeks ahead.
- With more than 50% of the population vaccinated, however, case counts in the US are unlikely to reach levels seen at the beginning of the year.
- Takeaways:
- A widespread shutdown of economic activity, such as the one experienced in the spring of 2020, is remote.
- Accelerating case counts, however, could create additional supply chain disruptions over the short term.
Confirmed US Covid Cases
7 Day Average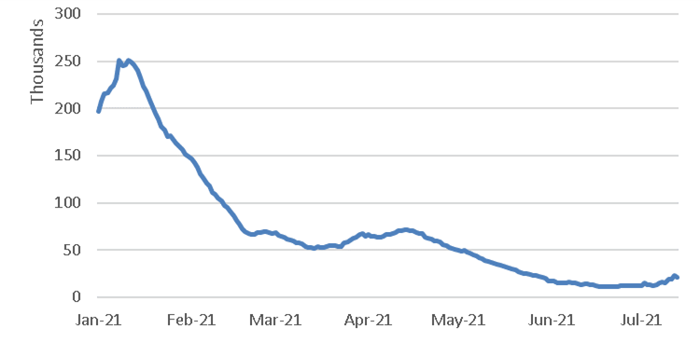
2021 Theme: Reflation: Service Inflation and Goods Inflation
- Reasons for price inflation:
- “Base Effects”: Recent inflation readings incorporate depressed price levels from economic shutdown in spring 2020.
- Strong demand for goods as a result of monetary and fiscal stimulus.
- Short supply due to labor and production shortages that resulted from shutdowns and government policy.
- Prices for goods, which tend to be more volatile than services, have increased substantially over the past year.
- Durable goods prices (automobiles, appliances, etc.) have increased by more than 5% over the past year.
- Non-durable goods inflation (clothing, household products, etc.) have increased by more than 4% over the past year.
- Prices for services have increased over the past year as well, but not to the same extent as prices for goods.
- In the months ahead, goods inflation is likely to soften while services inflation is likely to accelerate.
Consumption on Goods & Services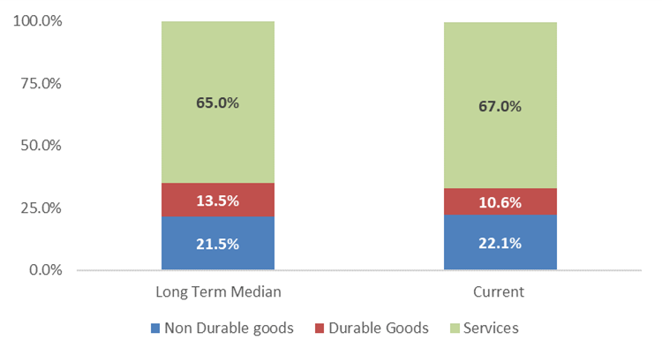 Current Inflation vs. Long Term Trend
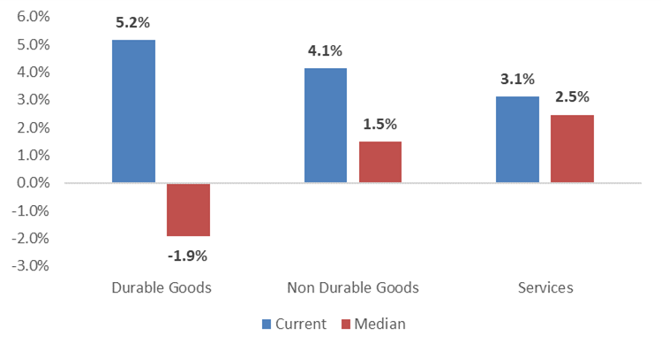
2021 Theme: Reflation
- The Treasury yield curve has steepened since the beginning of the year, which would suggest that investors anticipate higher growth and inflation in the years ahead.
- Despite the steepening curve, however, Treasury yields have fallen in recent weeks, even as high inflation measures have been published.
- Treasury markets are currently pricing in moderate inflation over the next 5-10 years.
- 5-year inflation breakeven: 2.5%
- 10-year inflation breakeven: 2.4%
US Treasury Yields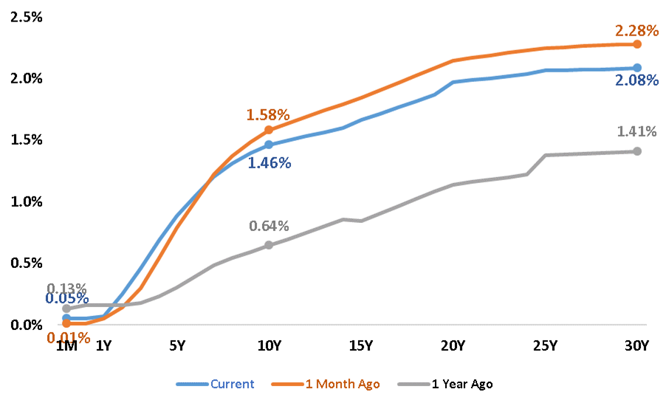 10 Year Inflation Breakevens
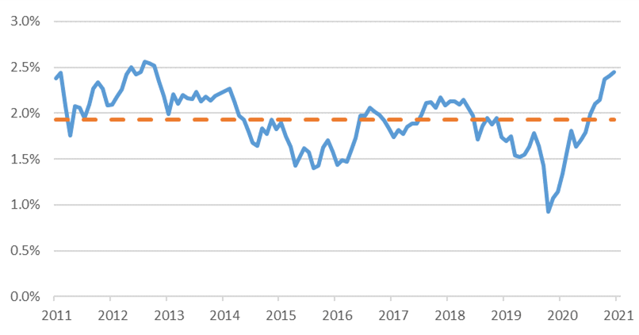
2021 Theme: Monetary Policy
- The Fed uses its monetary policies to achieve its dual mandate of:
- Full employment
- Price stability
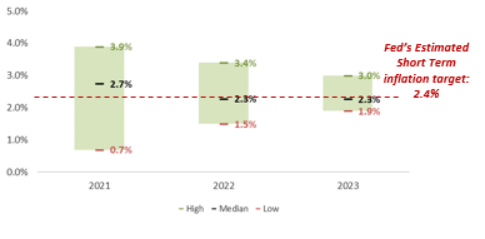
- Monetary policy is likely to remain very accommodative until unemployment reaches 4% and long-term inflation trends near 2%.
- Over the short term, the Fed’s target for inflation will be closer to 2.5% to make up for low inflation that occurred since the financial crisis.
- Takeaways:
- The Fed may begin to unwind its quantitative easing program as inflation ticks higher and unemployment improves.
- The Fed is unlikely to increase its policy rate until inflation and unemployment levels reach the Fed’s target.
US Unemployment Rate Projections
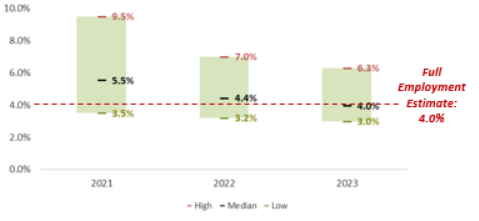
Range of US Inflation Projections
2021 Theme: Monetary Policy
- To reduce inflationary pressures in the economy, the Fed will begin to tighten its monetary policy.
- The first step the Fed will take to tighten monetary policy will be to “unwind” its quantitative easing program.
- The Fed may discuss its plans during the Jackson Hole Conference in August 2021.
- If current trends in unemployment and inflation continue, it is likely that bond purchases begin to slow in late 2021 or early 2022.
- The second step in tightening monetary policy will be for the Fed to raise its short-term policy rate.
- The Fed continues to suggest that rate hikes will not take place until 2024.
- Market participants are beginning to price in rate hikes in 2023.
Projected Fed Funds Rate Target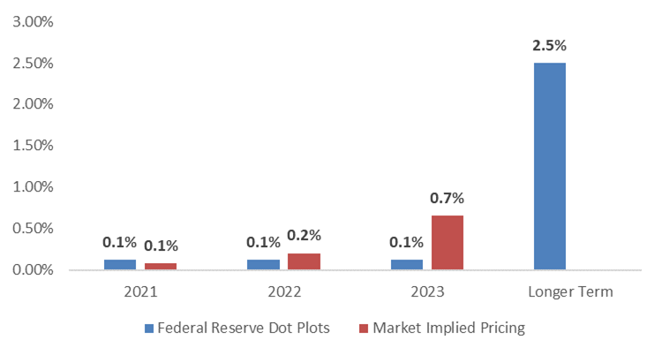 Federal Reserve Assets
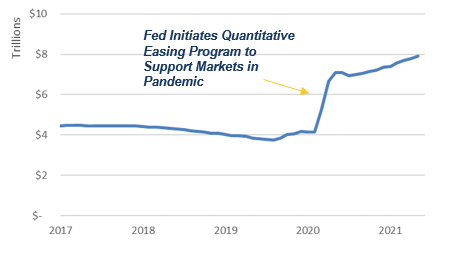
2021 Playbook: Global Equity
- Global equity valuations ticked modestly lower during Q2 amid the strong earnings rebound, but their trailing price-to-earnings (P/E) ratios remained elevated relative to their historical averages.
- US valuations are particularly rich, even when incorporating the next 12-month earnings projections.
- Forward-looking P/E ratios for developed- and emerging-market valuations are expected to fall below their long-term historical averages.
Global Stock Market P/E Ratios (Trailing 12 Months)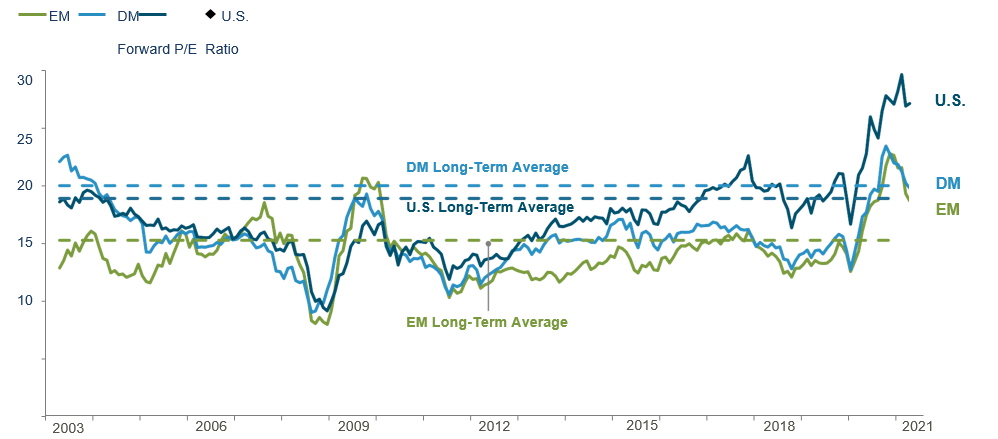
2021 Playbook: Global Equity
- Cyclically adjusted P/E (CAPE) ratios for non-US equities remained below US valuations, indicating an attractive long-term backdrop for non-US stocks.
- The US dollar was relatively steady during Q2, and it remains somewhat expensive against most major currencies, providing a positive valuation backdrop for non-US assets and currencies.
Cyclically Adjusted P/Es and Valuation of Major Currencies vs. USD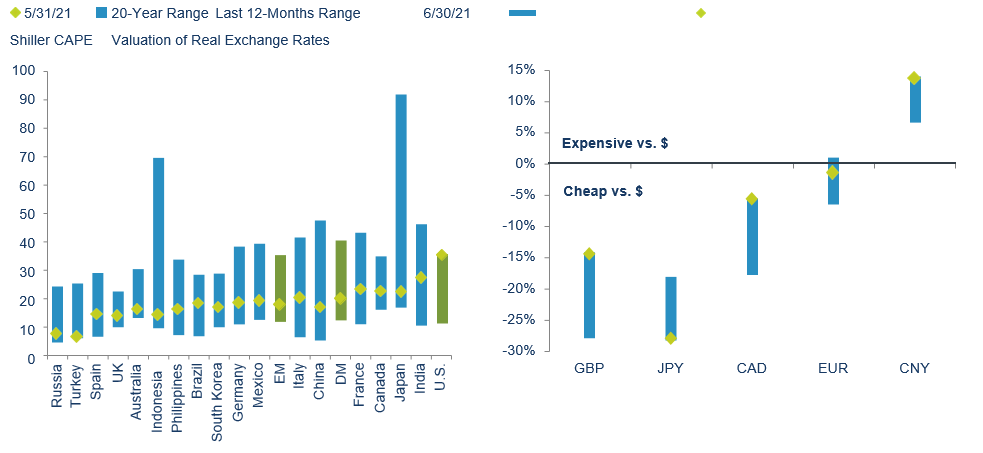
2021 Playbook: US Equity
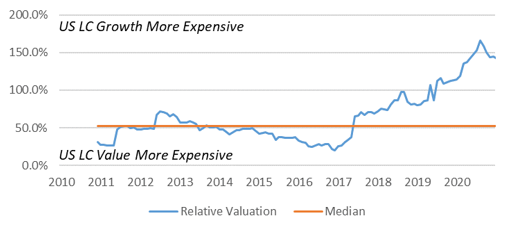
- While value stocks have outperformed YTD, large cap growth – especially more momentum names – saw a resurgence in the second quarter.
- Valuations remain high for mega-cap stocks and growth stocks.
- Value tends to perform well during periods of strong GDP growth and rising interest rates, both of which are expected over the next couple of years.
- US Large Cap Value looks particularly attractive compared to US Large Cap Growth.
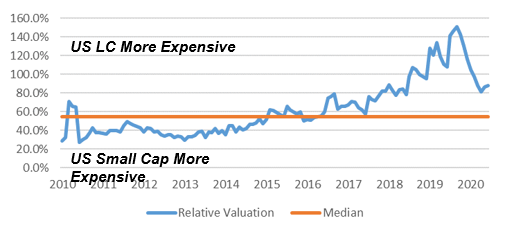
- From a fundamental valuation perspective, US Small Cap stocks look attractive compared to US Large Cap stocks.
- Takeaway:
- As the US economic recovery continues, expect Value to outperform Growth, and Small Cap to outperform Large Cap.
- As the US economic recovery continues, expect Value to outperform Growth, and Small Cap to outperform Large Cap.
Relative Valuation
US Large Cap Growth vs. US Large Cap Value
Forward P/E
Relative Valuation
US Large Cap vs. US Small Cap
Forward P/S
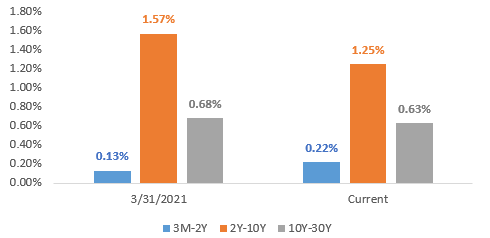
2021 Playbook: Fixed Income
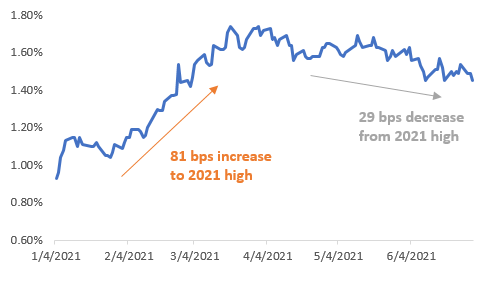
- Yields for longer date investment grade fixed income assets decreased after their run-up in the first quarter.
- A steeper yield curve was not unexpected, but the pace of the steepening in the first quarter caught many investors off guard.
- In the second quarter, the yield curve has flattened as the spreads between the 2Y-10Y and 10Y-30Y have fallen from 2021 highs.
- Short dated yields are likely to stick close to current levels until the Fed adjusts its monetary policy to become less accommodative.
- While longer dated yields are expected to continue to increase as economic recovery takes hold, it is likely that the pace of increase is gradual until the Fed signals an adjustment in its monetary policy.
- Takeaways:
- Shorter duration fixed income is likely to continue to outperform longer duration fixed income as economic recovery gains momentum
US Treasury Yield Spreads
10 Year Treasury Yield
2021 Playbook Summary
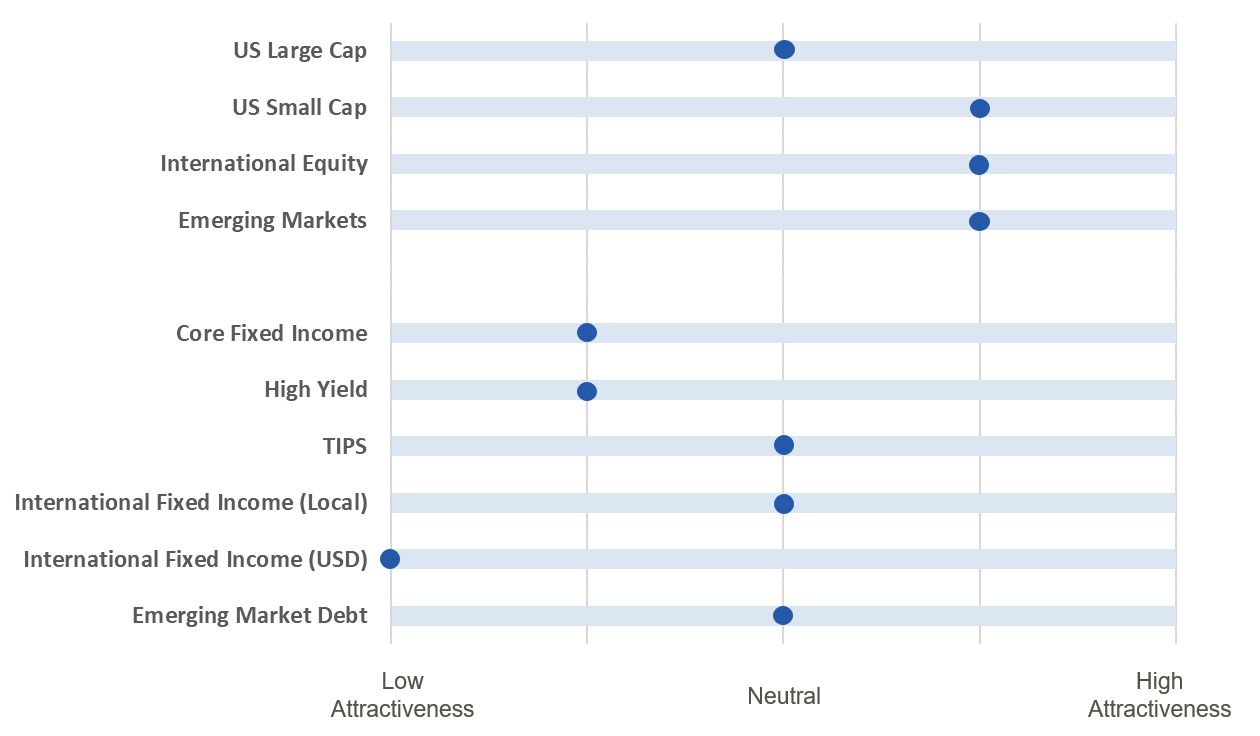 The above table indicates where each major investment asset class falls on the distribution of attractiveness (from low to high). This table is meant to provide a standardized and comparable view of the level of opportunity in each asset class category.
 - In subsequent quarters, we will discuss any movement along the scale for each asset class and the driving forces behind the change in outlook.

