Market Flash Report | August 2021

Economic Highlights
United States
- The U.S. economy grew 6.6% Y/Y in Q2 2021, slightly higher than 6.5% in the advance estimate. Upward revisions to nonresidential fixed investment (9.3% vs. 8% in the advance estimate) and exports (6.6% vs. 6%) were partly offset by downward revisions to private inventory investment, residential fixed investment (-11.5% vs -9.8%) and state and local government spending (0.3% vs. 0.8%). Imports were also revised down (6.7% vs. 7.8%). The rapid spread of the coronavirus delta variant, supply-chain disruptions, shortage of workers and a cooling housing market are seen weighing on the growth for the rest of the year.
- Manufacturing activity increased slightly in August with strength in new orders and production. Prices eased a bit in August, but the employment gauge fell back into contraction territory. Survey respondents indicated that companies are struggling to meet increased demand due to supply chain shortages. The service sector remains robust with strong growth in production and new orders. Similar supply chain and employment issues have plagued the service sector.
- Inflation continues to be a problem globally, led by supply chain disruptions stemming from COVID-19 pandemic lockdowns and restrictions. U.S. CPI surged 5.4% in July, consistent with June levels. Core CPI eased to 3.2% last month, down from 3.6% in June. Core PCE also posted a “hot” reading of 3.6% in July. All measures of inflation are running hot right now and one concern is that inflation is outpacing the 4% wage growth reported in the July employment report. Wages are difficult to deflate and one other concern is rising rents that tend to not be transitory.
Non-U.S. Developed
- The eurozone economy grew 2% Q/Q in Q2, up from contractions in Q1 and Q4 2020. Year-over-year, the eurozone economy increased 13.6%. Among the region’s largest economies, Germany, France, Spain and the Netherlands returned to growth, while Italy's expansion gathered pace. Economists expect stronger growth during the second half of 2021, but the rebound remains uncertain with the delta variant surging across the globe.
- The IHS Markit Eurozone Composite PMI was down to 59.5 in August 2021, from July's 15-year high of 60.2. The latest reading pointed to a continued solid expansion in the region’s business activity, with service sector growth exceeding that of manufacturing for the first time since the start of the pandemic. Similar to trends across the globe, manufacturing activity slowed to a 6-month low, largely due to supply chain constraints.
- The U.K. economy grew 4.8% Q/Q in Q2, up from a 1.6% contraction during Q1. Household consumption jumped 7.3% and public spending advanced 6.1%. Growth activity and demand ramped up with the easing of COVID-19 restrictions.
- The Japanese economy advanced 0.3% Q/Q in Q2 after a downward revised 0.9% contraction in Q1. Domestic demand contributed 0.6% towards the Q2 GDP growth figure.
Emerging Markets
- China’s economy grew 7.9% Y/Y during Q2, down sharply from Q1’s 18.3% clip. Economists expect growth to slow to 6.3% in Q3, but it is important to remember that China reopened its economy sooner than all other countries so the rebound is likely one quarter ahead. Retail sales continue to slow in China with July’s reading coming in at 8.5% Y/Y. Retail sales have grown M/M for most of 2021, but fell in July compared to June.
- The Caixin China Manufacturing PMI fell to 49.2 in August 2021 from 50.3 in July. This marked the first contraction in factory activity since April 2020, dragged down by containment measures to curb rising cases of the delta strain, supply bottlenecks and high raw materials. The latest Caixin reading on the service sector showed a strong increase in activity from June to July, largely driven by an acceleration in new orders.
- China’s official services PMI plunged in August to 47.5 from 53.3 in July. This was the first contraction in services activity since February 2020, dragged down by tough restrictions due to rising cases of the coronavirus delta variant, with new orders (42.2 vs. 49.7 in July), new export orders (43.9 vs. 47.7) and employment (47.0 vs. 48.2) all shrinking at steeper rates.
- India’s economy surged 20.1% in Q2 (off of a low base effect) with the construction sector jumping 68% and manufacturing rising 50%. On the consumption side, private expenditure increased 19.3%, investment 55.3%, exports 39.1% and imports 60.2% while public expenditure dropped 4.8%.
- Similar to most other countries, Brazil’s GDP increased at an annualized rate of 12.4% in Q2. South Korea’s economy advanced 5.9% Y/Y in Q2, accelerating from 1.9% growth in Q1. Finally, Indonesia’s economy grew 7.1% during Q2, up from a contraction of 0.7% in Q1.
Market Performance as of (8/31/21)
Fixed Income
- Treasury/sovereign yields trended higher in August, putting pressure on performance from core fixed income and municipal bonds.
- After widening in July, credit spreads tightened modestly last month. HY, loans and EMD all posted solid gains.
U.S. Equities
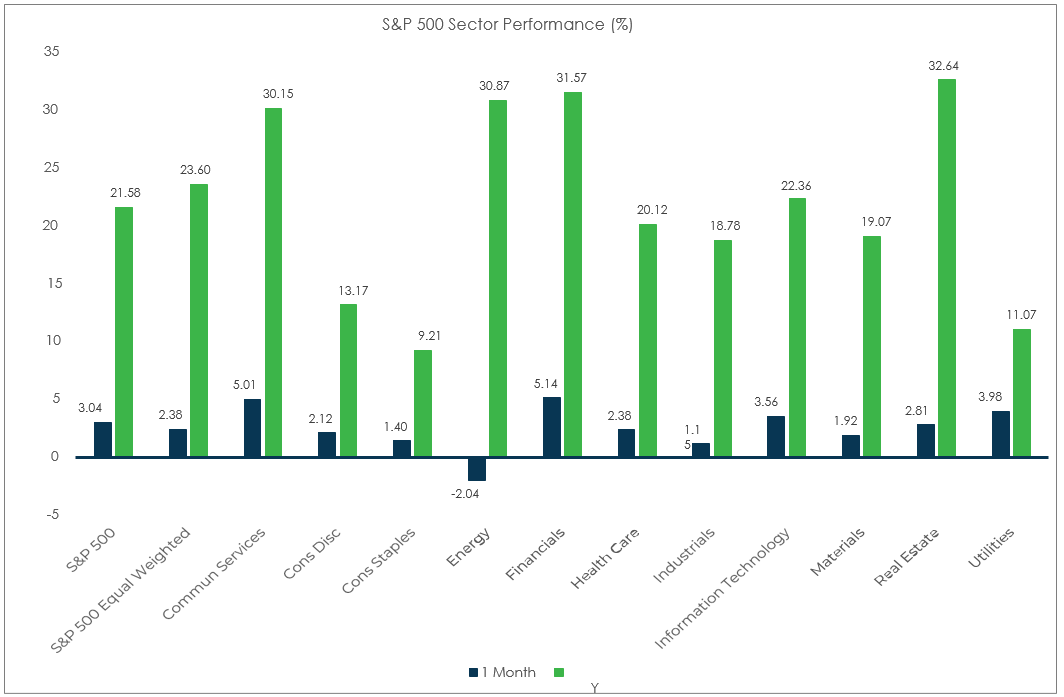
- U.S. equities posted solid gains in August led by growth/tech stocks and large caps.
- Large cap stocks beat small caps and growth trounced value within large cap equities.
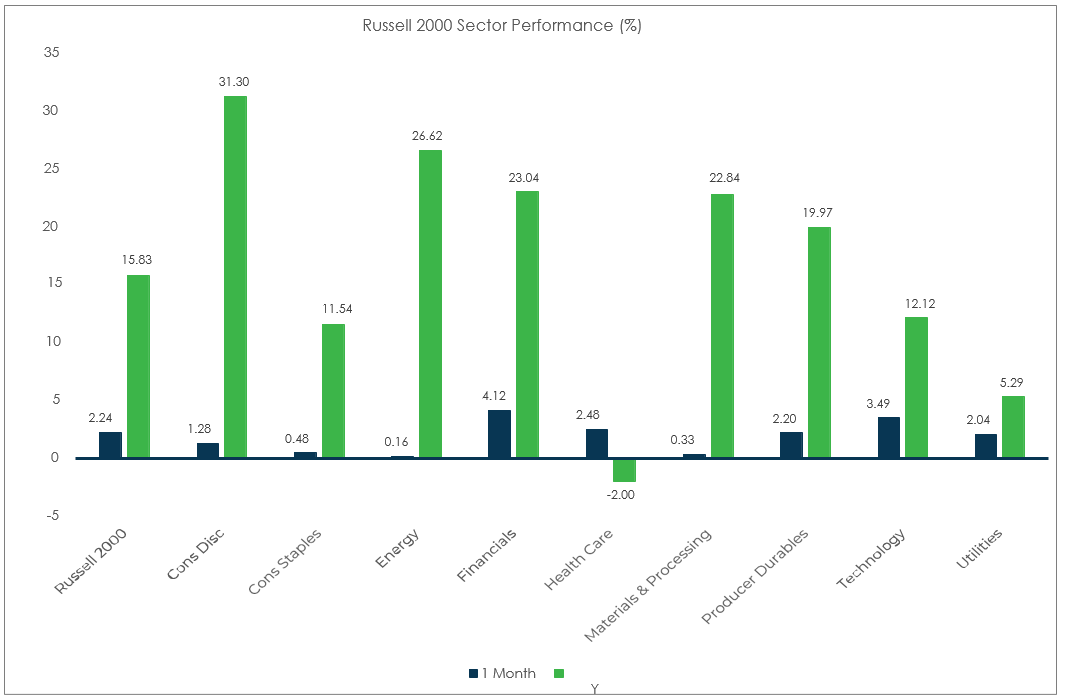
- Within small caps, value outperformed growth during August.
Non-U.S. Equities
- Non-U.S. developed equities lagged
- U.S. equities last month with particular weakness in Europe. Japan performed well. USD strength was a headwind for DMs.
- Similar to the U.S., growth outperformed value. Unlike the U.S., small caps beat large caps.
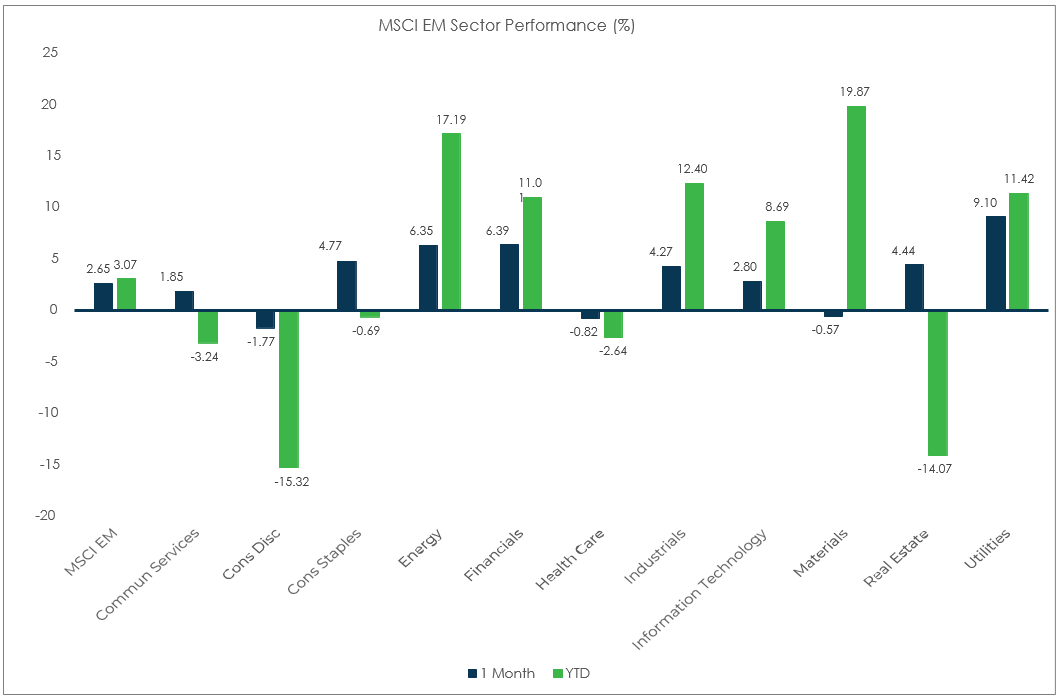
- Emerging markets rebounded and finally outpaced developed markets outside the U.S. EM Asia and EM Eastern Europe led the way in terms of performance.
Sector Performance – S&P 500 (as of 8/31/21)
Sector Performance – Russell 2000 (as of 8/31/21)
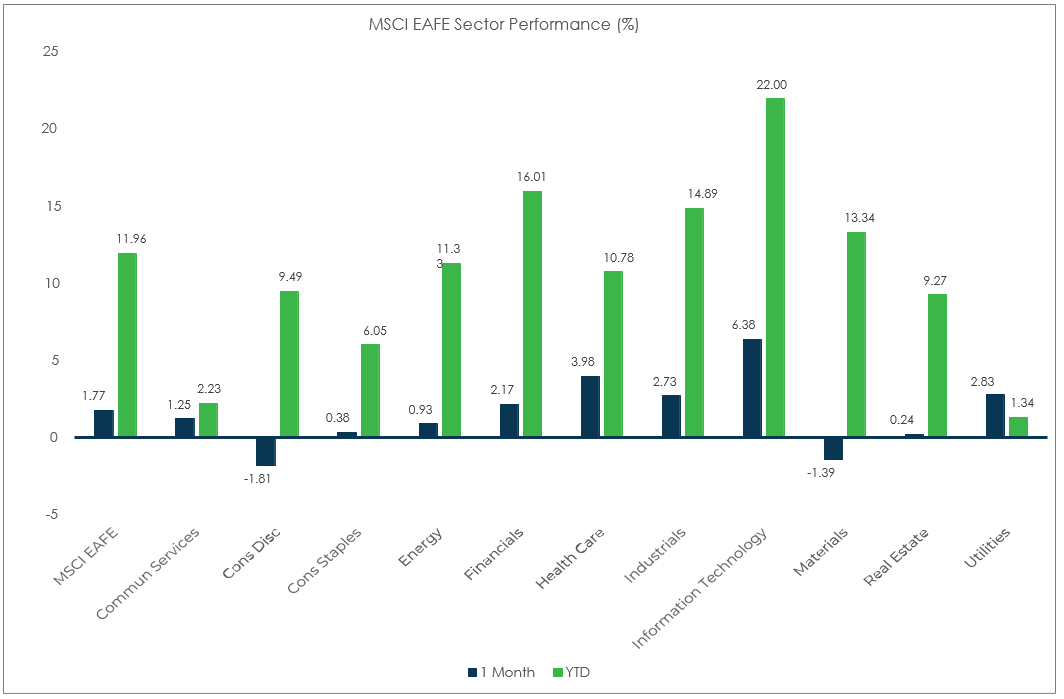
Sector Performance – MSCI EAFE (as of 8/31/21)
Sector Performance – MSCI EM (as of 8/31/21)