Market Flash Report | July 2021

Economic Highlights
United States
- U.S. GDP grew 6.5% in Q2, up slightly from the 6.3% pace in Q1, but well below expectations. Consumer spending jumped 12%,but weakness in inventories, residential investment and government spending caused the downside miss. The U.S. economy has surpassed its pre-pandemic level, but forward-looking estimates are tempered with stimulus waning and inflation surging.
- Manufacturing activity in the U.S. backed off slightly in July. The ISM Manufacturing PMI fell to 59.5 in July from 60.6 in June.The employment gauge strengthened while new orders, production and prices all weakened. Respondents indicated that while supply chain disruptions are improving, input prices are still rising and hiring is a problem.
- Inflation continues to be a problem globally, led by supply chain disruptions stemming from COVID pandemic lockdowns and restrictions. U.S. CPI surged 5.4% in June or 4.5% when excluding the volatile food and energy components. Used cars and trucks prices accelerated 10.5%, the largest increase since 1953. Used car/truck prices will likely back off, but a more worrisome trend is the increase in rent prices which could continue as workers return to work. All measures of inflation are running hot right now and one concern is that inflation is outpacing wage growth. We continue to believe the trend is transitory.
Non-U.S. Developed
- The eurozone economy grew 2% Q/Q in Q2, up from contractions in Q1 and Q4 2020. Year-over-year, the eurozone economy increased 13.7%. Portugal, Austria and Latvia registered the highest quarterly growth rates. Economists expect stronger growth during the second half of 2021, but the rebound remains uncertain with the Delta variant surging across the globe.
- Eurozone business activity grew at the fastest rate for 21 years in July as the economy continued to reopen from COVID-19 restrictions. The strongest rise in service sector activity for 15 years was tempered, however, by a slowing in manufacturing output growth, linked in many cases to worsening supply lines. The eurozone composite PMI jumped to a 21-year high in July with a reading of 60.6 (up from 59.5 in June). According to Eurostat, inflation is expected to reach 2.2% this month, a significant level that could trigger conversation on reductions in monetary stimulus from the ECB.
Emerging Markets
- China’s economy grew 7.9% Y/Y during Q2, slightly below the 8.1% estimate. Retail sales in China rose 12.1% in June from a year ago and industrial production grew 8.3% (slightly better than expected). China’s slower pace of economic recovery is still somewhat uncertain with unbalanced growth continuing as employment, household income, consumption, manufacturing investment, the service sector and private companies have yet to return to pre-pandemic levels.
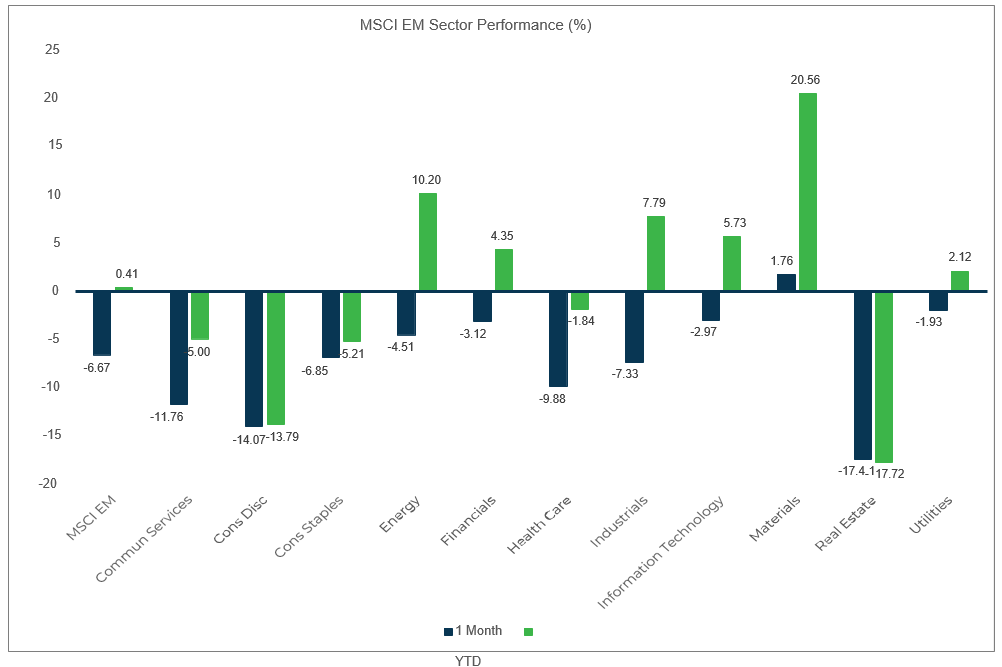
- EM equities were particularly weak in July as Chinese equity markets suffered significant losses. The MSCI EM Index fell 6.7% last month, dragged down by the 13.8% decline in the MSCI China Index. Eastern Europe has performed well as a region this year, but Asia and Latin America have shown a lot of recent weakness. COVID and poor vaccination rates have hurt EMs in general, but the Chinese government crackdown on private education and e-commerce has certainly not helped. We continue to stress that a major risk with EM equities is the reliance on China which is 38% of the benchmark.
Market Performance
(as of 7/31/21)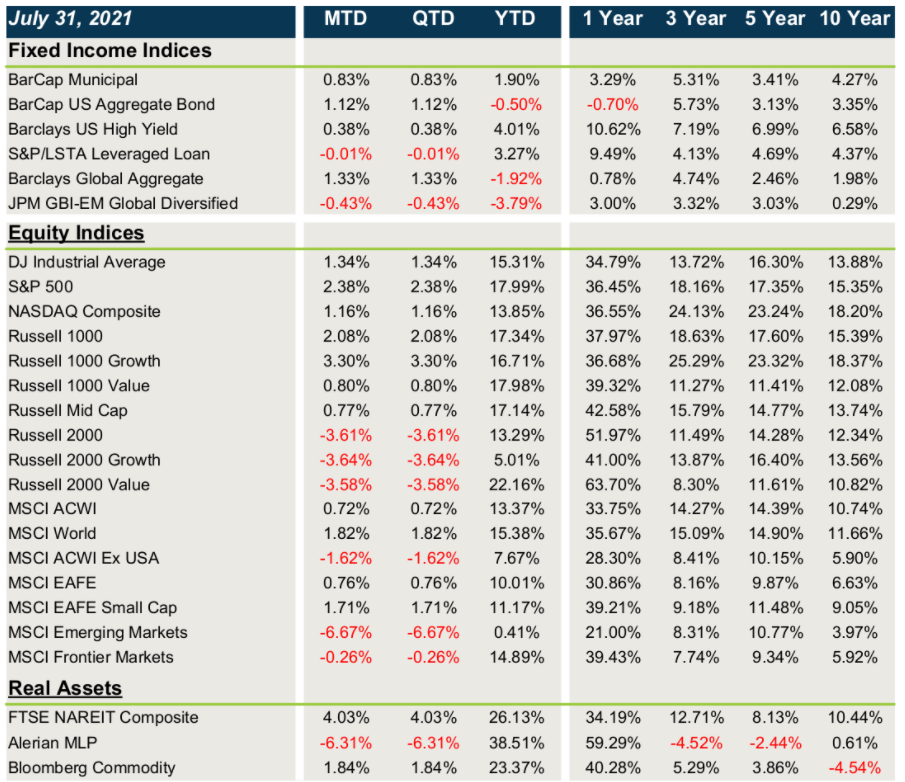
Fixed Income
- Treasury/sovereign debt yields fell sharply in July, leading to solid gains in core fixed income and municipal bonds. Credit spreads were fairly flat in July leading to mixed gains in credit. Currency was a slight tailwind for developed assets and a headwind for EM assets.
U.S. Equities
- U.S. equities posted mixed performance in July with gains in large caps and weakness in small caps.
- Within large caps, growth trounced value, but small caps saw little dispersion between styles.
- Higher quality stocks outperformed lower quality ones with cyclicals being the worst performing sectors.
Non-U.S. Equities
- Non-U.S. developed equities lagged behind their U.S. counterparts last month with the weaker USD being a slight tailwind.
- Similar to the U.S., growth beat value. Unlike the U.S., small caps outperformed large caps.
- EM equities were particularly weak in July led by a near 14% decline in China. After starting the year on a positive note, EM equities are flat YTD. The stronger USD was also a negative.
Sector Performance – S&P 500
(as of 7/31/21)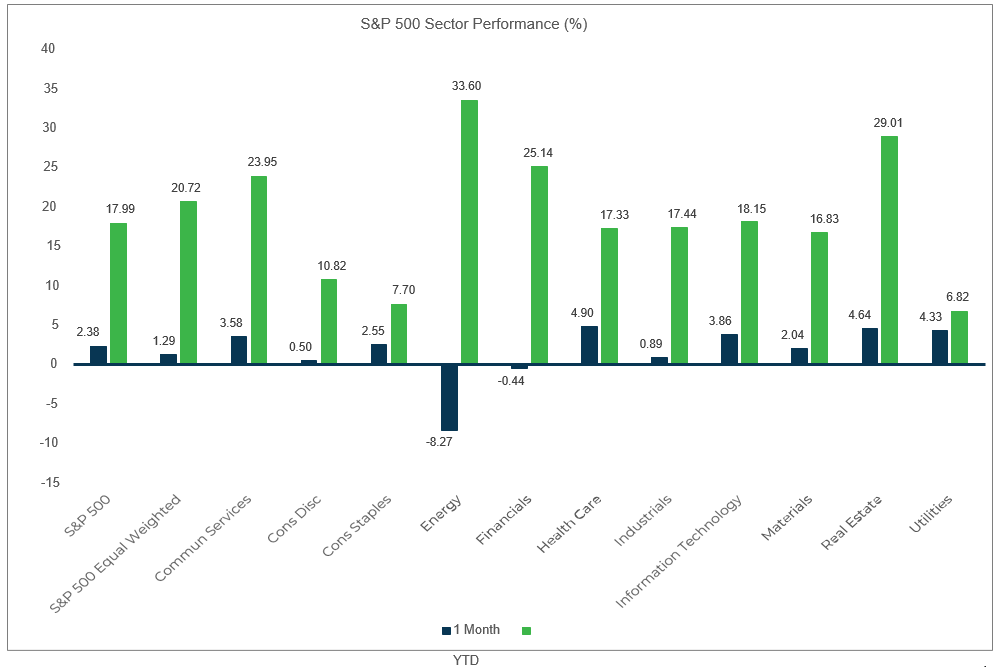
Sector Performance – Russell 2000
(as of 7/31/21)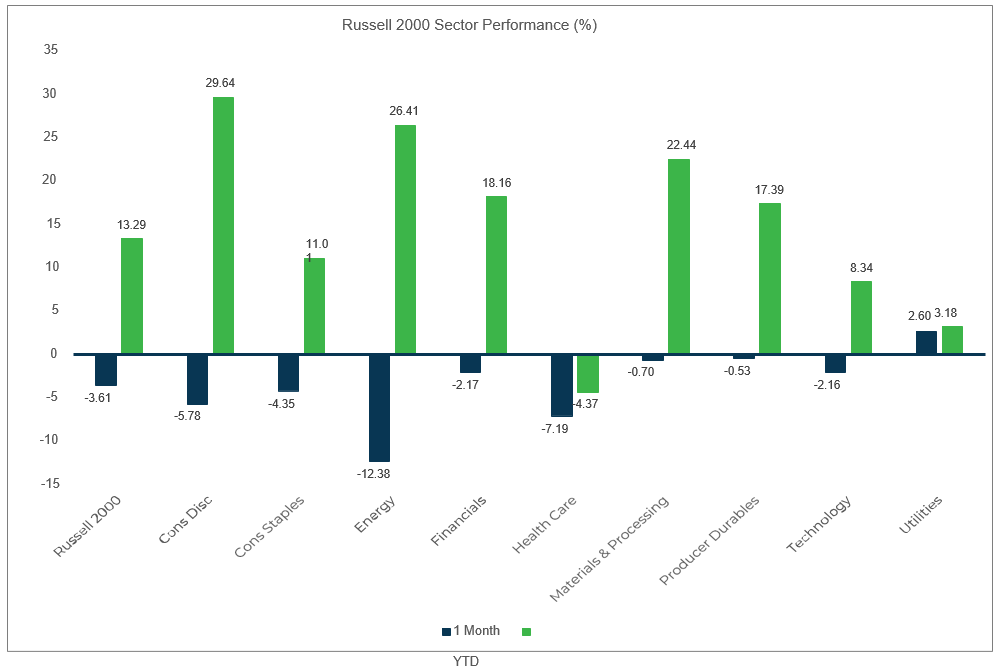
Sector Performance – MSCI EAFE
(as of 7/31/21)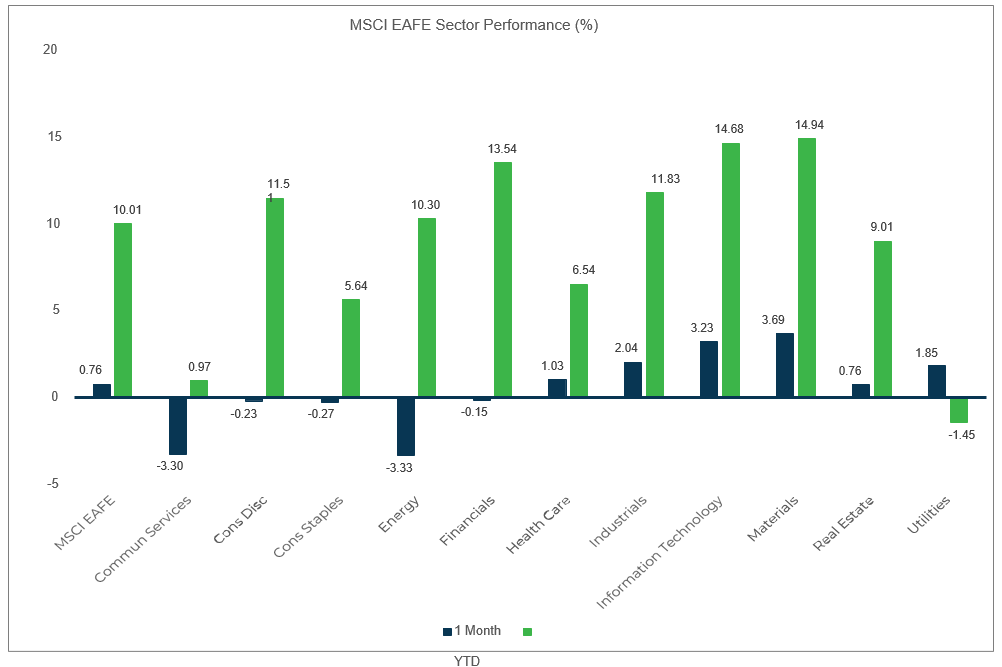
Sector Performance – MSCI EM
(as of 7/31/21)