Market Flash Report | April 2023

Economic Highlights
United States
- Growth in the U.S. slowed considerably during the first three months of the year, as interest rate increases and inflation took hold of an economy largely expected to decelerate even further ahead. GDP rose at a 1.1% annualized pace in the first quarter, well below the 2% forecast and 2.6% reading from Q4 2022. While consumer spending rose 3.7% and exports grew 4.8%, most of the weakness came from a decline in private inventories (shaved off 2.26%). While the U.S. economy appears resilient, growth is clearly slowing. PCE inflation increased 4.2% Y/Y and Core PCE rose 4.9% Y/Y.
- Job growth was largely in-line with expectations in March, but the pace of labor market growth slowed from the prior month. U.S. employers added 236,000 new jobs to the economy in March, down from February’s upwardly-revised pace of 326,000 jobs. The unemployment rate ticked lower to 3.5%, against expectations that it would hold at 3.6%, with the decrease coming as labor force participation increased to its highest level since before the COVID-19 pandemic. March job growth was at the lowest level since December 2020, but perhaps of greater importance was the trend lower in wages. Average hourly earnings increased 0.3% M/M or 4.2% Y/Y, the lowest annual rate since June 2021.
- Headline CPI came in lighter than expected in March with a M/M gain of just 0.1% or 5% Y/Y. Core CPI, which excludes volatile food and energy, increased 0.4% M/M or 5.6% Y/Y. The annual headline rate of inflation dropped sharply, but core inflation proved to be stickier. A 3.5% drop in energy costs and an unchanged food index helped keep headline inflation in check. A 0.6% increase in shelter costs was the smallest gain since November, but still resulted in prices rising 8.2% Y/Y. Although CPI is showing signs of decelerating, the headline and core readings are still well above the Federal Reserve’s 2% target.
Non-U.S. Developed
- The eurozone economy grew 0.1% Q/Q or 1.3% Y/Y in Q1 2023, based on preliminary readings. Growth came in below expectations with particular weakness in Germany, which reported flat growth while France grew 0.2%. Irish GDP was a notable weak spot, declining by 2.7% from the previous quarter, while Portugal’s economy grew by 1.6%. The European Central Bank is well behind the Fed in tackling high inflation. Eurozone headline inflation is 6.9% and core inflation sits at a record high of 5.7%.
- Eurozone business activity accelerated to an 11-month high in April, according to the latest flash PMI data. The upturn was driven by the strong rebound in demand and the surge in employment. Inflation pressures also appeared to come down based on the decline in input prices and easing of supply constraints. One major concern is the bifurcation between activity in the service and manufacturing sectors. The manufacturing sector fell back into decline with the headline PMI reading hitting a 35-month low of 45.5. On the other hand, service sector activity hit a 12-month high of 56.6. The April flash composite PMI reading was 54.4.
- Rising inflation in Japan is keep the pressure on the Bank of Japan’s ultra-easy monetary policy. Japan’s core inflation rate was consistent at 3.1% in March, although it hit a four-decade high of 3.8% when stripping out energy. There has been a lot of speculation that the BOJ may end its accommodative monetary policy to combat inflation that is already above its 2% target. We note that Japan has had a very difficult time over the past decade achieving any sustainable level of economic growth and inflation.
Emerging Markets
- The Chinese economy grew at a 4.5% annualized rate in Q1 2023, well ahead of the 4% expectation. China’s economy expanded 3% in 2022 and the government set a target of “around 5%” in 2023. In addition, retail sales jumped 10.6% in March as online sales of physical goods picked up and industrial output rose 3.9%, slightly below the 4% forecast.
- China's manufacturing activity unexpectedly shrank in April, raising pressure on policymakers seeking to boost an economy struggling for a post-COVID-19 lift-off amid subdued global demand and persistent property weakness. The official manufacturing purchasing managers' index (PMI) declined to 49.2 from 51.9 in March. It also missed the 51.4 estimate and was the first contraction since December 2022. The world's second-biggest economy grew faster than expected in the first quarter thanks to robust services consumption, but factory output has lagged amid weak global growth. Slowing prices and surging bank savings are raising doubts about demand.
- Despite the recent strength in consumption, China’s non-manufacturing PMI edged down to 56.4 versus 58.2 in March. Data showed retail sales growth quickening in March to near two-year highs, but that was off a low base and economists are cautious on the sustainability of such strength. Mixed data and underwhelming growth will likely keep pressure on policymakers to keep supportive fiscal and monetary stimulus in place.
Market Performance (as of 04/30/23)
Fixed Income
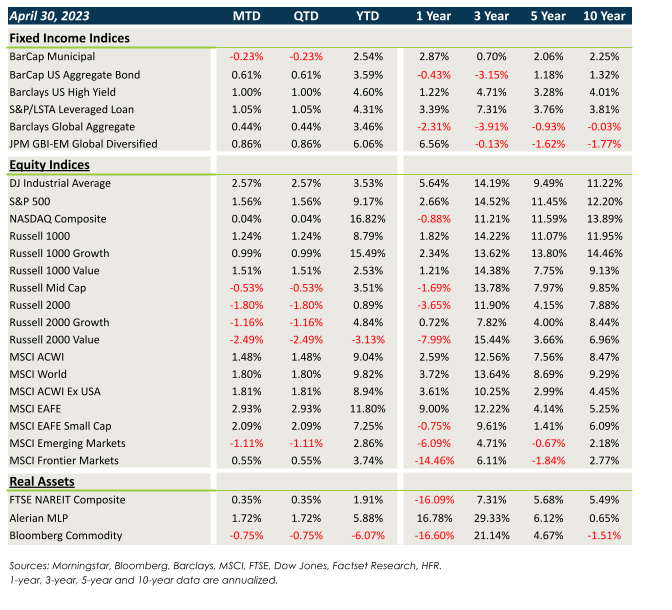
- While fairly range-bound during April, yields generally trended lower.
- Core fixed income performed well, but weak technicals led to losses in munis.
- Credit benefited from spread tightening in April, led by floating rate loans and high yield.
- Sovereign debt and EMD benefited once again from slight U.S. dollar weakness. Yields also trended lower throughout the month.
U.S. Equities
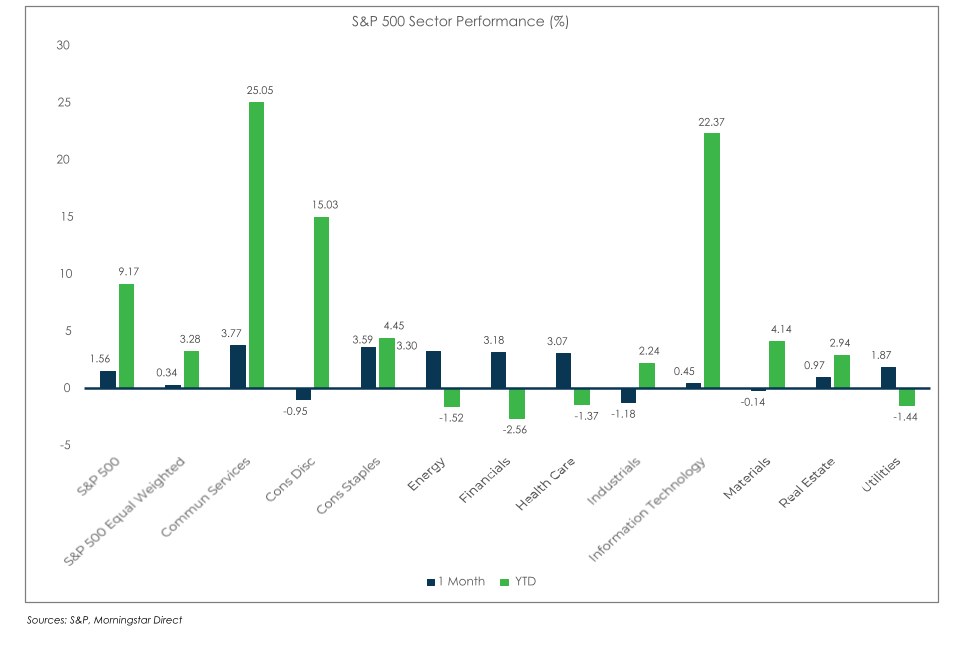
- U.S. large caps posted another month of solid performance in April.
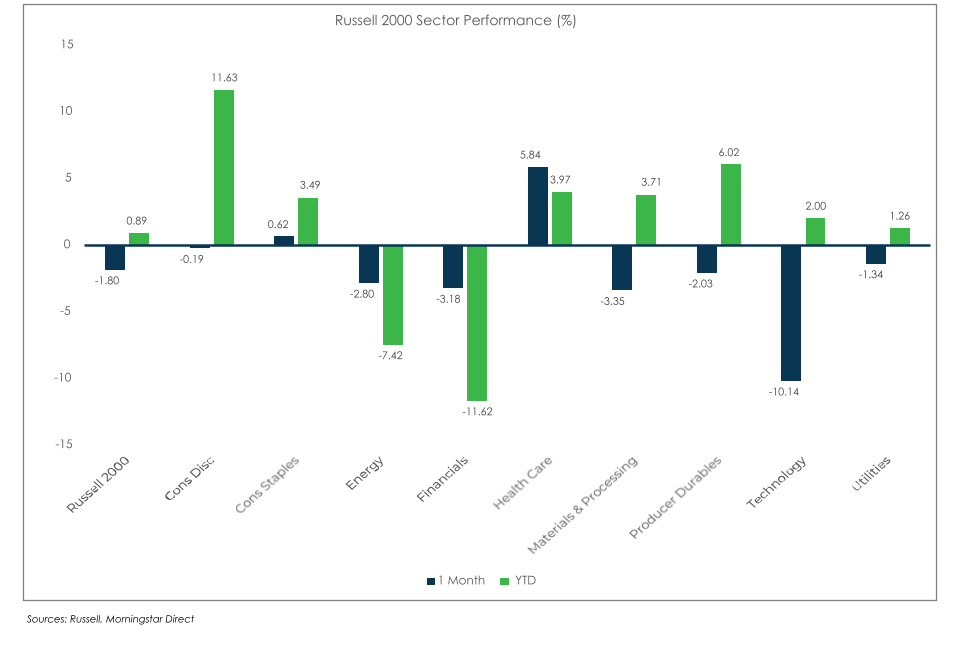
- Large caps outperformed small caps, but value stocks led growth stocks, reversing the strong YTD trend.
- Small caps were particularly weak in April as investors grew concerned about higher borrowing costs and the impact from broad economic weakness.
Non-U.S. Equities
- EAFE equities generated relative outperformance versus U.S. equities, led by the strong rebound in value stocks.
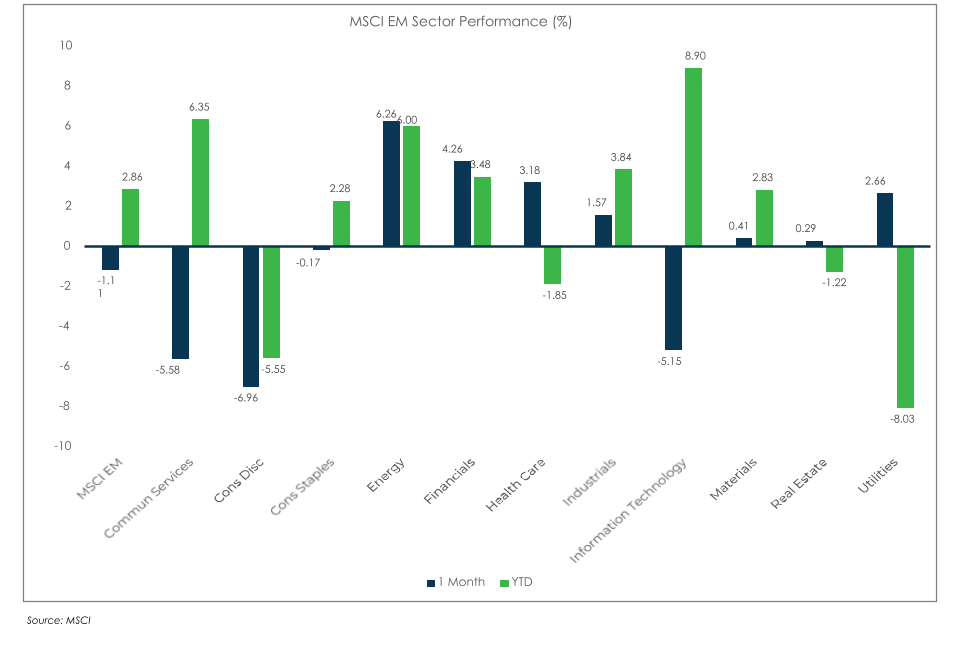
- EM equities struggled a bit last month, led by weakness in China.
- USD weakness added 55 bps to EAFE returns and 43 bps to EM returns.
S&P 500 (as of April 30, 2023)
Russell 2000 (as of April 30, 2023)
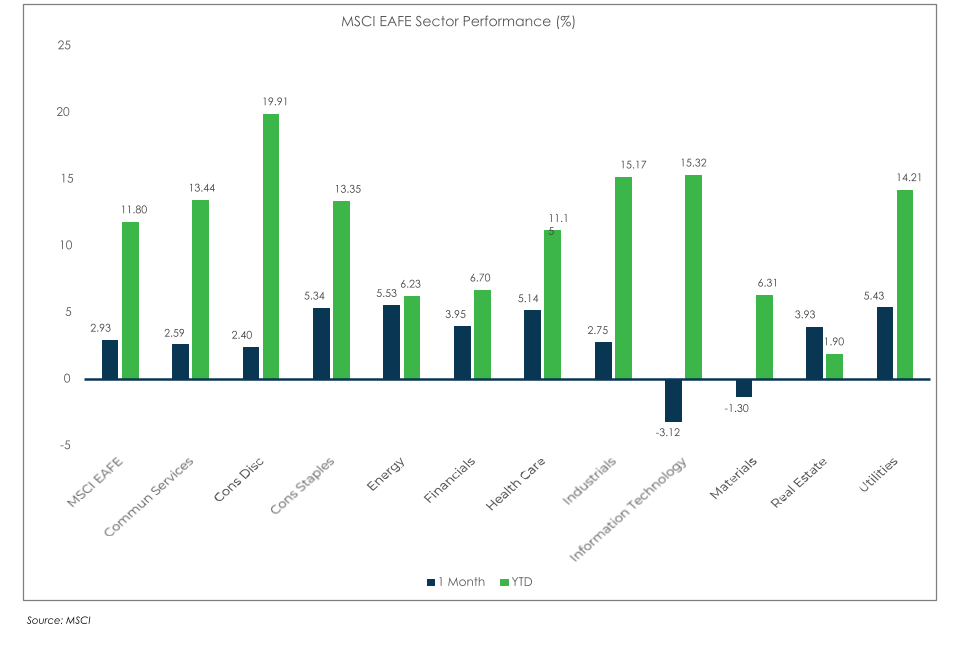
MSCI EAFE (as of April 30, 2023)
MSCI EM (as of April 30, 2023)