Market Flash Report | August 2023

Economic Highlights
United States
- The August jobs report showed some cooling, but still exceeded expectations. 187,000 new jobs were added to the U.S. economy last month, but the unemployment rate increased from 3.5% to 3.8%. The July estimate moved down by 30,000 to 157,000. June was revised lower by 80,000 to 105,000, making that the smallest month gain since December 2020. The increase in the unemployment rate largely resulted from workers re-entering the workforce. The labor participation rate of 62.8% was the highest since February 2020, before the start of the COVID-19 pandemic. The broader U6 unemployment rate surged 0.4% in August to 7.1%. Average hourly earnings increased 0.2% M/M or 4.3% Y/Y.
- Personal consumption expenditures prices, the Federal Reserve’s preferred inflation gauge, rose just 0.2% in July or 3.3% over the past 12 months. Core PCE increased at an annualized clip of 4.2%. Consumer spending was strong in July, rising 0.6% when adjusted for inflation, although real disposable personal income fell 0.2%. Households have been using credit cards and savings to compensate, as the personal savings rate fell to 3.5% in July, down sharply from the 4.3% level in June.
- U.S. GDP growth was revised lower in Q2 to 2.1% from the advanced reading of 2.4%. The economy grew at a 2.0% pace in the first quarter and continues to push ahead despite 525 bps worth of interest rate hikes from the Fed since March 2022. Economists are expecting a surge in growth for the U.S. economy in Q3 based on current economic data. The Atlanta Fed estimates that the U.S. economy will grow 5.6% in Q3.
- Based on data released by the Institute of Supply Management (ISM), the U.S. manufacturing sector contracted for the 10th consecutive month. The ISM Manufacturing PMI increased to 47.6 in August from 46.4 in July. New orders weakened last month, but employment and production showed some strength.
Non-U.S. Developed
- Eurozone business activity contracted at an accelerating pace in August as the region’s downturn spread further from manufacturing to services. Both sectors reported falling output and new orders, albeit with the goods-producing sector registering by far the sharper rate of decline. The eurozone composite PMI fell to a 33-month low of 47.0 in August, while the services PMI declined to a 30-month low of 48.3. The manufacturing PMI, which has been in contraction territory for a long time now, increased to a 3-month high of 43.7. Current PMI figures suggest that eurozone GDP will shrink by 0.2% in Q3.
- Headline inflation in the eurozone was flat in August at 5.3%, but came in above economist expectations of 5.1%. Core inflation also came in at an annualized rate of 5.3%. The European Central Bank (ECB) is due to meet on September 14 and announce whether it is raising rates further. Since July 2022, the ECB has lifted rates by 4.25%.
- Japan topped growth estimates in Q2, reporting a surge of 6% in GDP. The Q2 reading was ahead of estimates and the 2.7% Y/Y growth reported in Q1. Exports rebounded 3.2% Q/Q, largely driven by a spike in car shipments. While the headline number is impressive, the underlying details show weakness. Most of the upside came from net trade, while private consumption fell 0.5%, signaling soft domestic demand. The Bank of Japan took steps last month to allow long-term interest rates to rise, a move seen as the beginning of a gradual shift away from massive monetary stimulus.
Emerging Markets
- While the Chinese economy has shown significant cracks and slowing in recent months, the manufacturing sector posted a modest rebound in activity in August. The Caixin/S&P Global Manufacturing PMI increased to 51.0 in August from 49.2 in the prior month. This was the highest reading since February and it showed improvements in employment, supply and domestic demand. China’s official state manufacturing PMI improved to 49.7 last month versus 49.3 in July.
- China continues to suffer from weak external demand and slowing global growth that hurts exports. Imports dropped 12.4% in July Y/Y, while exports contracted 14.5% after tumbling 12.4% in June. The pace of export decline was the fastest since the onset of the COVID-19 pandemic in early 2020 and the decline in imports was the biggest since January this year, when COVID-19 infections shut shops and factories.
- Real estate accounts for between a quarter and a third of China’s gross domestic product, and the issues in the sector have wide-ranging consequences on the economy and financial sector. Last week, Country Garden, one of the largest private real estate developers in China, reported a $7B loss for the first half of 2023 and warned it is on the brink of default. China’s property woes emerged in 2021, when Evergrande defaulted on its debt. Other than Evergrande, Chinese developers that have defaulted so far include Kaisa Group, Shimao Group and Times China.
- India’s economy grew at its quickest pace in a year in Q2, buoyed by strong services activity and robust demand, but a drier than normal monsoon season could restrain future growth. GDP expanded 7.8% on an annual basis in Q2, accelerating from 6.1% growth recorded in Q1. In Q2, private consumption, which accounts for nearly 60% of the Indian economy, grew by about 6% Y/Y, up from 2.8% in Q1.
Market Performance (as of 08/31/23)
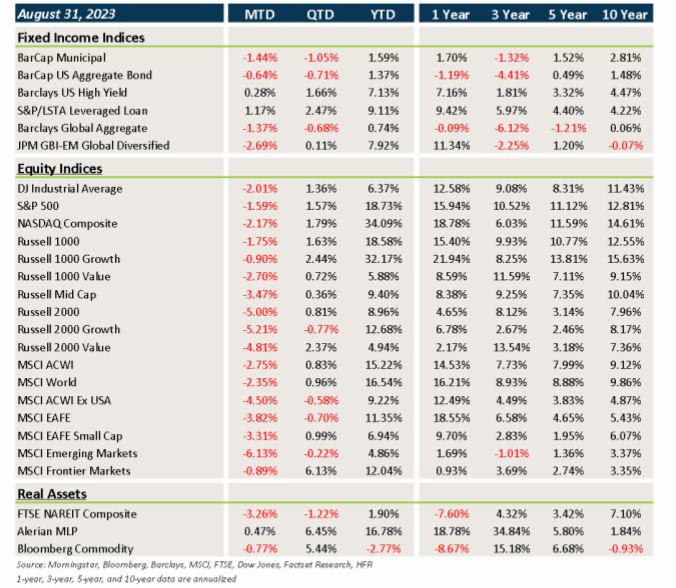
Fixed Income
- Treasury and sovereign debt yields continued their trek higher in August, which led to losses in core fixed income and municipal bonds.
- Although credit spreads widened a bit last month, higher carry more than offset any losses.
- Bonds outside the U.S. were also impacted by U.S. dollar strength versus most developed and emerging currencies.
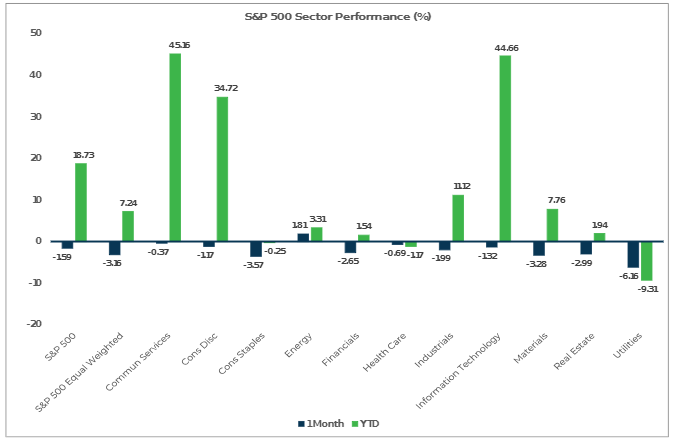
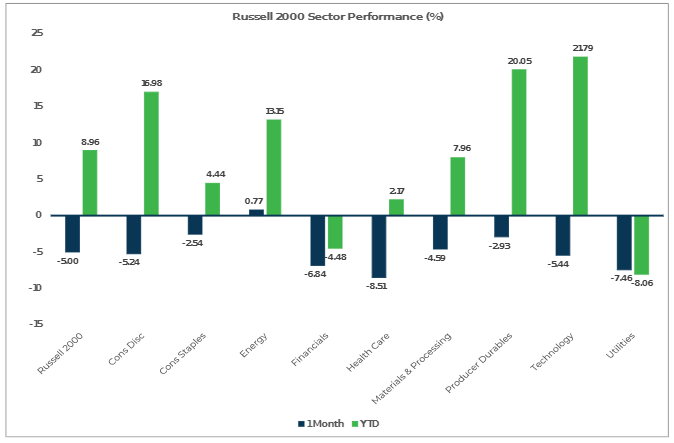
U.S. Equities
- Equities fell across the board in August, but after posting sharp losses during the first half of the month, prices rallied over the final two weeks.
- Growth beat value in large caps, but value led growth across small caps.
- Small cap stocks lagged large cap stocks by a fairly wide margin in August.
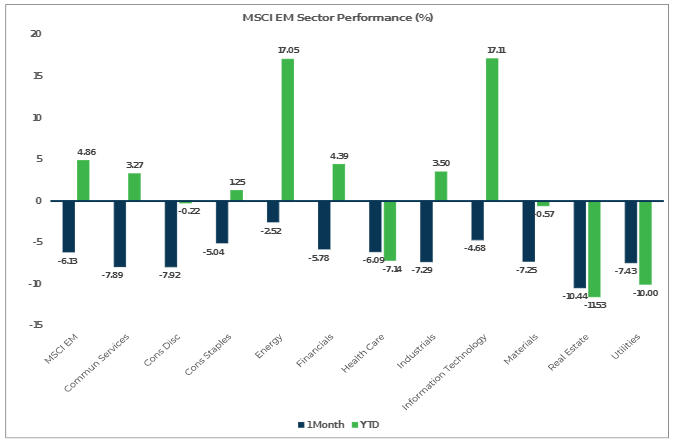
Non-U.S. Equities
- Non-U.S. equities posted losses in both local and U.S. dollar terms last month.
- Non-U.S. equities underperformed U.S. equities in August and, unlike the U.S., small caps led large caps.
- Value also outperformed growth within EAFE equities.
- The stronger U.S. dollar cost investors 200 bps in EAFE equities and 148 bps within EM equities.
S&P 500 (as of Aug 31, 2023)
Russell 2000 (as of August 31, 2023)
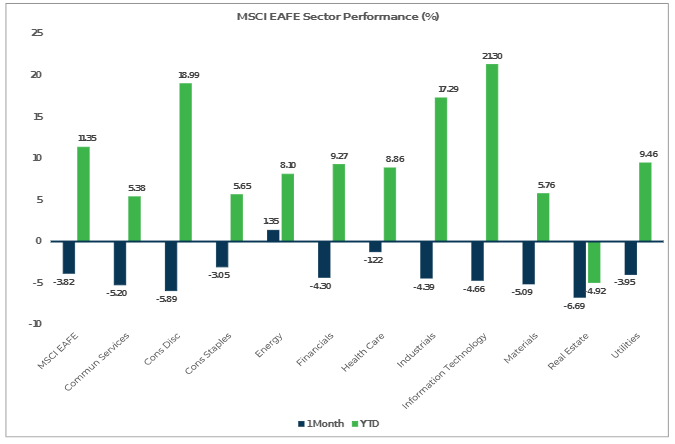
MSCI EAFE (as of August 31, 2023)
MSCI EM (as of August 31, 2023)