Market Flash Report | August 2025

Economic Highlights
United States
- The U.S. economy grew at a faster rate than previously thought in Q2, based on the second revision released at the end of August. Q2 GDP growth was revised up to 3.3% from the advanced estimate of 3.1%. The revision stemmed primarily from upward revisions to investment and consumer spending that were partly offset by downward revisions to government spending as well as an upward revision to imports. Consumer spending rose 1.6%, as opposed to the initial estimate of 1.4% growth. This strong rebound comes on the heels of the weak (-0.5%) Q1 GDP report.
- The PCE price index showed that core inflation ran at a 2.9% seasonally adjusted annual rate in July, meeting estimates but increasing from June. Headline PCE rose 0.2% M/M, or 2.6% Y/Y. Inflation numbers were held in check by a 2.7% annual decline in prices for energy goods and services. Food prices rose 1.9% from a year ago. The balance also tilted heavily toward services prices, which jumped 3.6% compared with just a 0.5% increase in goods.
- The manufacturing sector in the U.S. gained a bit of strength in August, but overall activity remained in contraction territory for the sixth straight month. The ISM Manufacturing PMI increased from 48.0 in July to 48.7 in August. New orders and employment strengthened last month, but the prices and production components weakened. Survey respondents cited uncertainty and softness in the manufacturing environment.
- U.S. retail sales increased 0.5% M/M in July 2025, in line with market expectations and following an upwardly revised 0.9% rise in June. The largest increases were seen in sales at motor vehicle and parts dealers (1.6%) and furniture and home furnishing stores (1.4%). Core retail sales, which help calculate GDP, gained 0.5% last month, a positive trend after a bigger-than-expected jump of 0.8% in July. These figures continue to support healthy consumer spending trends in the U.S.
Non U.S. Developed
- The eurozone Composite PMI remained in expansion territory in August with a reading of 51.1, up from 50.9 in July (fifteenth month high). Services weakened a bit last month, but manufacturing jumped back into expansion territory with a reading of 50.5 (38-month high). The eurozone’s largest economy, Germany, posted a third successive monthly increase in output during August on the back of a solid expansion in manufacturing production. The rest of the major eurozone countries posted solid readings. Despite the headwinds from U.S. tariffs and geopolitical issues, eurozone manufacturing and services appear to be on solid footing with economic growth that could see a small boost in Q3.
- Eurozone inflation edged higher to a 2.1% annual rate in August, up from 2% in the prior month. Core inflation, which strips out more volatile food, energy, alcohol and tobacco prices, was unchanged from 2.3% in July. The closely watched services print, meanwhile, was slightly lower in August at 3.1%, compared to 3.2% in July. After slashing borrowing rates over the past 18-24 months, the European Central Bank is expected to hold rates steady at its September meeting.
- Japan’s economy grew more than anticipated in Q2. GDP expanded 0.3% Q/Q or 1% on an annualized basis, driven mainly by net exports, which contributed 0.3% to GDP during Q2. While this report was better than expected, the impact from tariffs was not felt much during Q2.
Emerging Markets
- China’s manufacturing sector unexpectedly returned to growth in August, according to the private survey from RatingDog. The RatingDog Manufacturing PMI of 50.5 in August was an increase from 49.5 in July and well ahead of economist expectations. The improvement was in part driven by a recovery in new export orders, indicating the resilience of external demand in the face of tariffs. The results of this private survey were still more upbeat than the official government reading released Sunday, which showed manufacturing activity shrank for a fifth straight month in August, coming in at 49.4 compared with 49.3 in July.
- The official government non-manufacturing PMI index, covering services and construction, expanded to 50.3 in August from 50.1 in the prior month. China’s exports growth has beaten expectations in recent months, driven largely by a surge in shipments to Southeast Asia and European countries, while shipments to the U.S. have declined for four straight months.
- China's retail sales increased by 3.7% year-on-year in July 2025, slowing from 4.8% in June. The latest figure marked the weakest growth since December 2024, as sales moderated across several categories, including grain, oil and food (8.6% vs. 8.7% in June), clothing, shoes, hats and textiles (1.8% vs. 1.9%), household appliances and audio-visual equipment (28.7% vs. 32.4%), cultural and office supplies (13.8% vs. 24.4%), and furniture (20.6% vs 28.7%).
- Inflation in China rose 0.4% in July but remains flat Y/Y. Core inflation increased 0.8% Y/Y in July, up slightly from June’s 0.7% Y/Y reading. Producer prices extended their deflation streak to 35 consecutive months, with a decline of 3.6% Y/Y in July.
Fixed Income
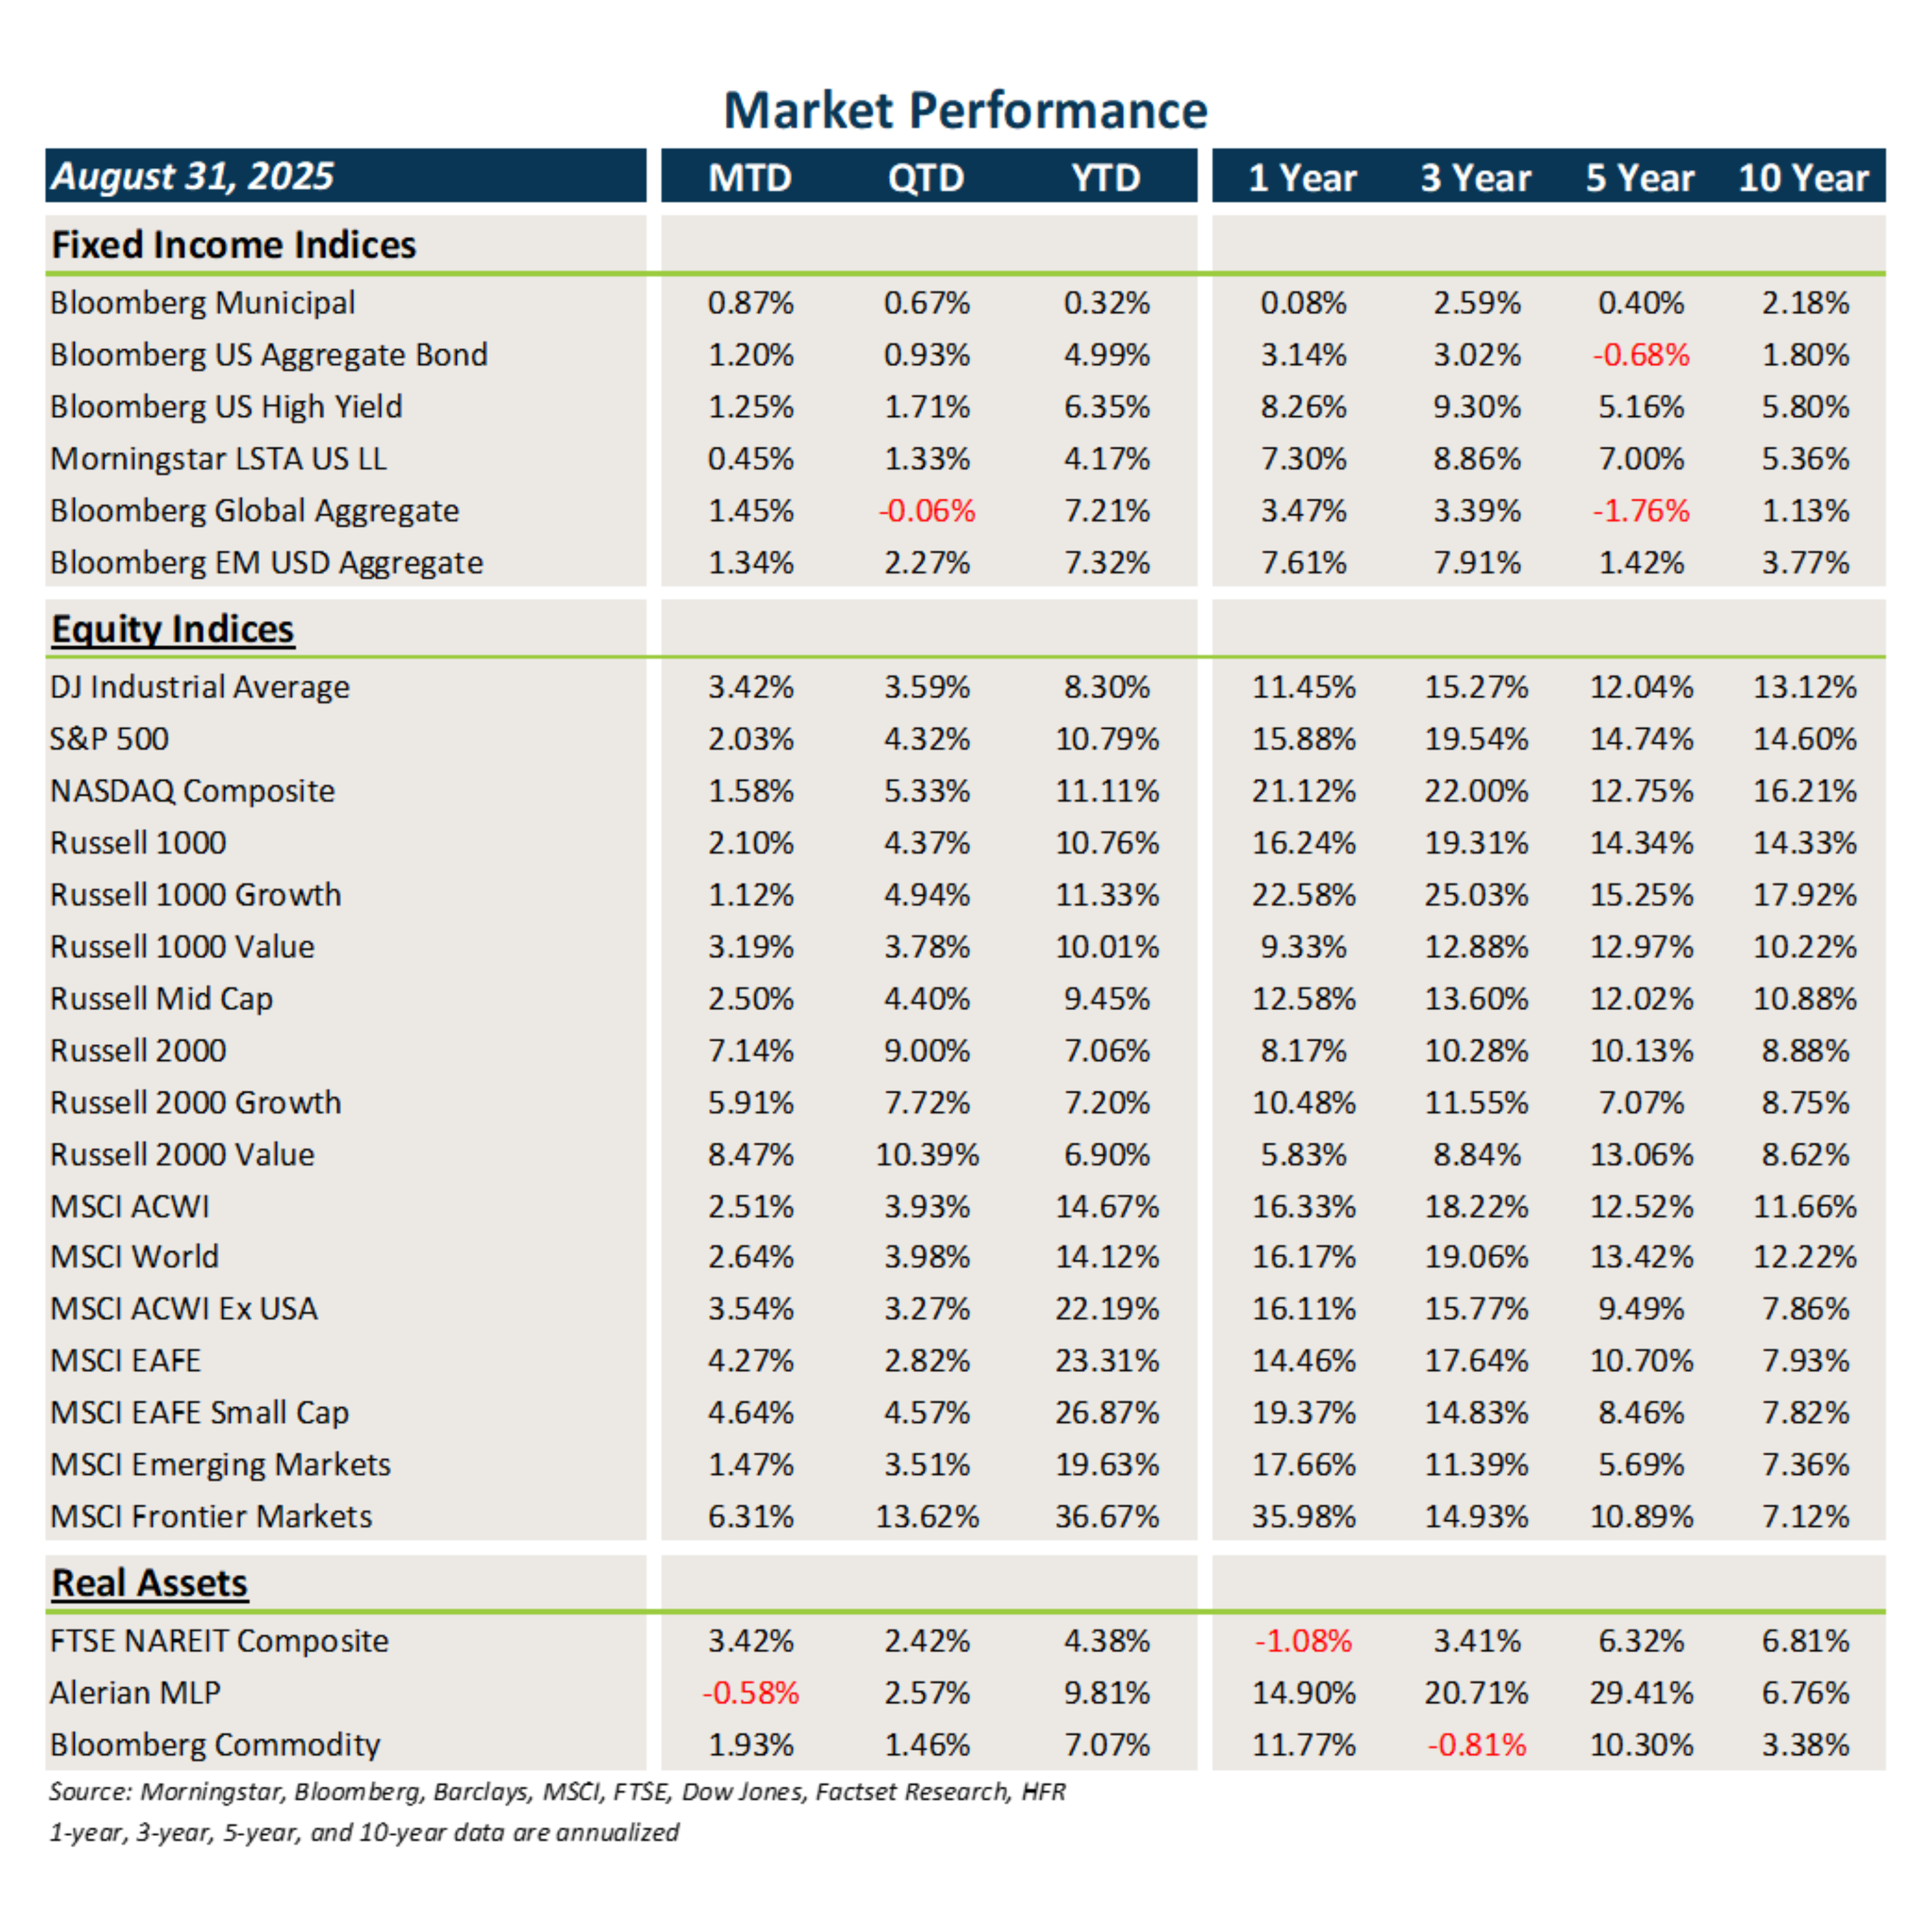
- Interest rates remained volatile throughout August but ultimately trended lower, providing a nice boost to core fixed income and municipal bonds.
- Credit spreads tightened in August, fueling solid gains in HY, loans and EMD.
- U.S. dollar weakness once again added to returns across non-U.S. assets.
U.S. Equities
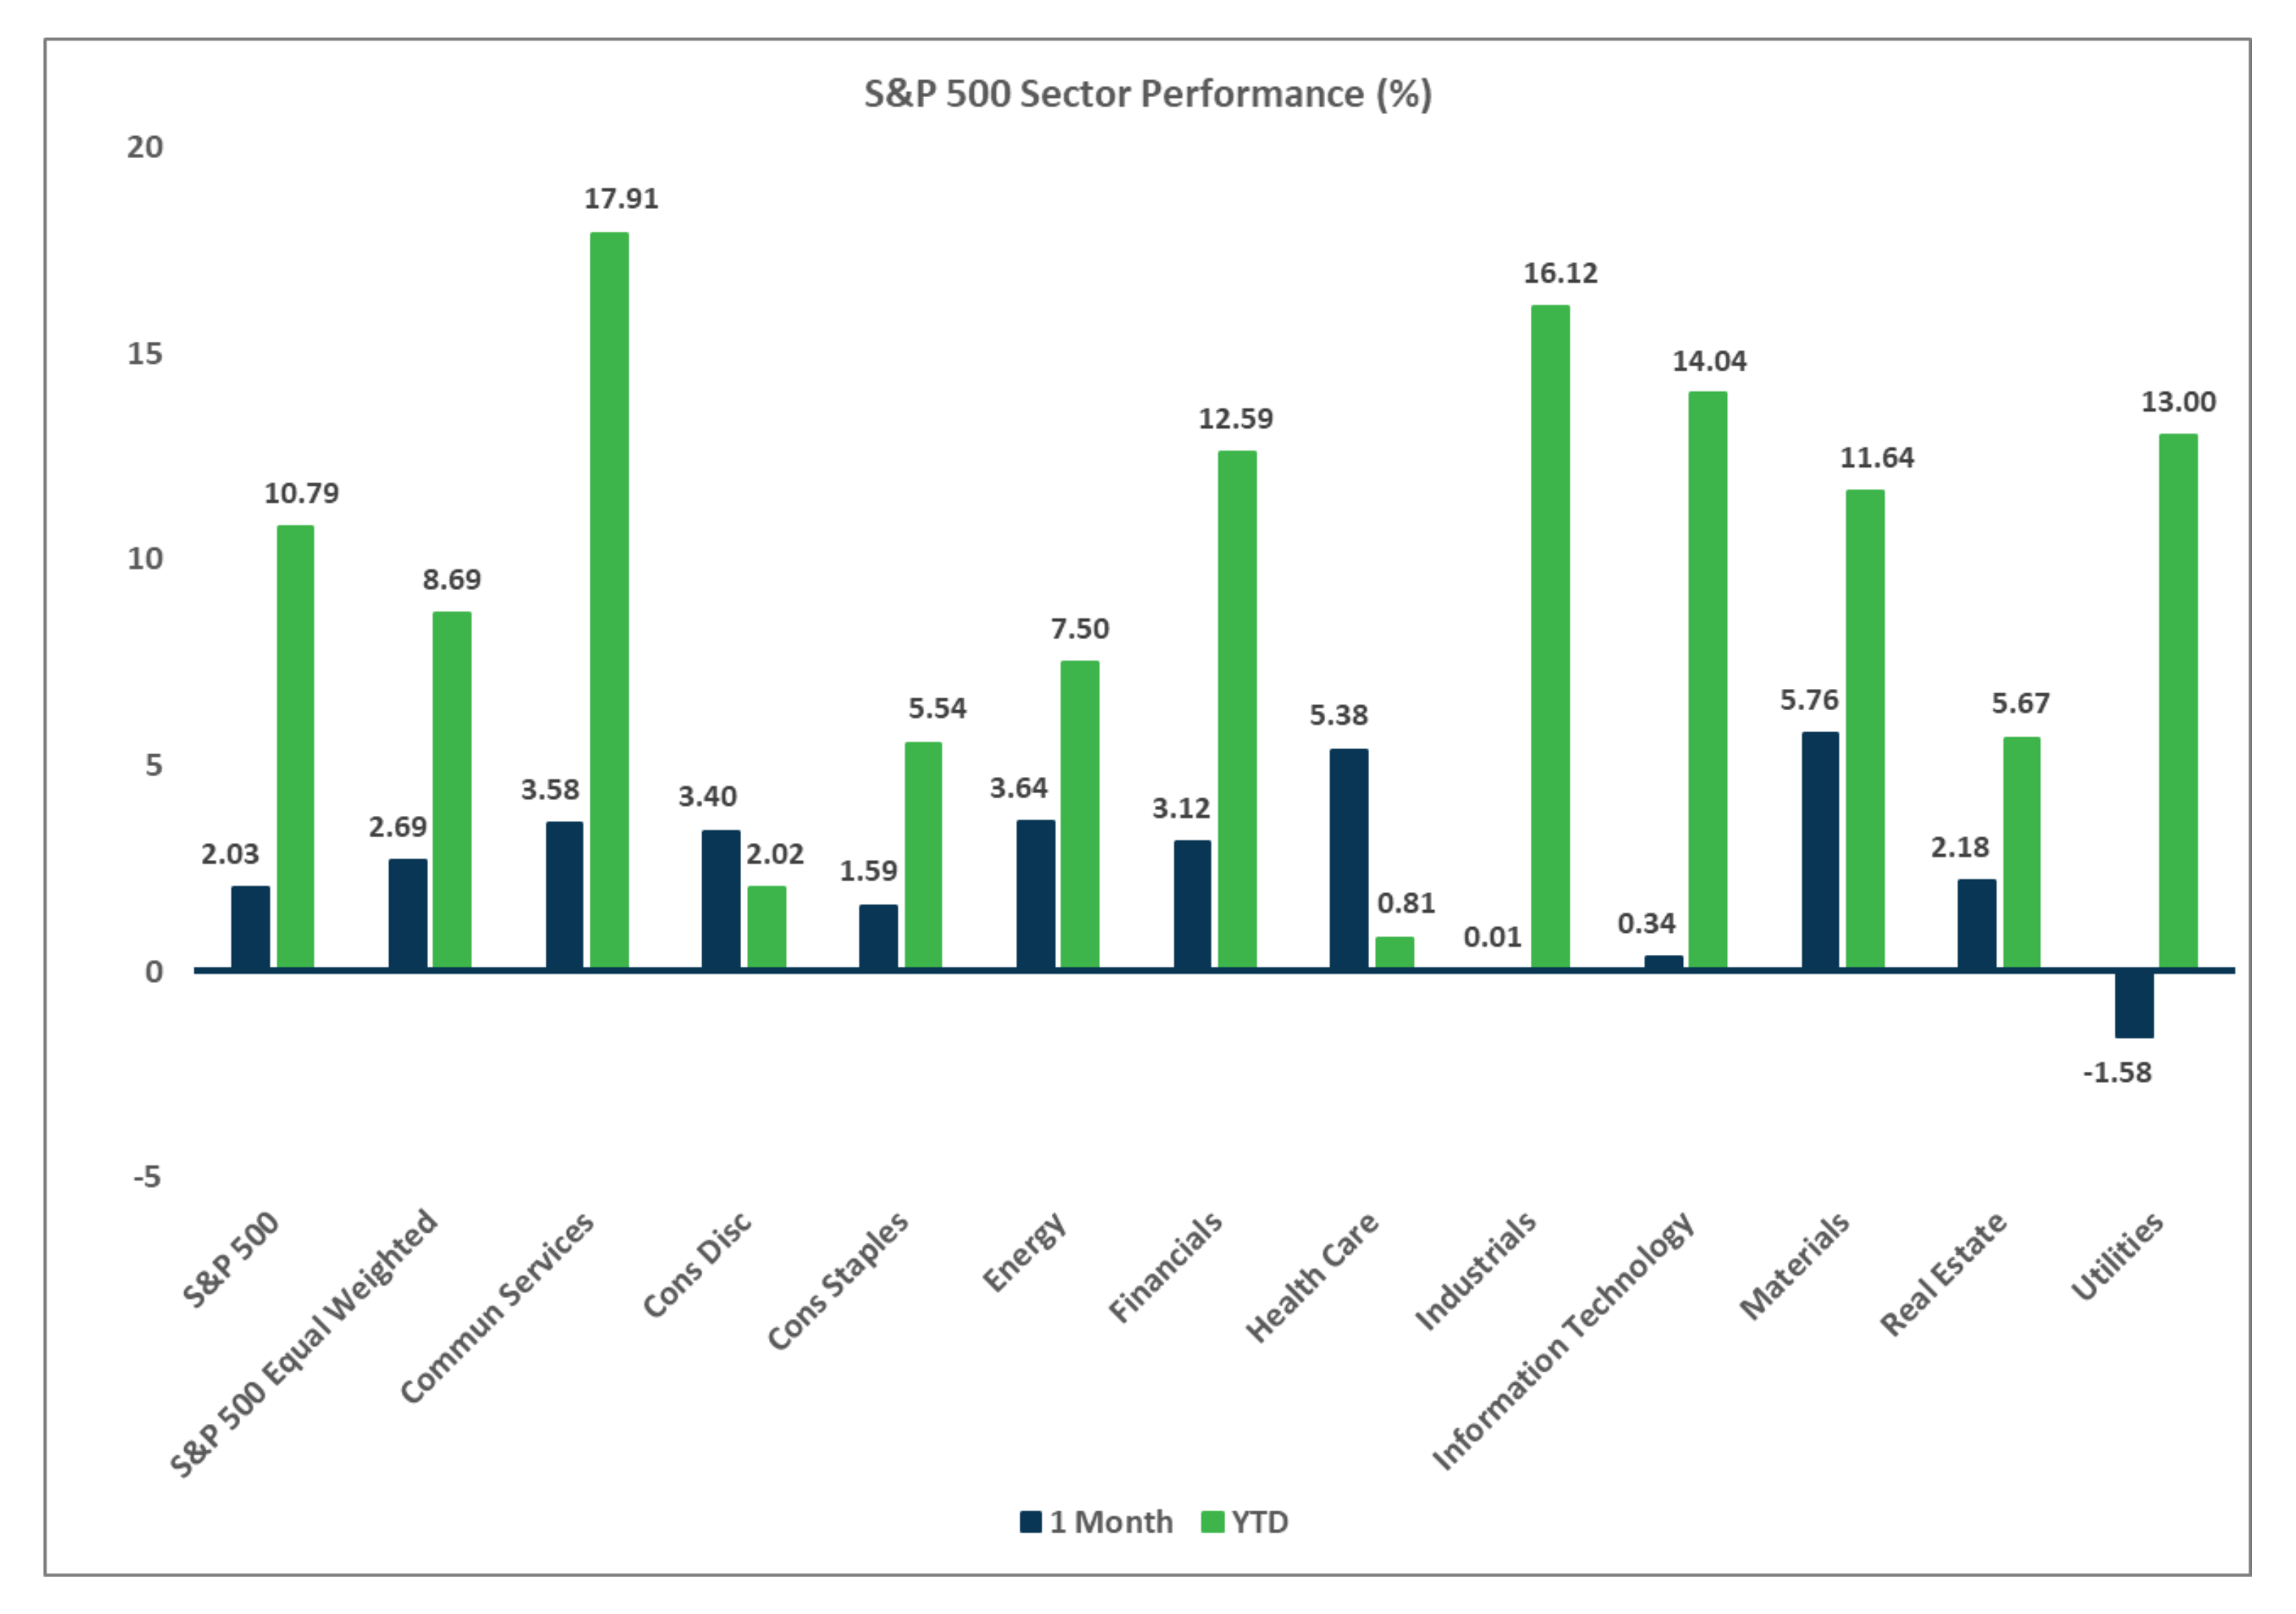
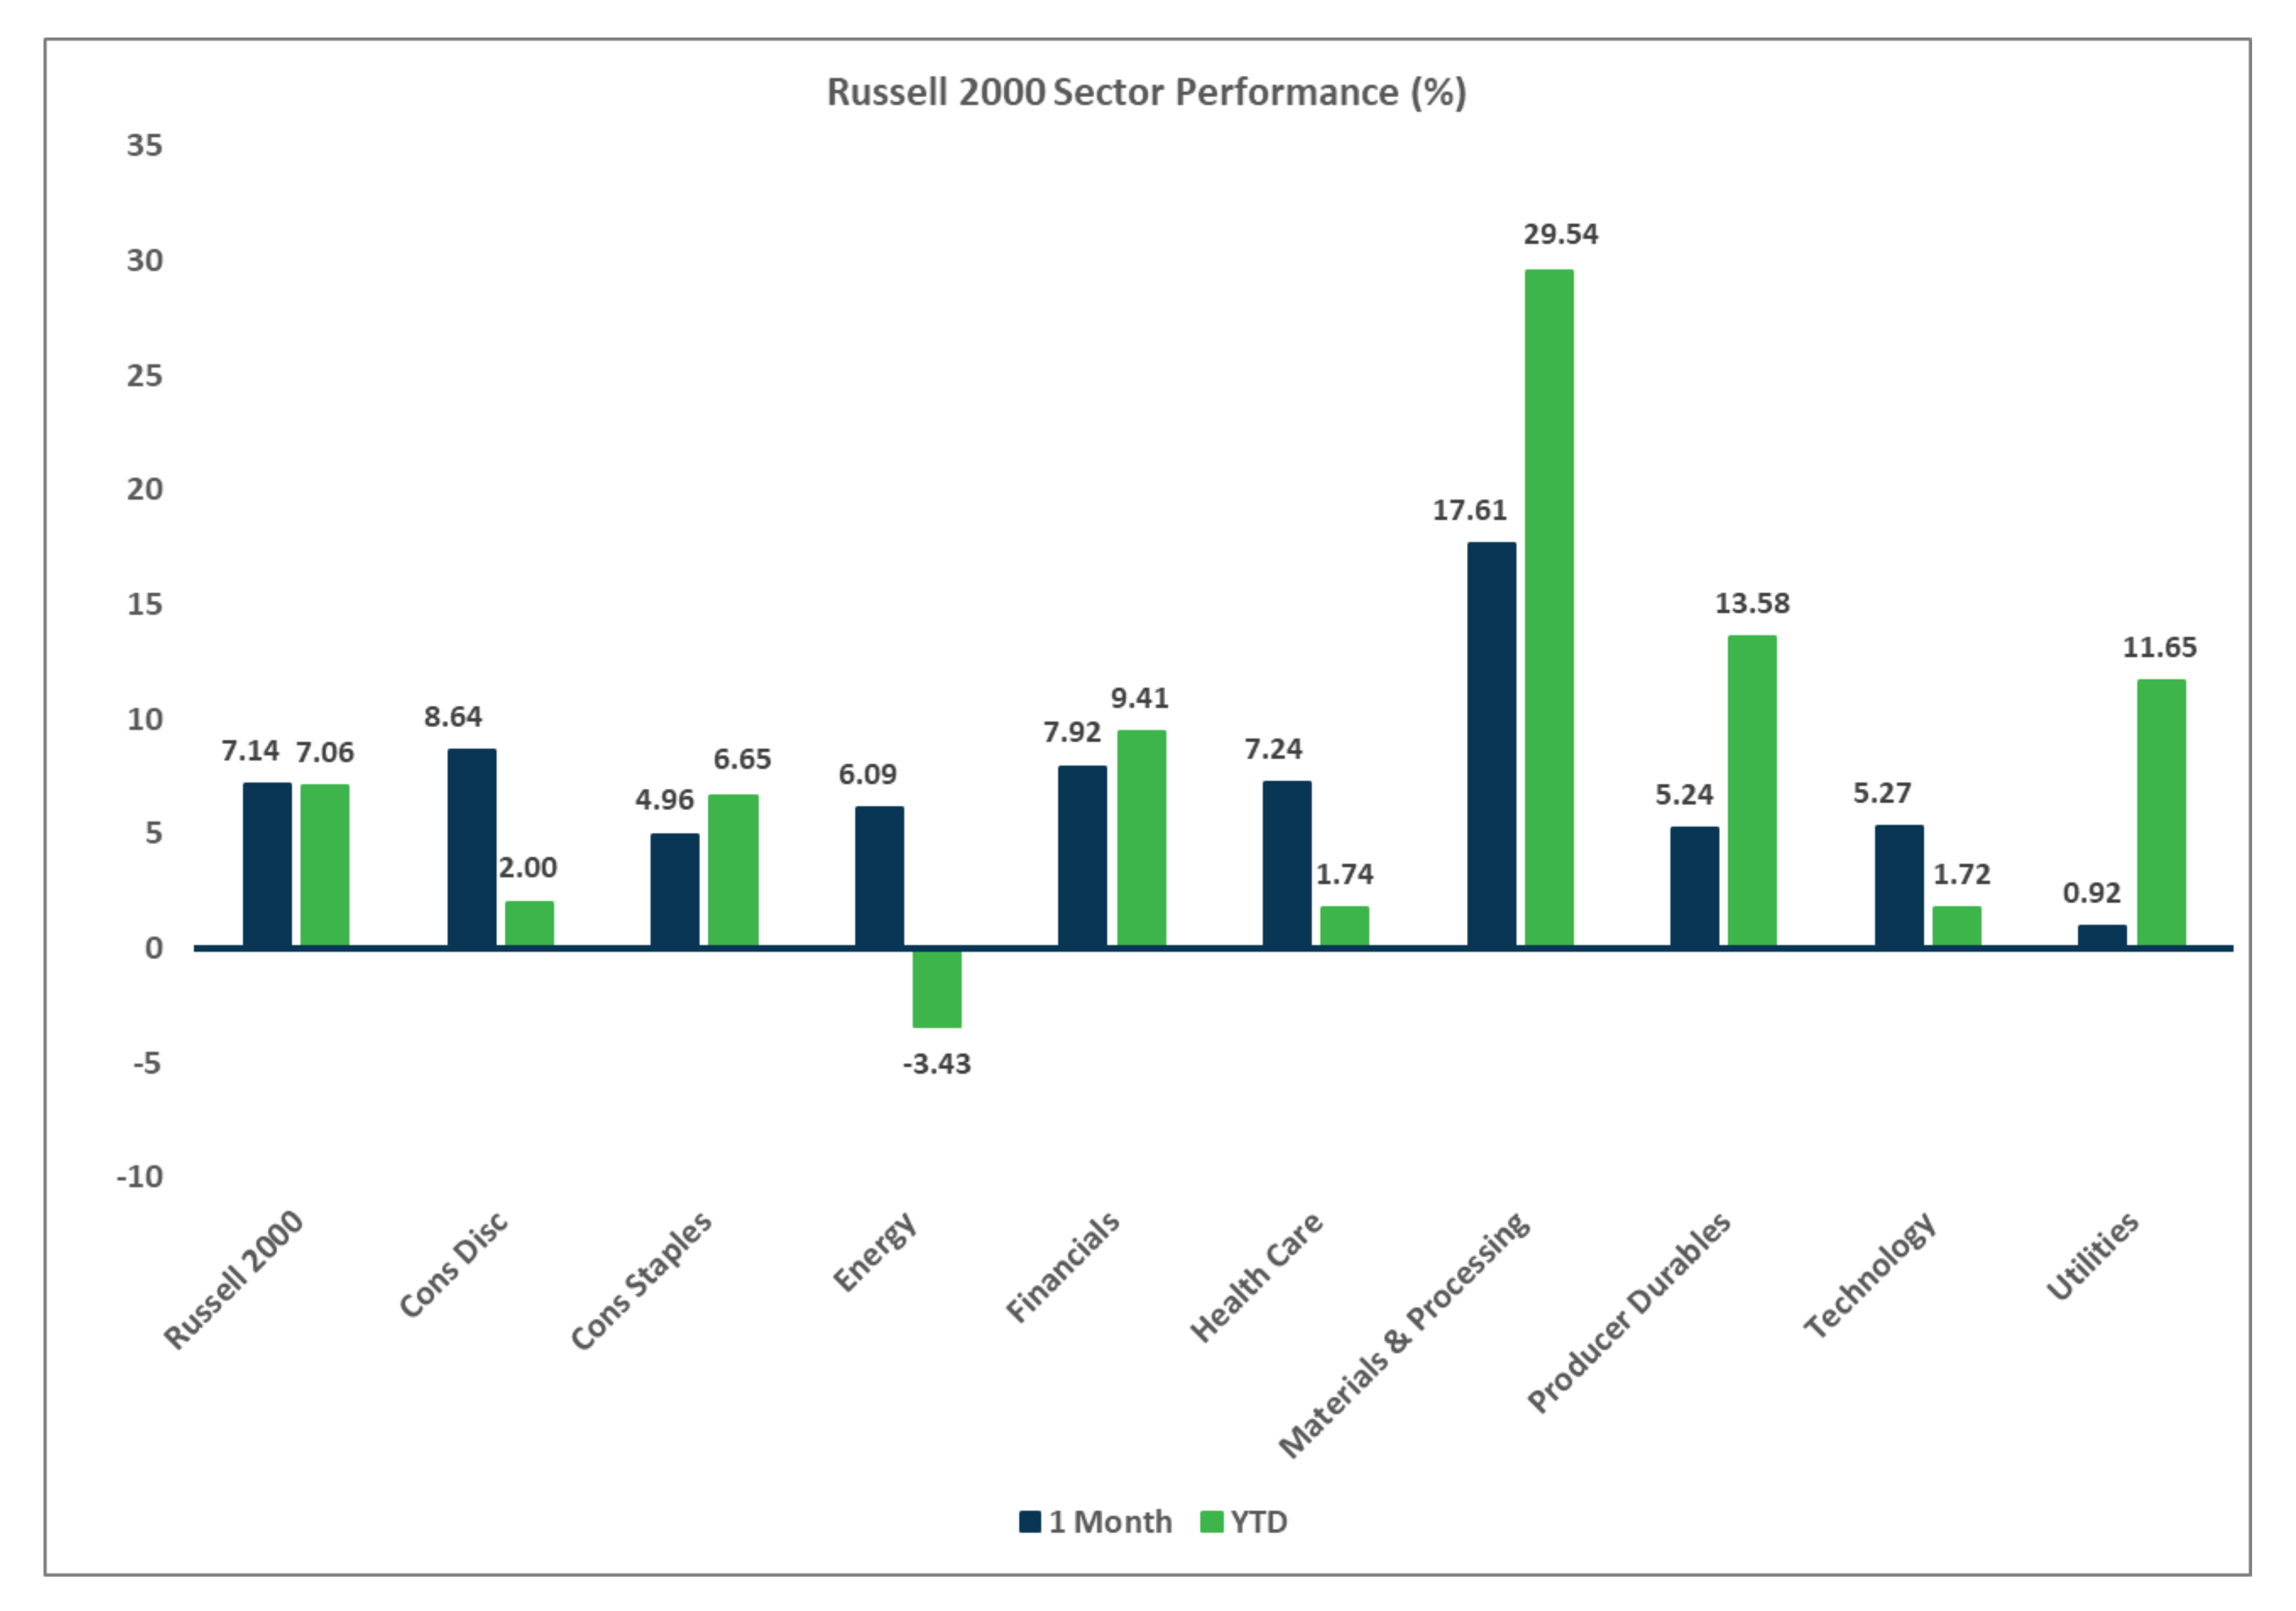
- U.S. equities gained ground in August, led by small caps and value stocks.
- Small caps outperformed large caps by almost 500 bps last month, and value beat growth across all market capitalizations.
- YTD, large caps continue to rule the day, but it has been a fairly solid year for all styles and capitalizations.
Non U.S. Equities
- Stocks outside the U.S. posted solid gains last month, driven by developed markets, the weaker USD and small caps.
- Similar to what occurred in the U.S., small caps beat large caps and value stocks trounced growth stocks.
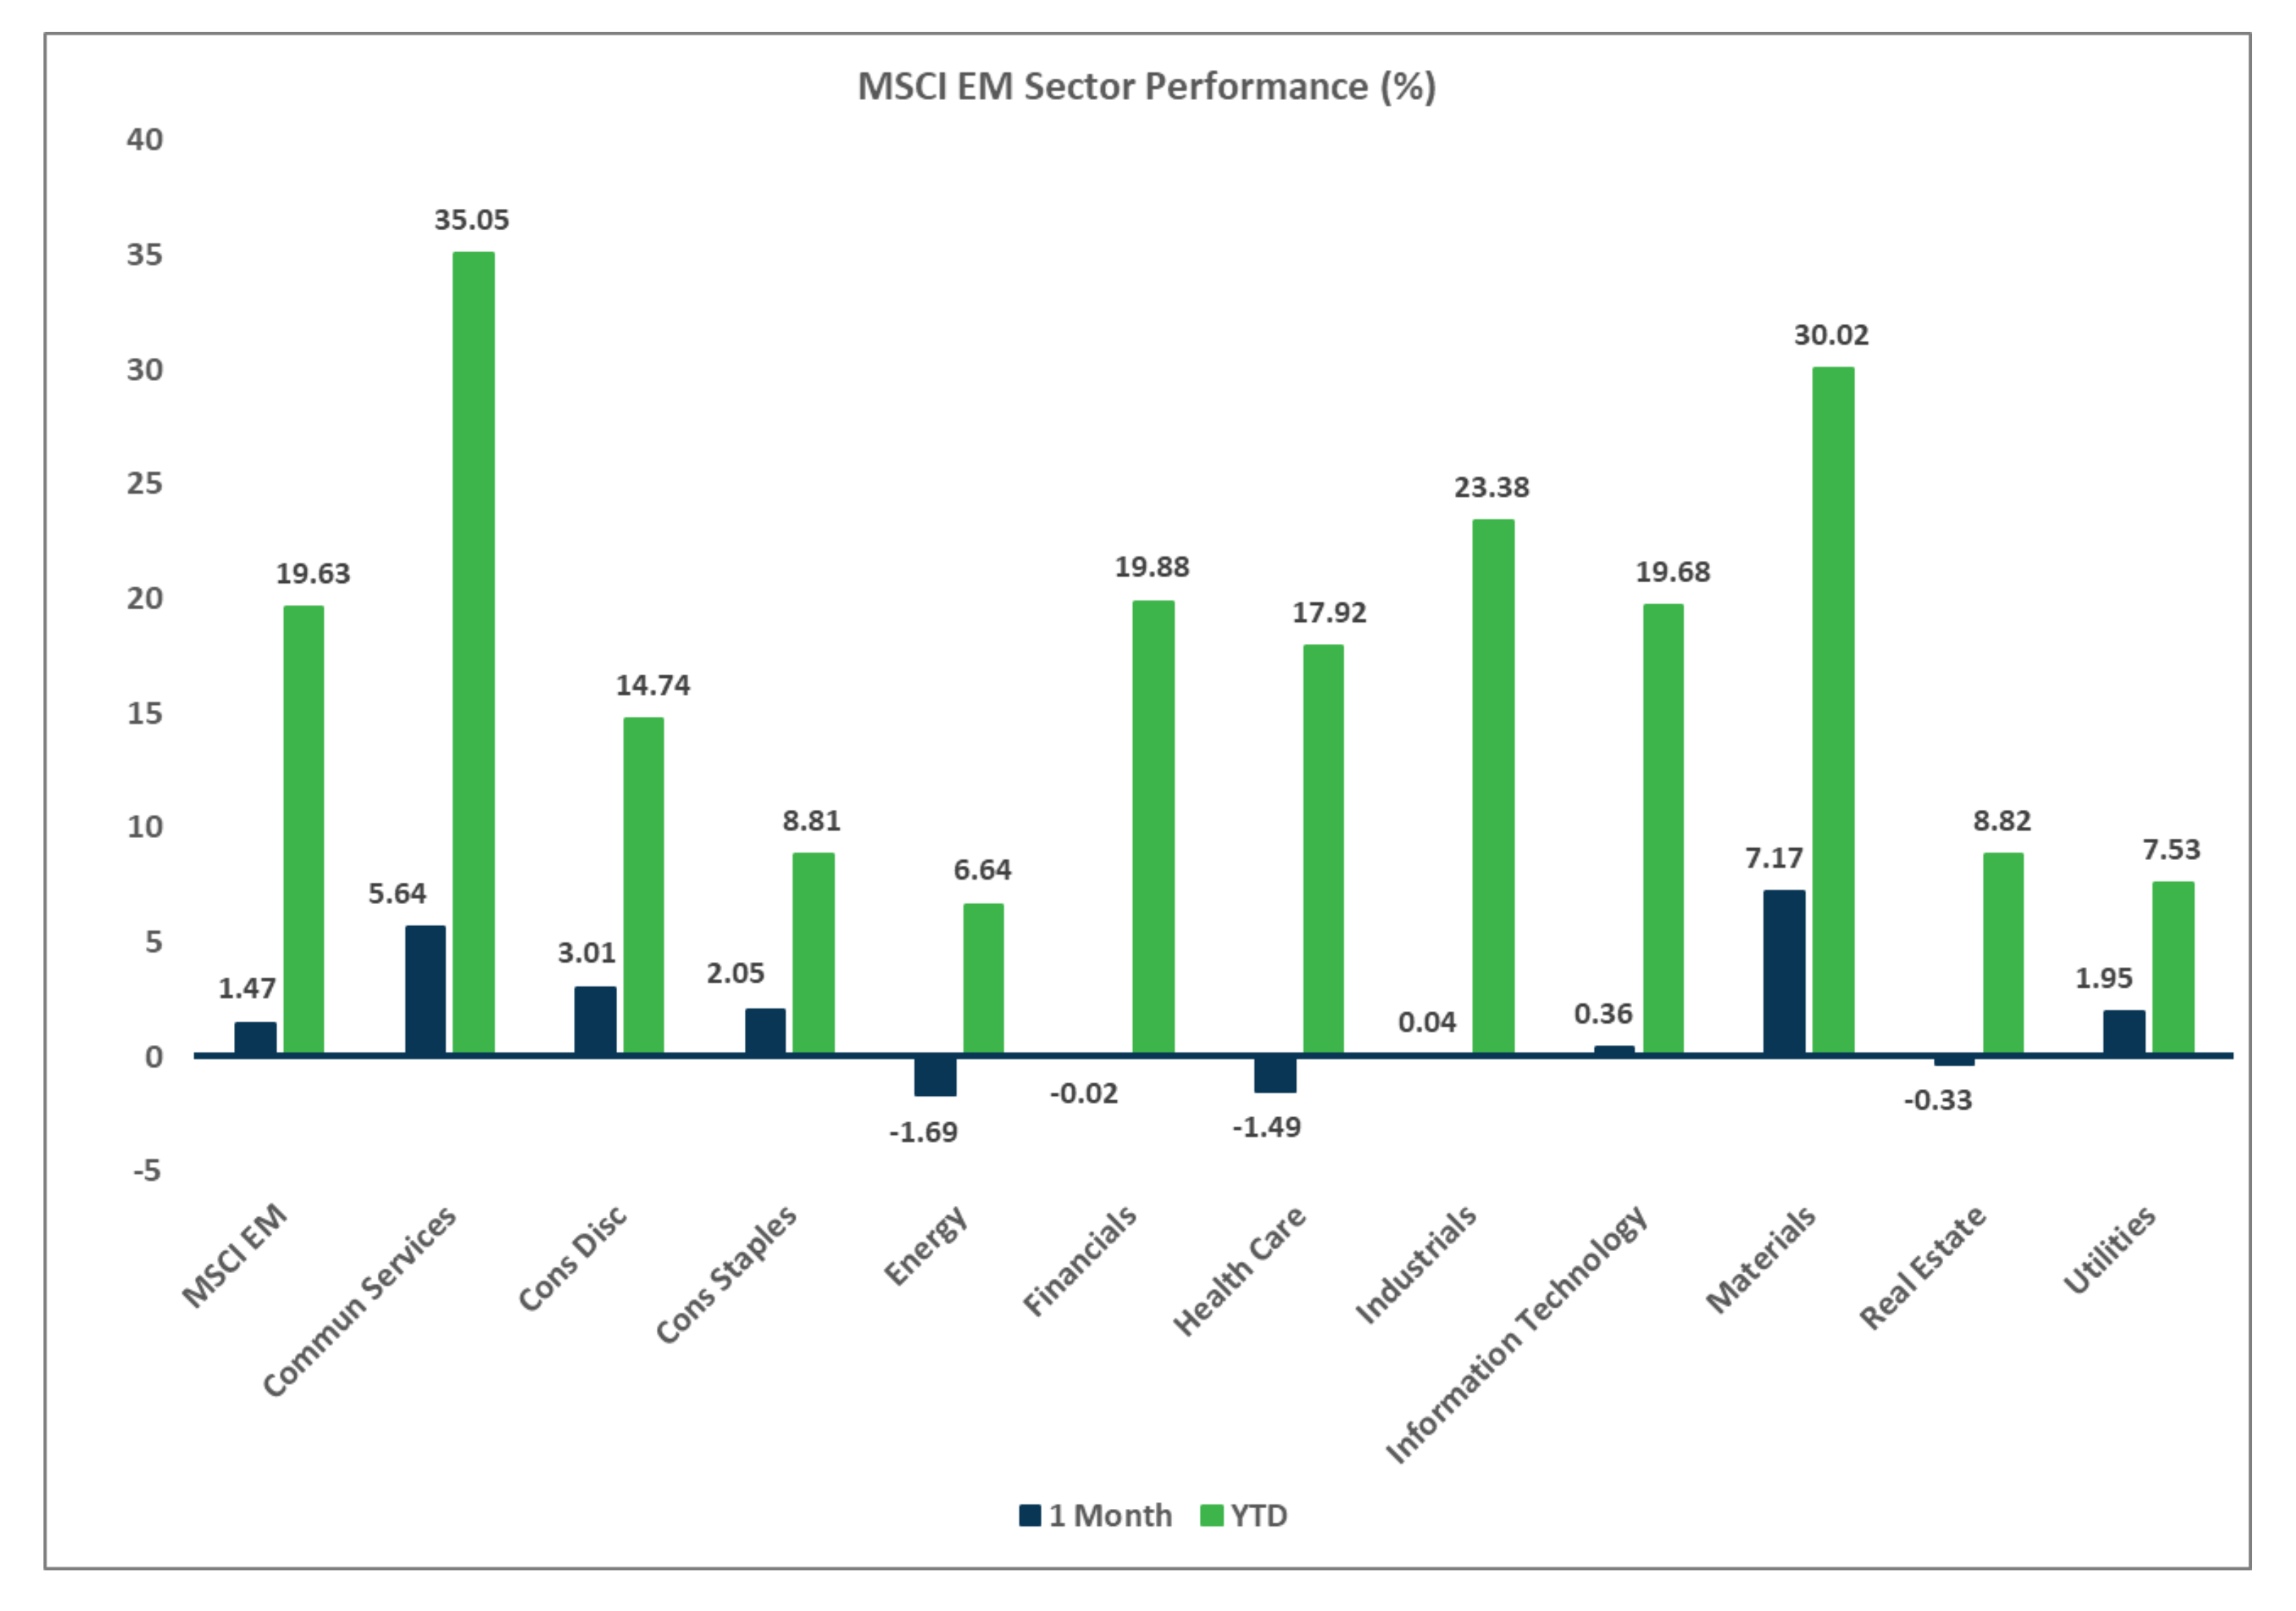
- EMs lagged EAFE markets, largely due to weakness in Europe and Asia ex-China. China and LatAM outperformed.
- USD weakness added 216 bps to EAFE returns and 9 bps to EM returns.
Market Performance (as of 8/31/25)
Sector Performance – Russell 2000 (as of 8/31/25)
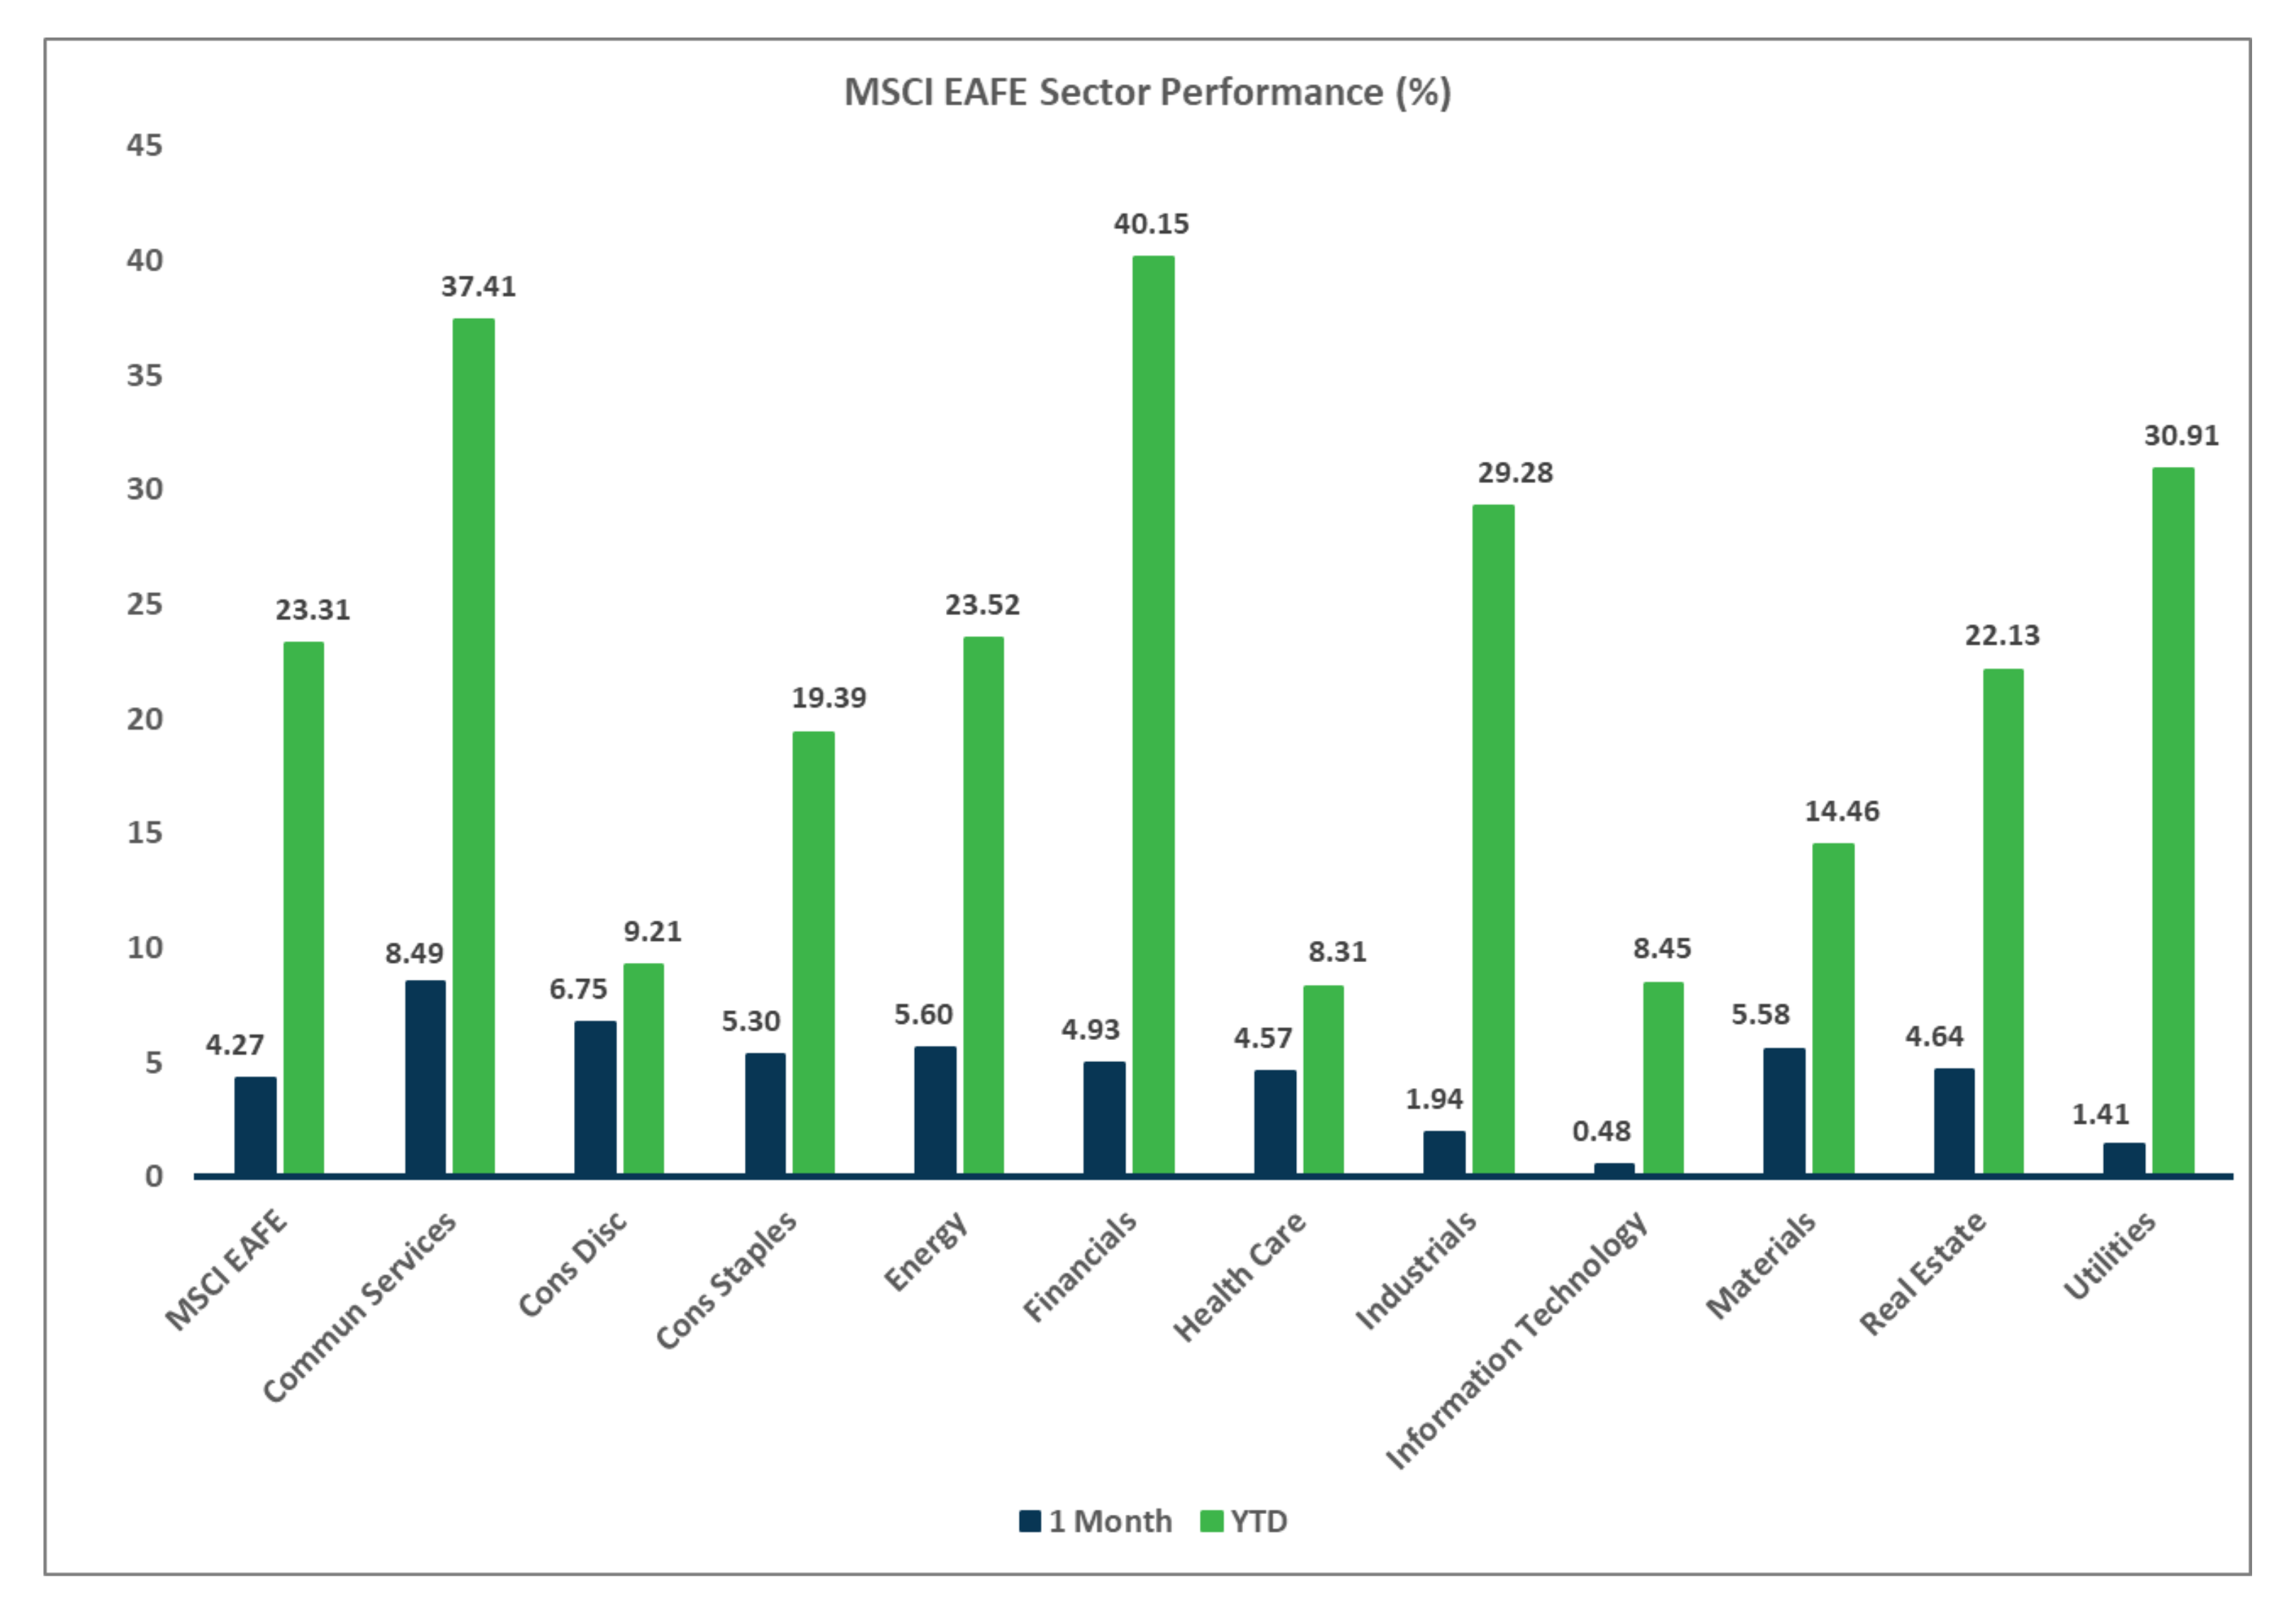
Sector Performance – MSCI EAFE (as of 8/31/25)
Sector Performance – MSCI EM (as of 8/31/25)