Market Flash Report | February 2023

Economic Highlights
United States
- Markets were laser focused on the January CPI report that showed inflation had risen 0.5% M/M or 6.4% Y/Y. Core CPI increased 0.4% and 5.6% over the past year. Rising shelter costs accounted for about half the monthly increase. They rose 0.7% in January while energy jumped 2% and food costs increased 0.5%. “Super core” services inflation, which excludes food, energy and shelter, rose 0.2% M/M and 4% Y/Y. Inflation is trending down, but it remains sticky and this report likely keeps the Federal Reserve in play for a few more months. The Fed raised rates by another 25 bps at its February 1 meeting, but this report has resulted in a backup in Treasury yields and a convergence of market and Fed expectations.
- The January employment report smashed expectations with 517,000 new jobs created and the unemployment rate falling to 3.4%, the lowest level since May 1969. Estimates were for 187,000 new jobs and an unemployment rate of 3.6%. More workers entered the labor force last month with the labor participation rate edging up to 62.4%, and the broader U6 measure of unemployment was 6.6%. Wages also posted solid gains for the month. Average hourly earnings increased 0.3%, in line with the estimate, and 4.4% Y/Y, 0.1% higher than expectations, though a bit below the December gain of 4.6%.
- January’s durable goods orders report was mixed with a headline decline of 4.5%, but a gain of 0.8% when excluding the volatile commercial aircraft sector. Shipments of “core” non-defense capital goods ex-aircraft (a key input for business investment in the calculation of GDP), rose 1.1% in January following declines in the last two months of 2022. While orders are still rising, they are actually shrinking when adjusted for inflation.
- Retail sales jumped 3% in January, smashing expectations. Retail sales have surged 6.4% Y/Y, in-line with the pace of inflation.
Non-U.S. Developed
- Eurozone business activity growth accelerated to a nine-month high in February, reflecting an improved performance of the service sector and a return to growth of manufacturing output. The eurozone flash composite PMI rose from 50.3 in January to 52.3 in February. Eurozone services activity hit an 8-month high of 53.0, eurozone manufacturing output hit a 9-month high of 50.4, but the official eurozone manufacturing PMI fell to a 2-month low of 48.5. Business activity across the eurozone grew much faster than expected in February, thanks to resurgent service sector activity and a recovering manufacturing economy. February’s PMI is broadly consistent with GDP, rising at a quarterly rate of just under 0.3%.
- The Japanese economy advanced 0.6% on an annualized basis during the fourth quarter of 2022, below the market consensus of 2% growth and after a revised 1.0% contraction in the previous period. Private consumption increased 0.5% with the removal of some COVID-19 restrictions and government spending surged at a faster pace in Q4 than the previous quarter. On the negative end was a contraction (-0.5%) in business spending for the first time in three quarters. Like nearly everywhere else across the globe, rising inflation has been a growing issue in Japan. Private consumption did rebound in Q4, but the outlook will be key for how the BOJ implements potential future monetary policy changes.
Emerging Markets
- China’s manufacturing sector hit its highest level of activity since April 2012. The official manufacturing PMI rose to 52.6 in February from 50.1 reported in January. China’s non-manufacturing PMI also grew further in February to 56.3 from January’s print of 54.4, when it saw a sharp improvement backed by a recovery in services and construction activity. The broad-based improvements for both manufacturing and non-manufacturing PMIs in February reflect the solid momentum of post-reopening recovery.
- Although Moody’s expects GDP growth in China to decline over the medium-term, it did raise its growth outlook for 2023 and 2024 from 4% to 5%. It expects support from domestic consumption to fuel the better-than-expected economic growth.
- India’s Q4 GDP report showed growth of 4.4%, below the 5.2% reading from Q4 2021. Manufacturing and service sector data remain solid across the country and the government still maintains its 7% GDP growth estimate for its fiscal year ending March 31, 2023.
Market Performance (as of 02/28/23)
Fixed Income
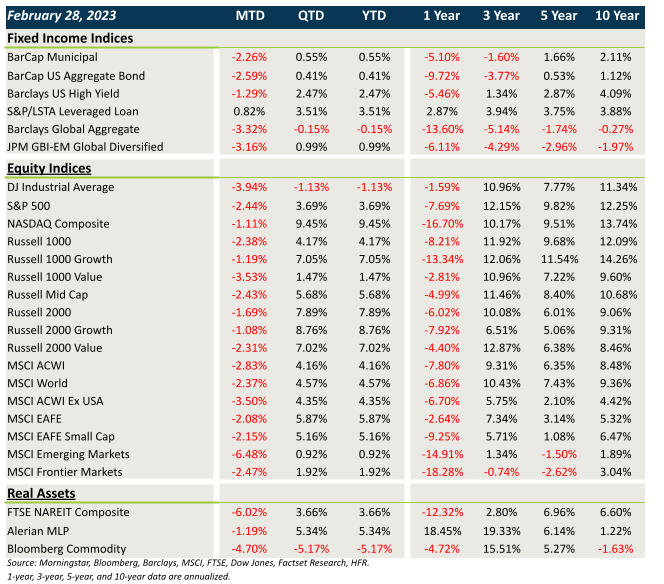
- After collapsing in January, yields moved higher in February on the back of hotter inflation data.
- Core fixed income and municipal bonds lost ground in February.
- Credit showed some resilience last month with modest losses in IG/HY and small gains in floating rate loans.
- Bonds outside the U.S. were hit hard by the combination of rising rates and a rebound in the U.S. dollar.
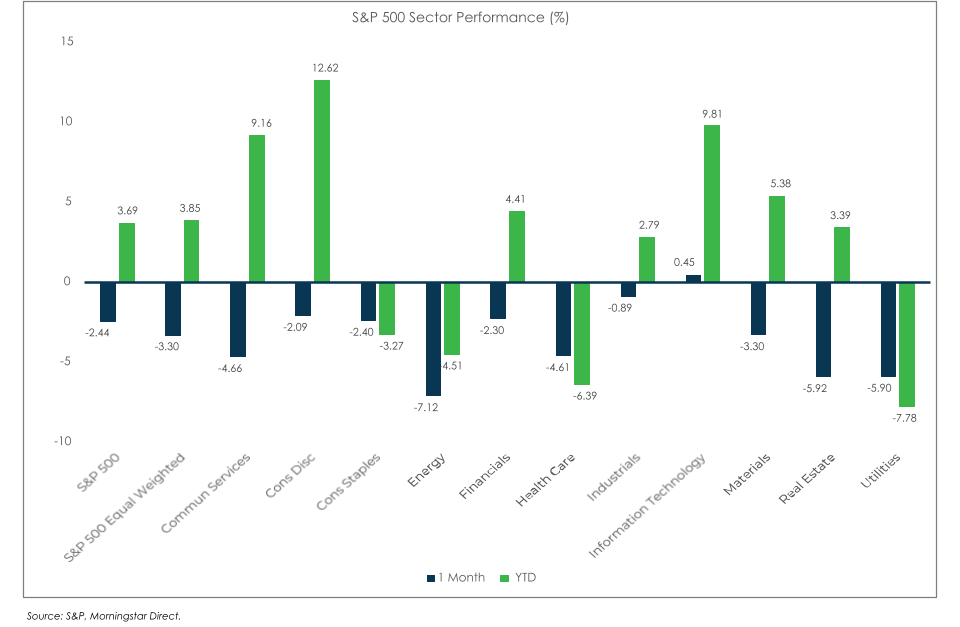
U.S. Equities
- U.S. equities fell across the board in February led by weakness in value.
- Across the market cap spectrum, growth beat value for the second consecutive month.
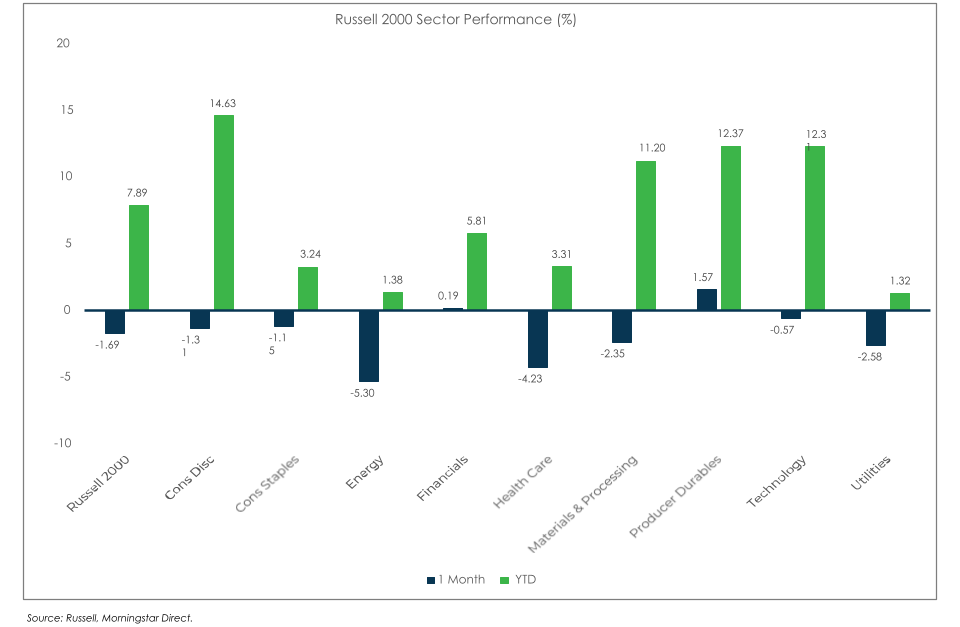
- Small caps provided relative outperformance compared to large caps.
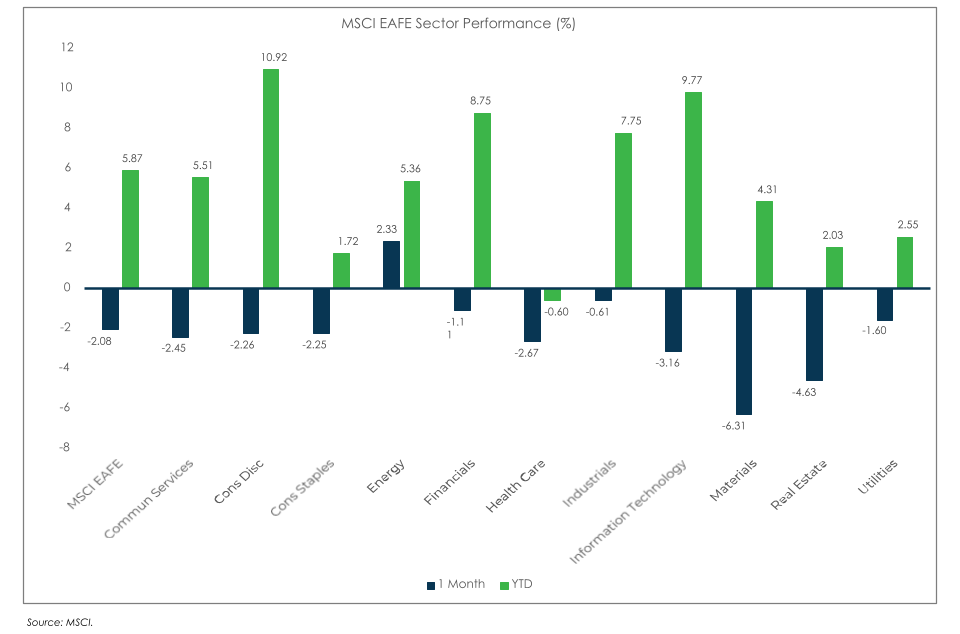
Non-U.S. Equities
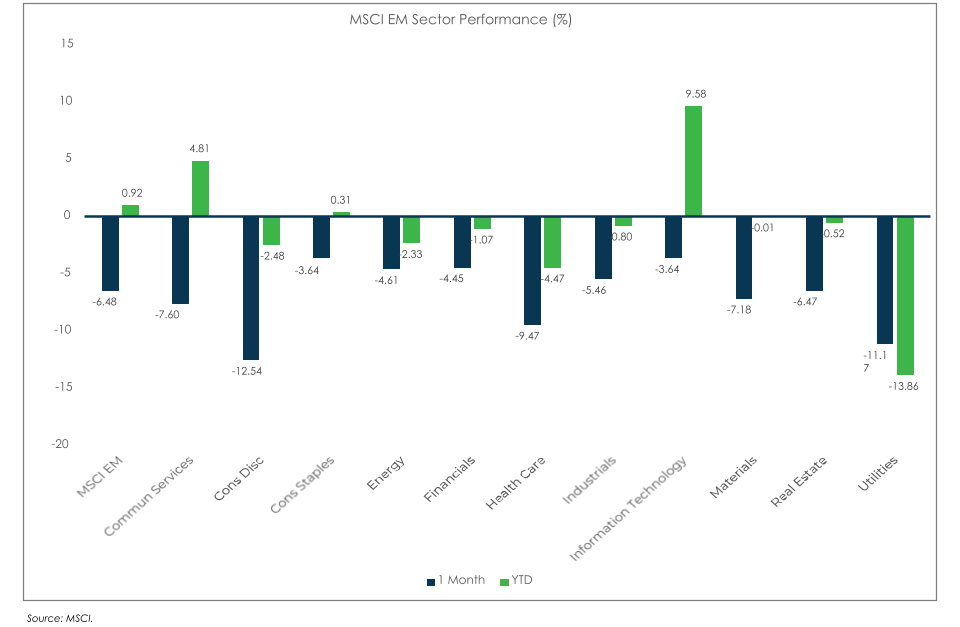
- Non-U.S. equities exhibited weakness last month, with significant losses in emerging markets.
- Unlike what occurred in the U.S., growth lagged value and small caps trailed large caps.
- EMs fell over 6 % led by losses in Asia/China and Latin America.
- The strong USD cost investors 271 bps in the EAFE Index and 183 bps in the EM Index.
S&P 500 (as of February 28, 2023)
Russell 2000 (as of February 28, 2023)
MSCI EAFE (as of February 28, 2023)
MSCI EM (as of February 28, 2023)