Market Flash Report | July 2023

Economic Highlights
United States
- The U.S. economy grew at a faster-than-expected clip in Q2 as GDP increased 2.4% Y/Y, well ahead of the 2% estimate and reading from Q1. Consumer spending rose 1.6% last quarter which was better than expected, but below the 4.2% increase in Q1. Gross private domestic investment increased by 5.7% and government spending increased 2.6%. Business investment was one of the major highlights in the report, rebounding from Q1. Perhaps as important, inflation was held in check during Q2. The PCE price index increased 2.6%, down from a 4.1% rise in Q1.
- Durable goods orders shot up by 4.7% in June after surging by an upwardly revised 2.0% in the prior month. Growth was led by a surge in transportation equipment orders, which jumped 12.1%. Excluding the spike in orders for volatile transportation equipment, durable goods orders rose by 0.6% in June, after climbing by 0.7% in May.
- Inflation fell to its lowest annual rate in more than two years during June, the product both of some deceleration in costs and easy comps against a time when price increases were running at a more than 40-year high. Headline CPI rose 0.2% M/M or 3% Y/Y in June, down from a 4% annualized rate in the prior month. Core CPI, which excludes volatile food and energy, rose 0.2% M/M or 4.8% Y/Y (down from 5.3%). Most of the increase in June inflation came from the lagging shelter component that rose 0.4% M/M or 7.8% Y/Y.
- In July, the Federal Reserve raised rates for the 11th time to the highest level in 22 years (5.25% - 5.50%). Markets are no longer pricing in any additional rate hikes for this year, and the storyline has shifted a bit from future rate cuts to how long the Fed will hold rates steady. Economic growth/activity remains resilient and better than expected, and that may lead the Fed to maintain current policy levels. We believe every meeting is live and any economic weakness will bring monetary easing back into the forefront.
Non-U.S. Developed
- After nearly posting consecutive negative quarters of growth, the eurozone finally posted positive GDP growth in Q2. The eurozone economy grew 0.3% Q/Q in Q2, slightly ahead of expectations. Almost all of the growth came from France (+0.5%) and Ireland (+3.3%). Q2 GDP growth would have been flat if excluding France and Ireland. Most of the other countries in the economic block posted disappointing growth readings. With the eurozone composite PMI hitting an 8-month low in July and the manufacturing PMI hitting a 38-month low, risk to the economy is to the downside, with a recession likely.
- Headline inflation in the eurozone was 5.3% in July, lower than the 5.5% registered in June. Core inflation remained steady at 5.5% in July, with food, alcohol and tobacco once again driving increases (prices rose by 10.8%). To combat sticky inflation, the European Central Bank has raised rates over the past year to the current level of 3.75%.
- The International Monetary Fund indicated that the Bank of Japan should start preparing for future monetary policy tightening by moving away from its yield control policy. Right now, the BOJ has a Yield Curve Control (YCC) policy in place that caps the 10-year bond yield around 0% with a ceiling of 0.5%. Experts believe Japan needs to implement a more flexible policy that potentially moves away from the YCC policy. Although inflation has crept up this year above the BOJ’s 2% target, the country has struggled for decades with achieving a sustained level of growth and inflation.
Emerging Markets
- China’s economy grew 6.3% Y/Y in Q2, below expectations but higher than Q1’s 4.5% reading. The Q2 data showed a clear slowdown in consumer spending and faltering business confidence, reinforcing the idea that growth has lost steam. China continues to face significant headwinds, such as consumers who are wary of spending, businesses that are hesitant to hire and invest, a property market dealing with its worst downturn on record, and a weak global economy that is stifling external demand. The People’s Bank of China may need to consider additional stimulus measures beyond interest rate cuts and tax breaks.
- China’s factory activity contracted for a fourth consecutive month in July, while non-manufacturing activity slowed to its weakest this year, as the world’s second-largest economy struggles to revive growth momentum in the wake of soft global demand. The official manufacturing PMI came in at 49.3 in July, compared with 49.0 in June, 48.8 in May and 49.2 in April. Although China’s manufacturing PMI rebounded to 49.3 this month, some enterprises reported that the current external environment is severe, overseas orders have decreased, and insufficient demand is still the main difficulty facing enterprises.
- China posted its weakest official non-manufacturing PMI reading this year, coming in at 51.5 in July, compared with 53.2 in June, 54.5 in May and 56.4 in April. Employment sub-indexes for both manufacturing and non-manufacturing sectors declined in July, pointing to lingering softness in youth unemployment.
- The China COVID-19 reopening story has been disappointing this year and the government has been forced to step up stimulus to boost economic growth. Policy support measures have been somewhat restrained so far and any impact to economic growth is likely to only be modest.
Market Performance (as of 07/31/23)
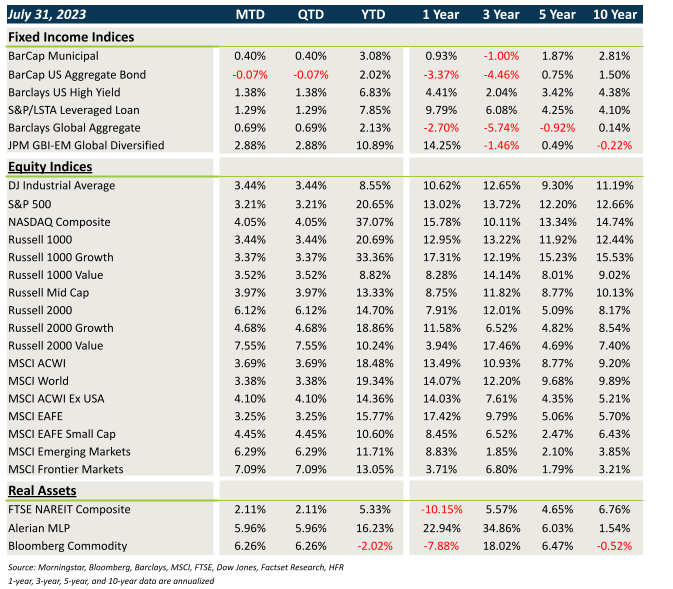
Fixed Income
- Treasury and sovereign debt yields moved higher in July, leading to losses in core fixed income. Munis bucked the trend, fueled by strong technicals.
- Credit spreads tightened in July, leading to gains in HY, loans and EMD.
- Bonds outside the U.S. faced the headwind of higher rates, but benefited from the sharp decline in the U.S. dollar.
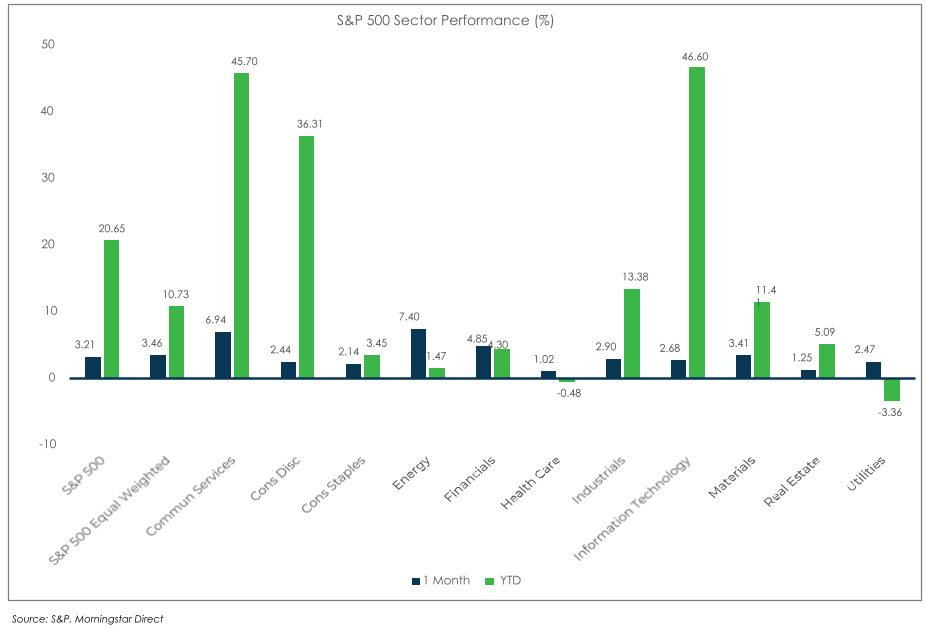
U.S. Equities
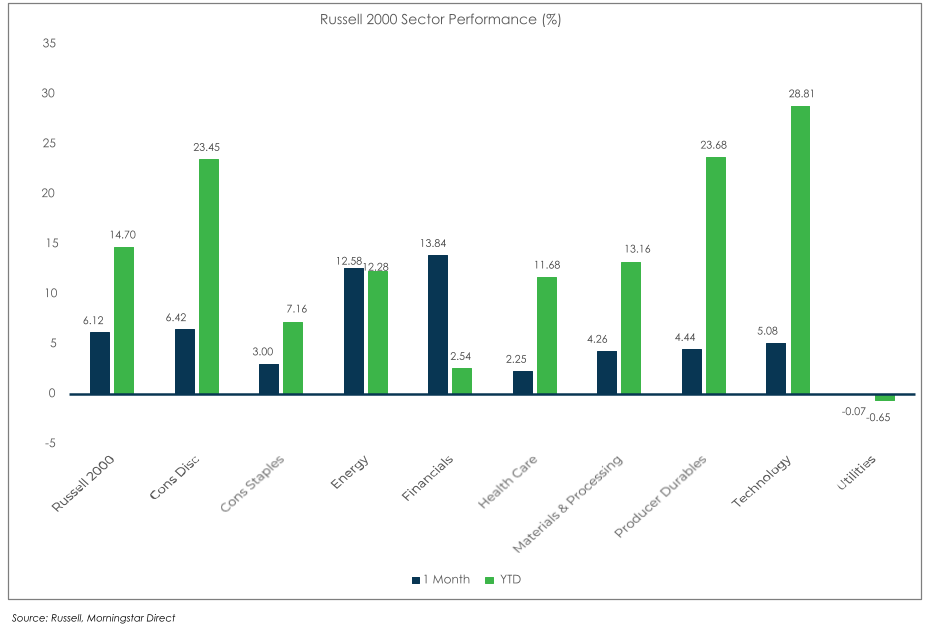
- U.S. equities posted strong gains last month led by small caps.
- Small caps beat large caps by a wide margin in July.
- Value and growth performed roughly in line with each other across large caps last month, but value led growth sharply across small caps.
- The Nasdaq leads the way YTD with a 37%+ gain.
Non-U.S. Equities
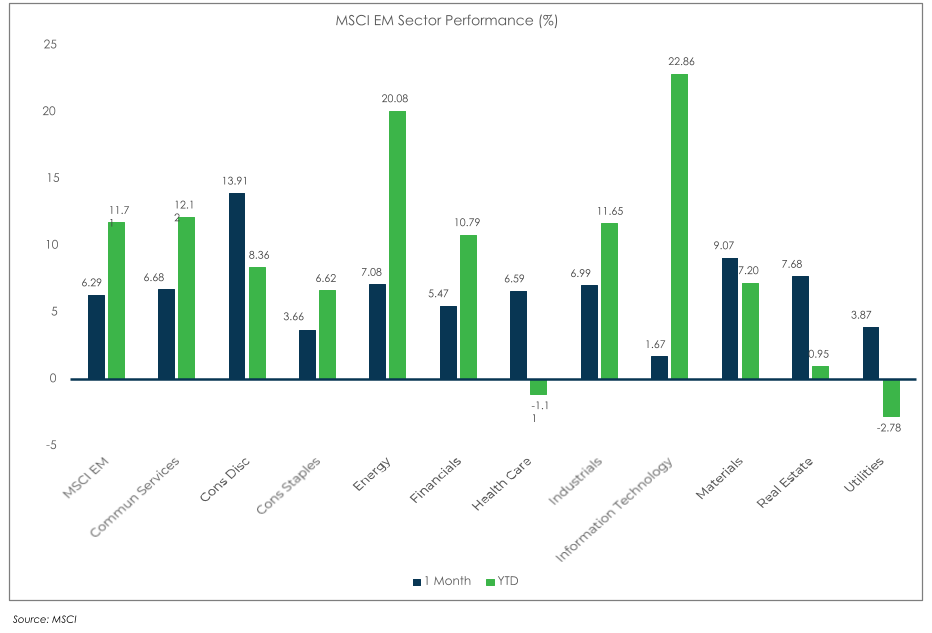
- Non-U.S. equities posted solid gains in July led by the rebound in China and EMs.
- Value outperformed growth outside the U.S. and small caps beat large caps.
- Within EMs, all major regions participated in the rally, with the best performance coming from Asia and Eastern Europe.
- EAFE markets lagged on a local basis, but the weaker USD provided a big boost.
S&P 500 (as of July 31, 2023)
Russell 2000 (as of July 31, 2023)
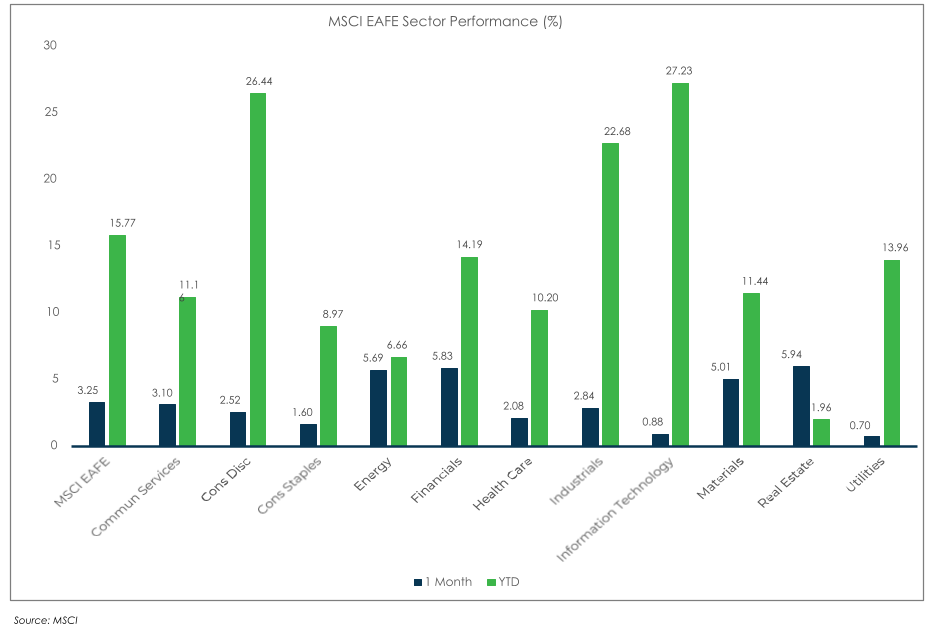
MSCI EAFE (as of July 31, 2023)
MSCI EM (as of July 31, 2023)