Market Flash Report | June 2023

Economic Highlights
United States
- Inflation pressures eased slightly in May as consumer spending also showed signs of slowing. The personal consumption expenditures (PCE) price index, a number closely watched by the Federal Reserve, increased 0.3% for the month when excluding food and energy, in-line with economist expectations. Core PCE increased 4.6% Y/Y, or slightly below estimates. When including the volatile food and energy components, inflation was considerably softer — up just 0.1% on the month and 3.8% from a year ago. There were also signs of slowing in shelter prices, which have been a big driver of inflation since the start of the pandemic.
- Although inflation is trending lower and heading in the right direction, it is still well above the Fed’s 2% longer-term target. Fed Chairman Jerome Powell indicated in recent testimony that the 2% level isn’t likely to be achieved for a few years. At its June meeting, Fed officials indicated they expect at least two more quarter-point interest rate hikes before the end of the year. Even Atlanta Fed President Raphael Bostic, who is not in favor of further increases, said Thursday that he doesn’t see any cuts coming either this year or in 2024. The Fed Fund Futures project a 90% probability of a 25 bps rate hike at the July meeting.
- The U.S. economy showed much stronger-than-expected growth in Q1 than previously thought, based on a big upward revision by the commerce department. GDP grew 2%, well ahead of the 1.3% previous reading. Consumer spending, as gauged by personal consumption expenditures, rose 4.2%, the highest quarterly pace since the second quarter of 2021. At the same time, exports rose 7.8% after falling 3.7% in the fourth quarter of 2022. The U.S. economy remains very resilient and the odds of recession are receding.
Non-U.S. Developed
- Eurozone business output growth came close to stalling in June, according to the latest HCOB flash PMI survey data produced by S&P Global, pointing to renewed weakness in the economy after the brief growth revival recorded in the spring. Inflows of new orders fell for the first time since January, employment growth slowed and future output expectations also deteriorated. More encouragingly, the slowdown was accompanied by a marked cooling of inflationary pressures.
- Eurozone inflation hit 5.5% in June, below analyst expectations, but core inflation, which excludes energy and food, remains stubbornly high, rising 5.4% Y/Y. Core inflation came in at an annualized rate of 5.3%, down from 5.6% in the previous month. Falling energy prices were a significant contributor to the decline in inflation.
- The Japanese economy grew at a faster-than-expected pace in Q1 due largely to robust spending by consumers and businesses. Japan’s GDP rose 2.7% Y/Y, well ahead of the initial 1.6% estimate. Private non-residential investment, or capital spending, rose 1.4%, higher than initial government estimates of 0.9%. Private demand rose by 1.2% and domestic demand rose by 1%, while exports of goods and services dropped 4.2%. Imports also fell 2.3%, revised government data showed.
- The annual inflation rate in Japan unexpectedly declined to 3.2% in May 2023 from April's 3-month high of 3.5%. Core inflation also dropped to 3.2% in May from a 3-month peak of 3.4% in April. Inflation has been above the Bank of Japan's 2% target for 14 consecutive months.
Emerging Markets
- Economic data in China point to a growth picture that appears to be stalling after the COVID-19 reopening. China’s National Bureau of Statistics official manufacturing PMI came in at 49.0 in June, up slightly from 48.8 in May, but still below the important 50.0 level that separates contraction from expansion. The smaller-company focused Caixin/S&P Global Manufacturing PMI slipped to 50.5 in June from 50.9 in May. China’s economy has yet to find its footing based on the lack of internal growth drivers, weak internal and external demand, and deteriorating levels of consumer and business confidence.
- The official China non-manufacturing PMI, an important reading of sentiment in the services and construction sectors, fell to 53.2 in June from 54.5 in May. The sub-index for services activity also fell to a six-month low, reaching 52.8 in June. The services sector is crucial to China’s economy as it accounts for 58% of GDP and 48% of employment. In March, the non-manufacturing PMI had surged to its highest level in nearly 12 years, boosted by a resurgence in consumer activity as the country emerged from three years of COVID-19 lockdowns. Clearly, momentum has slowed in recent months with the main engine of growth in country sputtering.
- According to recent data released, new home sales have plummeted in China. The year-over-year rate for new home sales for the 30 largest sales leaders in China has neared new cyclical lows of -26%. The rate for non-SOE companies is even worse at -52%. Any new policy initiative from the government should be viewed as a shoring up exercise for the real estate sector, as opposed to hope for a major new property expansion cycle.
Market Performance (as of 06/30/23)
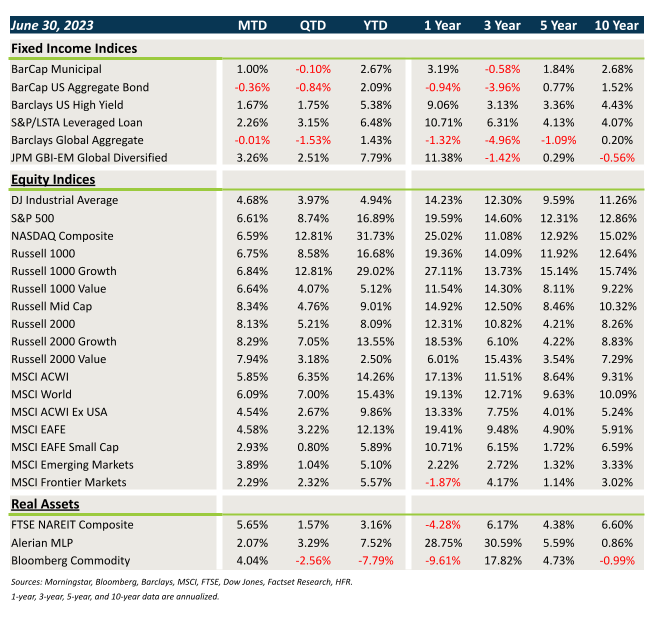
Fixed Income
- Yields moved higher in June, leading to modest losses in core fixed income. Munis bucked the trend, fueled by a rebound in technicals.
- Spreads tightened rather significantly last month and this generated strong gains for high-yield, floating rate loans and EMD.
- Bonds outside the U.S. posted mixed results, with USD weakness being offset by the move higher in interest rates.
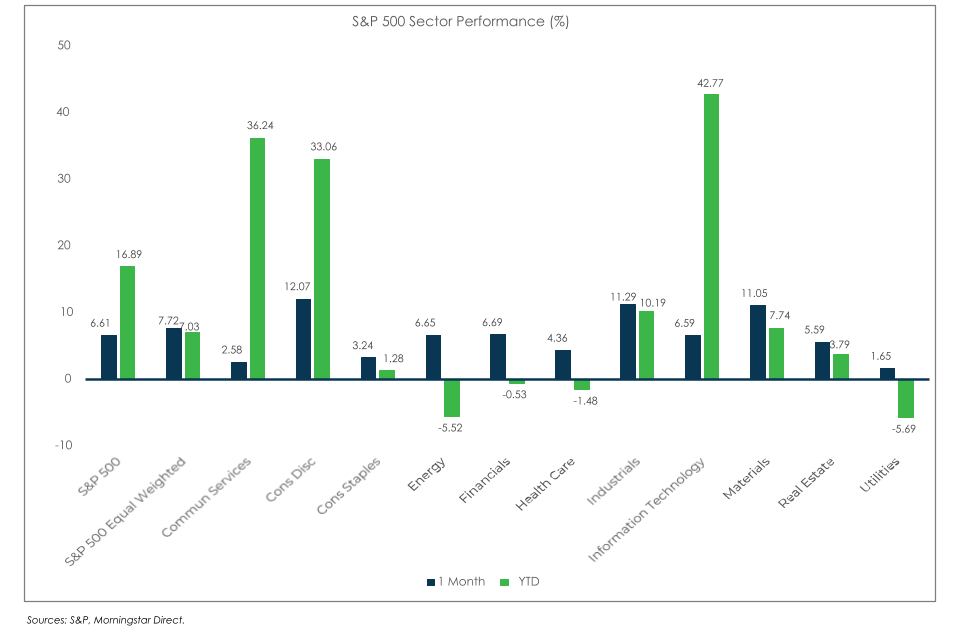
U.S. Equities
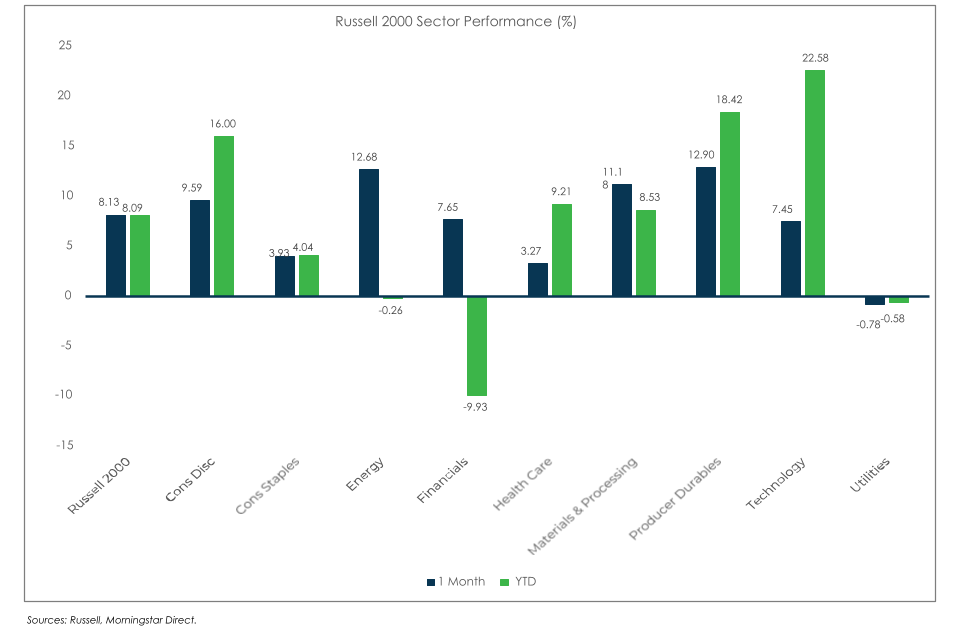
- U.S equities posted strong results in June, led by a rebound in small and mid cap stocks.
- While there was little dispersion between growth and value within large caps, growth beat value by 35 bps within small caps.
- Markets finally showed signs of broadening out in June, as the Russell 2000 posted a strong gain of 8.1%.
Non-U.S. Equities
- Non-U.S. equities posted solid gains last month, led by European stocks and the weaker USD.
- Unlike what occurred in the U.S., large caps beat small caps and value stocks led growth stocks by a wide margin.
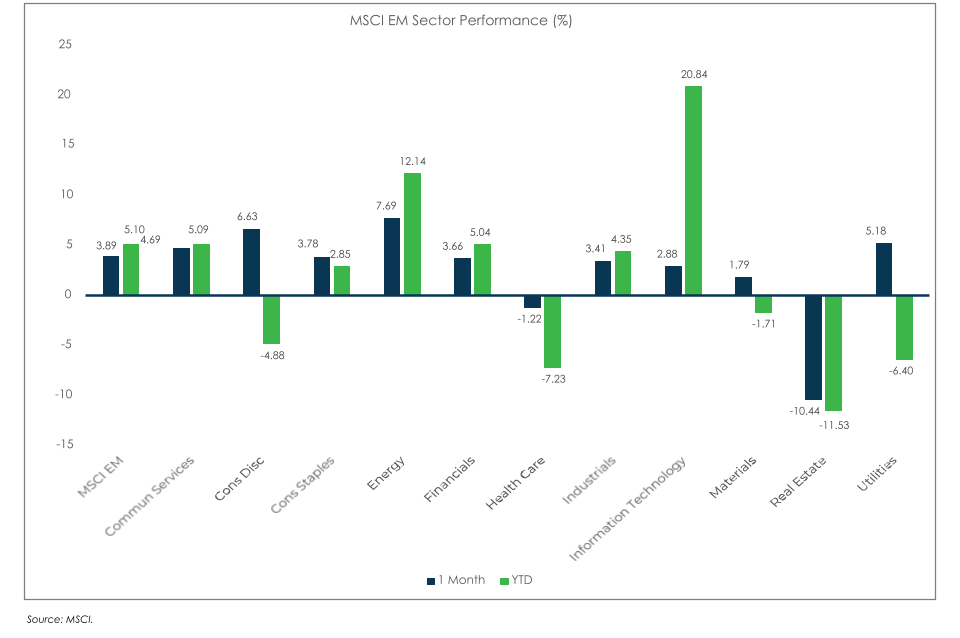
- EM equities rose nearly 4% last month led by strength in Latin America and Eastern Europe. China and Asia exhibited relative weakness and small caps lagged large caps.
S&P 500 (as of June 30, 2023)
Russell 2000 (as of June 30, 2023)
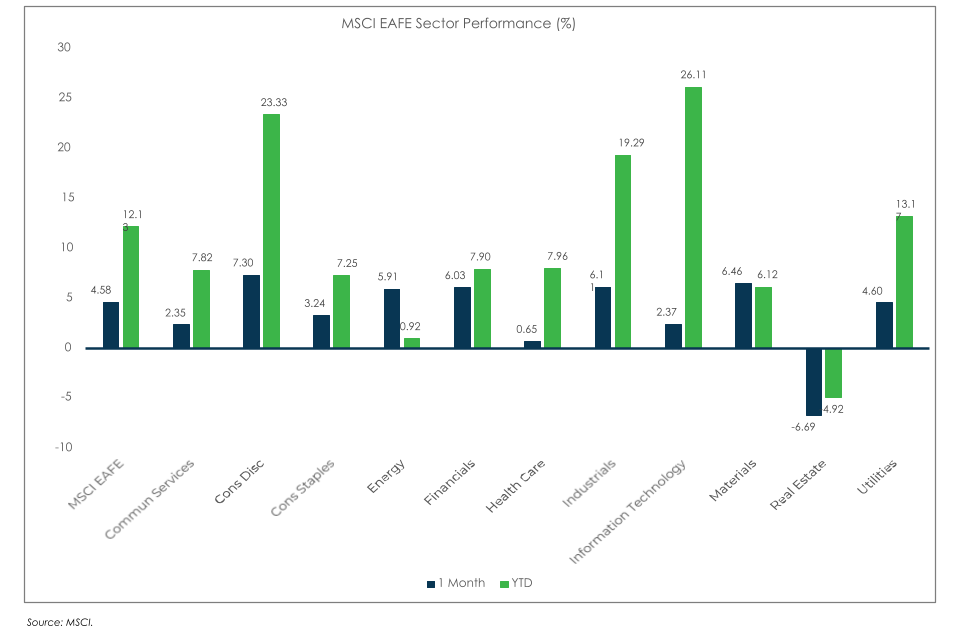
MSCI EAFE (as of June 30, 2023)
MSCI EM (as of June 30, 2023)