Market Flash Report | March 2023

Economic Highlights
United States
- The February employment report showed another strong and better than expected month of job growth. U.S. employers added 311,000 new jobs to the economy last month, well ahead of the 225,000 estimate. The unemployment rate rose to 3.6%, above the expectation for 3.4%, amid a tick higher in the labor force participation rate to 62.5%, its highest level since March 2020. A more encompassing unemployment measure that includes discouraged workers and those holding part-time jobs for economic reasons rose to 6.8%, from 6.6% in the prior month. There also was some good news on the inflation side, as average hourly earnings rose 4.6% Y/Y, below the estimate for 4.8%. The monthly increase of 0.2% also was below the 0.4% estimate. It should be noted that most of the job gains came from lower wage sectors of the economy.
- CPI inflation rose in February, but was largely in line with expectations. The consumer price index increased 0.4% for the month, putting the annual inflation rate at 6%, excluding volatile food and energy prices, core CPI rose 0.5% in February and 5.5% on a 12-month basis. The components of CPI were mixed with shelter costs rising 0.8%, food costs increased 0.4%, energy prices fell 0.6% and used car prices shed 2.8%. The February U.S. Core PCE price index, the Federal Reserve’s preferred measure of inflation, increased by 4.6% year-over-year, slightly below consensus expectations. Encouragingly, core PCE services excluding housing had its smallest increase in February since July 2022.
- The Fed cut its growth projections for the U.S. economy at its March meeting. The Fed slashed its estimate for 2023 GDP growth from 0.5% to 0.4%, with a similar downgrade for 2024. Current estimates for Q1 GDP growth stand at 2-2.5% so assuming that plays out, the Fed and other economists generally expect negative GDP growth over the remainder of 2023. While the Fed maintained its Fed Funds terminal rate of 5.1%, market-implied Fed Fund projections have come crashing down following the SVB collapse. After 475 bps of rate hikes over the past year, the market now expects 2-3 rate cuts by December 2023.
Non-U.S. Developed
- Eurozone economic growth accelerated to a 10-month high in March according to the latest PMI survey data (54.1 vs. 52.0 in February), adding to signs that the economy is reviving after falling into decline late last year. Inflationary pressures have continued to moderate, with input prices even falling sharply in manufacturing. Jobs growth has also accelerated and business confidence in the outlook has remained resilient despite concerns stemming from recent banking sector stress and higher borrowing costs. However, the overall rate of growth remains modest and driven solely by the service sector, with manufacturing suffering a further loss of new orders, meaning current output is only being sustained via backlogs of previously placed orders.
- Euro area headline CPI fell from 8.5% in February to 6.9% in March, the largest deceleration on record. The decline was mostly driven by a drop in energy prices relative to March of last year, when prices surged following Russia's invasion of Ukraine. On the other hand, core CPI accelerated to an all-time high of 5.7%, potentially strengthening the case for further monetary policy tightening in the Euro area.
- The annual inflation rate in Japan fell to 3.3% in February 2023 from January's 41-year high of 4.3%. The recent 3.3% reading was also the lowest since September 2022. Core inflation increased 3.1% Y/Y, the lowest reading in 5 months. While the headline number fell for the first time since October 2021, the current level of inflation remains well above the BOJ’s 2% policy target.
Emerging Markets
- China's economy showed signs of a recovery in the first two months of the year, led by a pickup in services after the end of three years of strict COVID-19 policies that had disrupted commerce and stifled domestic demand. While the service sector has fueled growth and economic activity during the COVID-19 reopening, the manufacturing sector has been more muted. The latest small-company focused Caixin/S&P Manufacturing PMI fell to 50 in March from February’s reading of 51.6. The official manufacturing PMI held above 50 in March, but the level of strength declined from February.
- The Chinese government has pegged growth for 2023 at “around” 5%, but most economists expect slower growth for the year and an increase of only 3.5-4% in the first quarter. The official services PMI was particularly strong in March at 58.2, supporting a positive backdrop for domestic demand and household consumption. The manufacturing sector continues to face the headwind from lackluster global growth and weak external demand.
- Brazil’s economy is expected to slow from 3% growth in 2022 to just 0.8% growth in 2023. The main factors for the slowdown include slower employment growth and tighter lending standards that should constrain consumer spending.
Market Performance (as of 03/31/23)
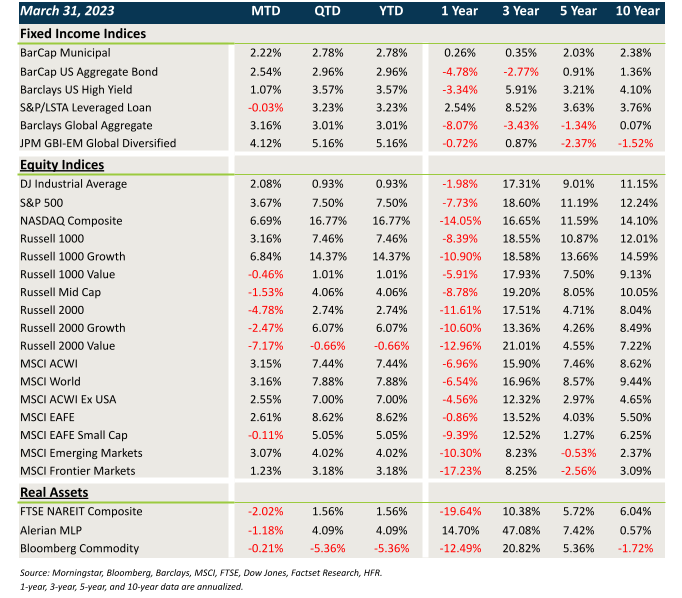
Fixed Income
- Fixed income topped a good start to 2023 with strong March gains.
- Treasury and sovereign debt yields fell in March, providing a nice boost to core fixed income and munis.
- Credit was a bit more challenged by the regional banking crisis that played out last month. Spreads widened a bit, but in most cases, carry provided a sufficient offset.
- The weaker USD boosted non-U.S. assets.
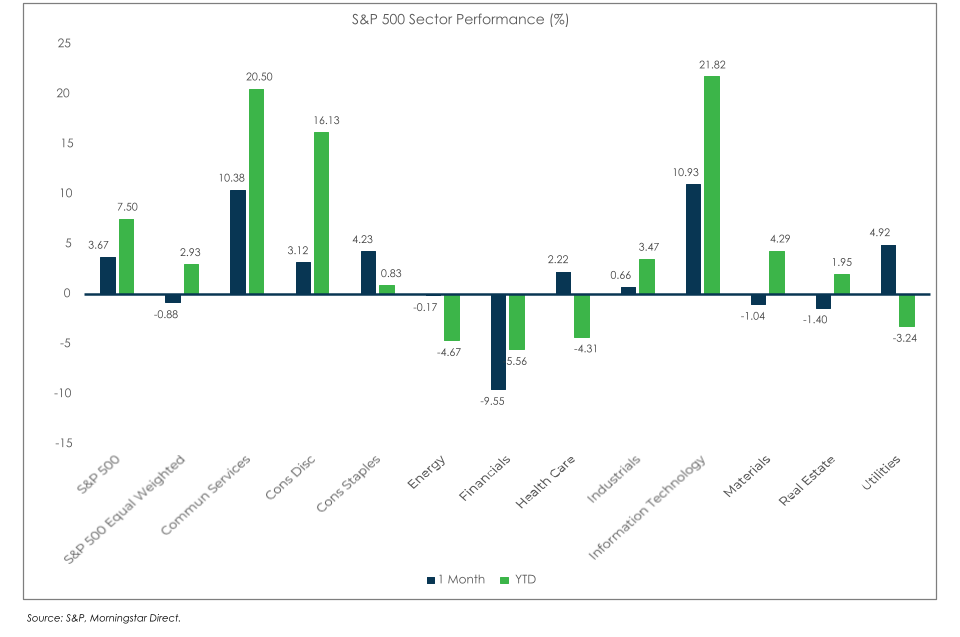
U.S. Equities
- U.S. large caps out-performed in March, led by the resurgence in growth/tech stocks.
- Growth beat value by a wide margin across the entire market cap spectrum.
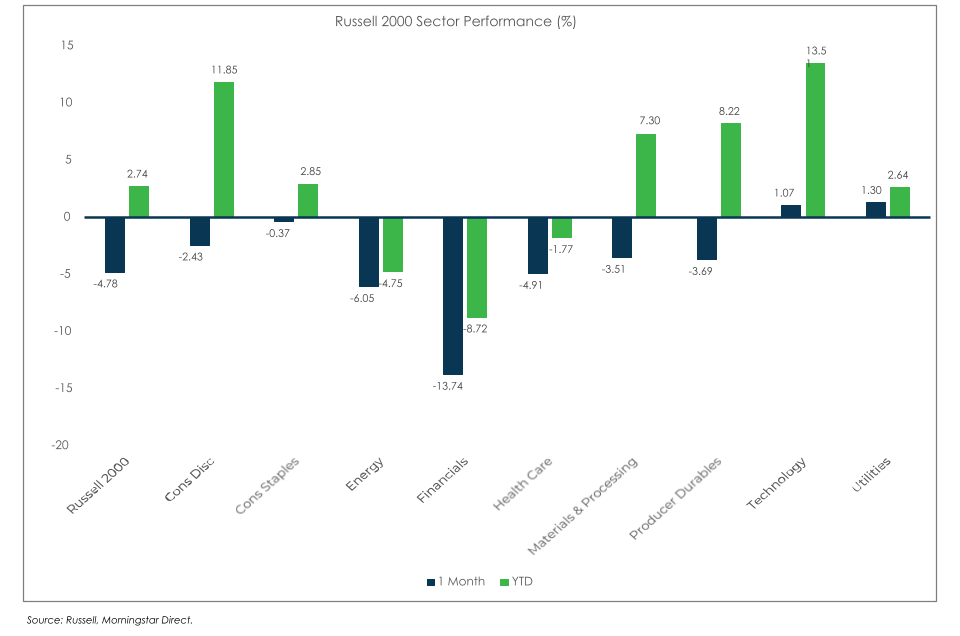
- Small caps were particularly weak in March, led by exposure to regional banks and the potential for tighter lending standards.
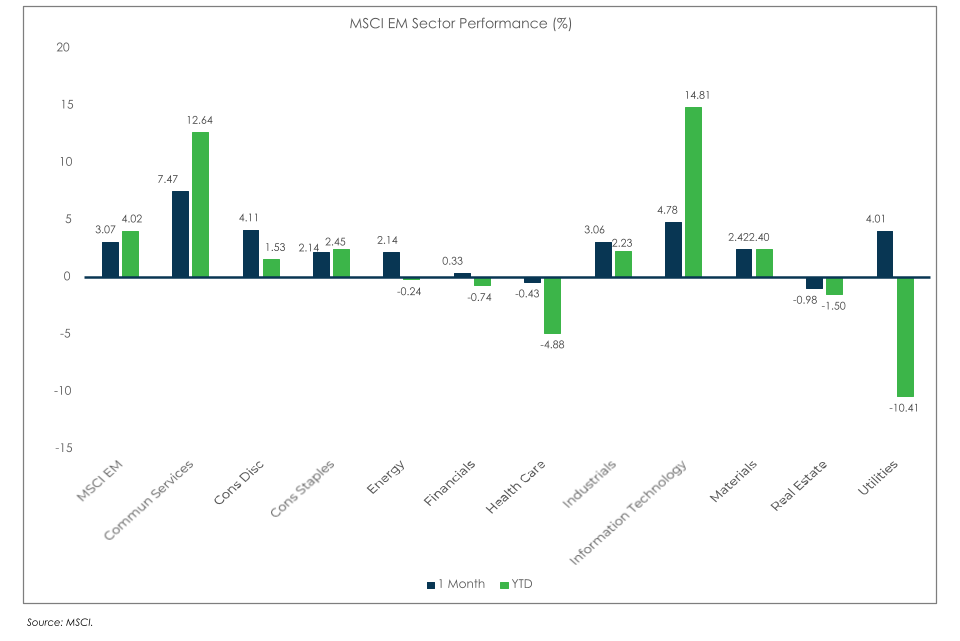
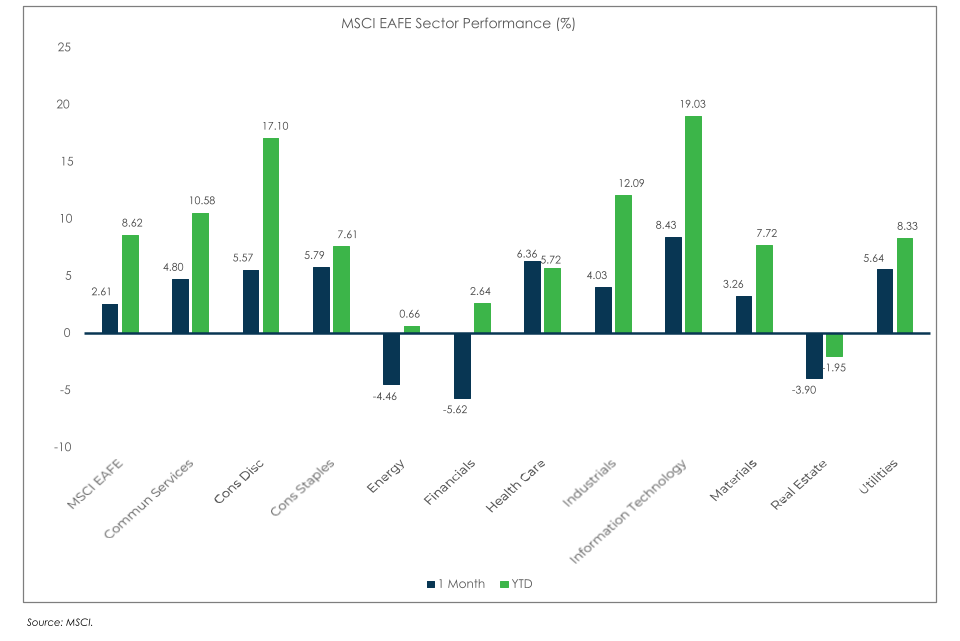
Non-U.S. Equities
- Developed and EM equities posted a solid month of returns, led by the global rebound in growth stocks.
- Similar to the U.S., small caps trailed large caps.
- The weaker USD boosted EAFE returns by 198 bps and EM returns by 87 bps.
S&P 500 (as of March 31, 2023)
Russell 2000 (as of March 31, 2023)
MSCI EAFE (as of March 31, 2023)
MSCI EM (as of March 31, 2023)