Market Flash Report |
May 2023

Economic Highlights
United States
- The U.S. economy continued to crank out jobs in May, with nonfarm payrolls surging more than expected despite multiple macro and geopolitical headwinds. Payrolls in the public and private sector increased by 339,000 for the month, better than the 190,000 estimate. Despite the labor force participation rate remaining unchanged, the unemployment rate rose to 3.7% in May, which was slightly higher than the estimate for 3.5%. The jobless rate was the highest since October 2022, although still near the lowest since 1969. Average hourly earnings, a key inflation indicator, rose 0.3% M/M, which was in line with expectations. On an annual basis, wages increased 4.3%, which was 0.1% below the estimate. Finally, the U6 unemployment rate ticked up to 6.7%.
- The Federal Reserve has raised rates 10 times since March 2022 and the odds for a 25 bps rate hike in June are around 30%. Many Fed governors have indicated a willingness to pause in June to assess the impact of significant policy tightening on the U.S. economy. They are also concerned about creating additional stress for regional banks. The economy appears resilient based on consumer spending trends and the employment picture. Other factors like manufacturing point to some underlying weakness.
- The latest reading on inflation showed that prices increased 0.4% M/M or 4.9% Y/Y in April. Excluding volatile food and energy categories, core CPI rose 0.4% monthly and 5.5% from a year ago, both in line with expectations. Price increases for shelter, gas and used vehicles pushed the index higher, but were partially offset by declines in prices for fuel oil, new vehicles and food at home. Shelter costs, a lagging indicator, which is 1/3 of core CPI, rose 0.4%, but all indications point to declines. U.S. core PCE increased to 4.7% Y/Y in April, above consensus expectations for a 4.6% reading.
Non-U.S. Developed
- The Eurozone HCOB Composite PMI fell to a 3-month low of 53.3 in May versus the 54.1 reading in April. Services continued to exhibit strength with a reading of 55.9, but manufacturing showed weakness with a 36-month low reading of 44.6. All in all, the composite PMI pointed to solid growth in the eurozone through the second quarter of 2023. Eurozone GDP is likely to grow in Q2, largely due to the strong services backdrop, but manufacturing weakness is a clear drag on economic momentum.
- Eurozone inflation fell from 7% in April to 6.1% in May. Core inflation, closely-watched by the European Central Bank (ECB), eased to 5.3% from 5.6%. The decline in headline inflation resulted in the lowest reading since February 2022. The ECB meets on June 15 to make its latest monetary policy decision after gradually hauling its benchmark rate from -0.5% a year ago to 3.25% in May — its highest level since November 2008.
- In the U.K., core CPI accelerated to 6.8% Y/Y in April, above consensus expectations. While headline inflation moderated to 8.7% Y/Y, it also surprised to the upside. Looking ahead, the expectation is for core inflation to moderate gradually, and that should lead to additional rate hikes by the Bank of England.
- Japan's economy emerged from recession and grew faster than expected in Q1 as a post-COVID-19 consumption rebound offset global headwinds, shoring up hopes for a sustained recovery. Japan’s GDP grew at an annualized rate of 1.6%, well ahead of the 0.7% estimate. Private consumption and business spending both exceeded expectations in Q1.
Emerging Markets
- In May, China's factory activity unexpectedly swung from decline to growth. This was driven by improved production and demand, which helped struggling firms that had previously been hit by slumping profits. The Caixin/S&P Global manufacturing PMI rose to 50.9 in May from 49.5 in April, above the 50-point index mark that separates growth from contraction. The Caixin data contrasts sharply with a deepening decline in activity shown in a government survey, which mainly covers larger businesses and state-owned companies. The official manufacturing PMI dropped to 48.8 in May from April’s 49.2, the lowest level since December, when China ended most of its pandemic measures.
- China’s service sector continued to show some strength based on the official services PMI that came in at 54.5 (down from 56.4 in April). Despite the decline, it was the 5th consecutive month in expansion territory after the country removed strict COVID-19 restrictions.
- India’s economy surged higher in Q1 with growth of 6.1%. This was well ahead of the 5% expectation and the government expects growth to remain around 6.5% this fiscal year despite increased global headwinds. India’s economy grew 9.1% last year and current estimates sit at 7.2% for the current year. Economists believe the world's most populous country needs to grow by between 7% and 8% a year and build a strong manufacturing base to create jobs for millions of workers. Currently, 45% of India's workforce is employed in the farm sector, which contributes just 15% to the economy. Private consumption was weak in Q1, but it was more than offset by growth in business investment and government spending.
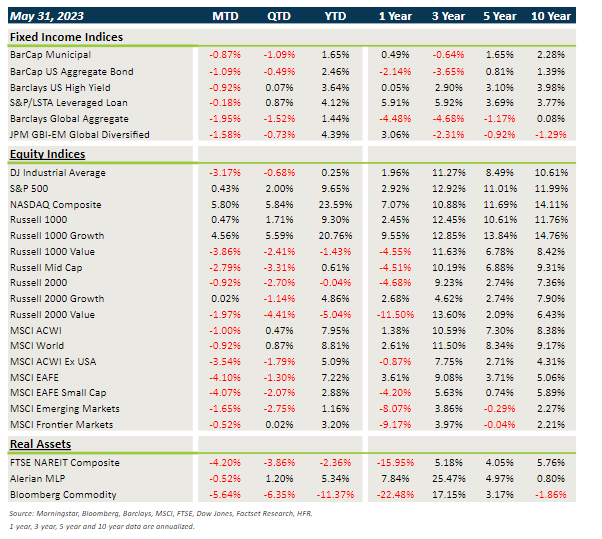
Market Performance (as of 05/31/23)
Fixed Income
- Yields backed up a bit in May, leading to broad losses in core fixed income and municipal bonds.
- Credit exhibited weakness last month, with spread widening that was unable to offset the benefits of higher carry. Credit has still been one of the stronger performers YTD.
- Bonds outside the U.S. were hit by the strong U.S. dollar rebound in May, along with a slight move higher in yields.
U.S. Equities
- The story in 2023 continues to be that mega-cap growth/tech stocks are powering equity markets higher.
- Growth trounced value in May and large caps outperformed small caps.
- The Nasdaq has led the way this year with a gain of nearly 24%. 6-7 companies are responsible for most of the performance contribution in May and 2023.
Non-U.S. Equities
- For the first time in several months, non-U.S. equities lagged their U.S. counterparts.
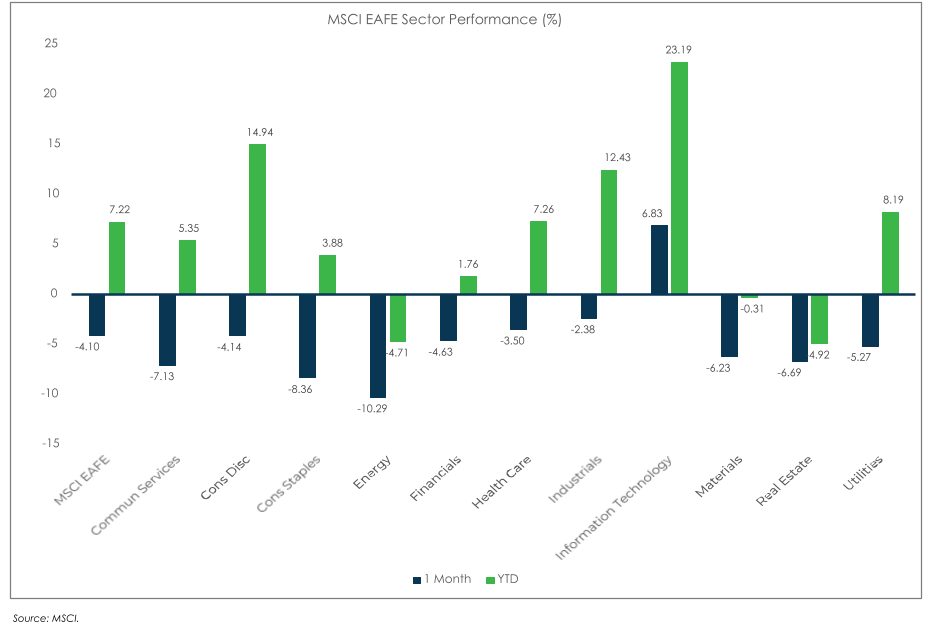
- The MSCI EAFE was dragged down by weakness in Europe. Japan posted positive gains in May.
- Growth beat value and there was little difference between small caps and large caps.
- USD strength was the big driver of non-U.S. weakness.
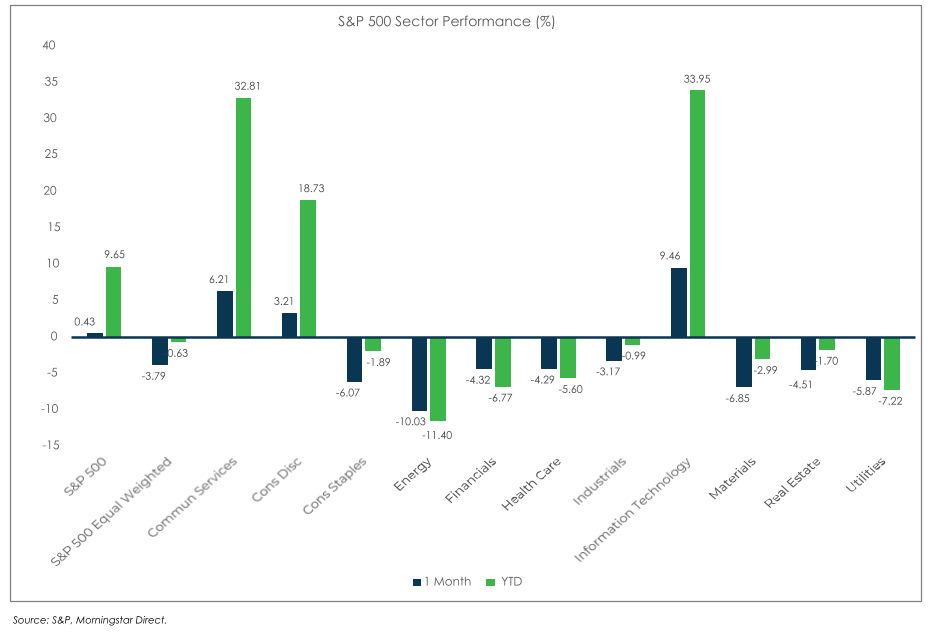
S&P 500 (as of May 31, 2023)
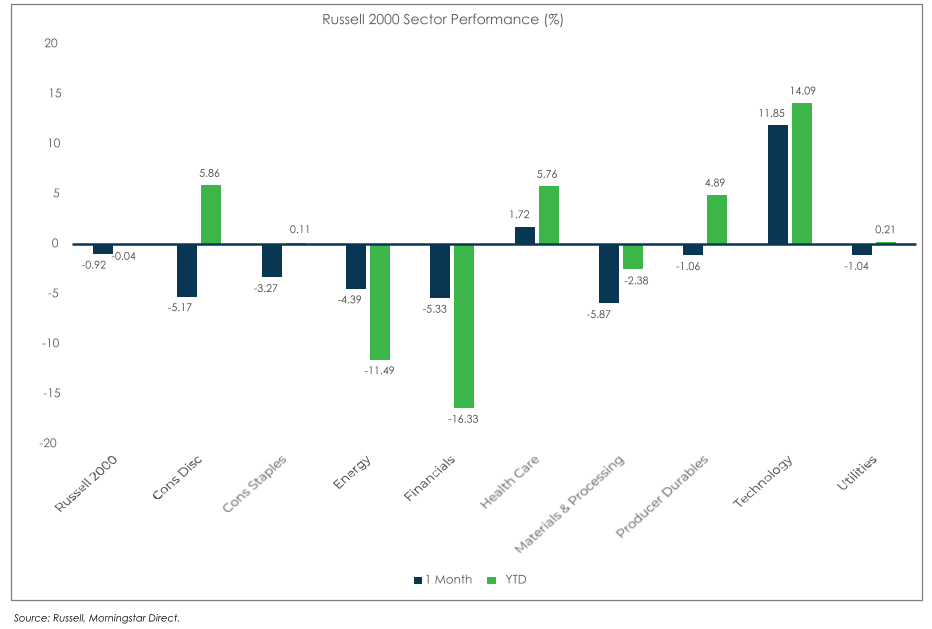
Russell 2000 (as of May 31, 2023)
MSCI EAFE (as of May 31, 2023)
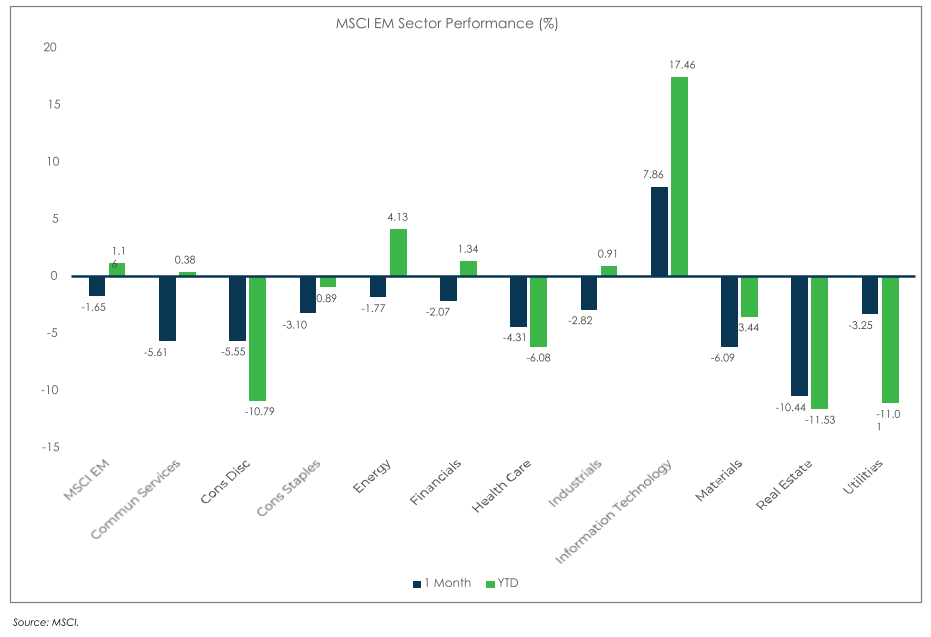
MSCI EM (as of May 31, 2023)