Market Flash Report | May 2024

Economic Highlights
United States
- The April employment report came in well below expectations with only 175,000 new jobs added to the U.S. economy. 240,000 was the estimate and the previous two months were revised lower. The unemployment rate jumped to 3.9% and average hourly earnings were 3.9% higher Y/Y, below expectations and perhaps a sign of cooling inflation. This report combined with the recent GDP reading portray a softening environment where growth appears to finally be slowing.
- U.S. GDP was revised down to 1.3% annualized in the first quarter, below consensus expectations, reflecting a downward revision to consumption growth, offset by upward revisions to the housing and capital expenditure categories. The latest Q2 GDP estimate from the Atlanta Federal Reserve sits at +1.8%.
- April’s consumer price index (CPI) report showed some easing of inflation, but prices still rose 3.4% Y/Y. Core CPI increased 3.6% Y/Y, the lowest reading since April 2021. The Fed’s preferred inflation gauge, the Personal Consumption Expenditures (PCE) Price Index, rose 2.7% Y/Y or 2.8% Y/Y when excluding volatile food and energy. PCE has been lower due to the factoring of substitutions, but all in all, little progress has been made on sticky inflation recently.
- The ISM Manufacturing Purchasing Managers’ Index (PMI) remained in contraction territory, with a May reading of 48.7 (down from 49.2 in April). Employment showed some strength, but this was more than offset by weakness in new orders and production. The closely watched prices component also fell in May.
- Durable goods orders rose 0.7% in April, slightly below the 0.8% increase in March, but far better than the expectation for a 1% decline. Excluding transportation items, orders still accelerated 0.4%.
- New home sales in the U.S. tumbled 4.7% in April, following weakness in March. The April number came in at 634,000, down from the revised 665,000 for March. The median price of a new house, meanwhile, rose to $433,500 from the $430,700 level posted in March. Existing home sales also fell 1.9%. The housing market is struggling with high prices and high mortgage rates.
Non-U.S. Developed
- The economic recovery in the eurozone gained momentum in May, according to the Flash Composite PMI data. Faster increases in business activity, new orders and employment were all recorded midway through Q2. Growth continued to be centered on the services sector, but manufacturing production neared stabilization in May, falling only marginally and to the least extent in the current 14-month period of contraction. GDP is on pace to grow 0.3% Q/Q based on current PMI data.
- In the eurozone, Y/Y headline and core inflation printed at 2.6% and 2.9%, respectively. The above-consensus prints were predominantly driven by strong services prices as the job market remains tight.
- Headline CPI inflation in Japan fell to an annualized rate of 2.5% in May from 2.7% the previous month. The core rate of inflation fell from 2.6% in April to 2.2% in May. Food prices cooled for the first time in 19 months and core inflation was the lowest since January. Hotter-than-expected inflation in Japan has resulted in the 10-year Japanese Government Bond moving above 1% for the first time in 12 years.
Emerging Markets
- China's May manufacturing PMI fell to 49.5, down from 50.4 in April. May's manufacturing PMI marked a 3-month low and was disappointing after the recent strength of industrial activity data. The main reason for this month's decline was a drop in new orders (49.6) and new export orders (48.3), which both fell back into contraction after two months of expansion.
- While the official manufacturing PMI fell back into contraction territory, the smaller company-focused Caixin Manufacturing PMI increased to its highest level since June 2022, at 51.7. To counter soft domestic demand and a years-long property crisis, China has boosted infrastructure investment and ploughed funds into high-tech manufacturing to bolster the broader economy this year.
- China’s official Non-Manufacturing PMI also edged down in May to 51.1 from 51.2 in April. Retail sales in China grew only 2.3% Y/Y in April, the slowest pace in 15 months. While CPI has increased slightly for the last three months, producer prices have fallen for 19 straight months. These bearish reports from China suggest the economic recovery may still be facing headwinds from the ongoing property sector downturn.
Fixed Income
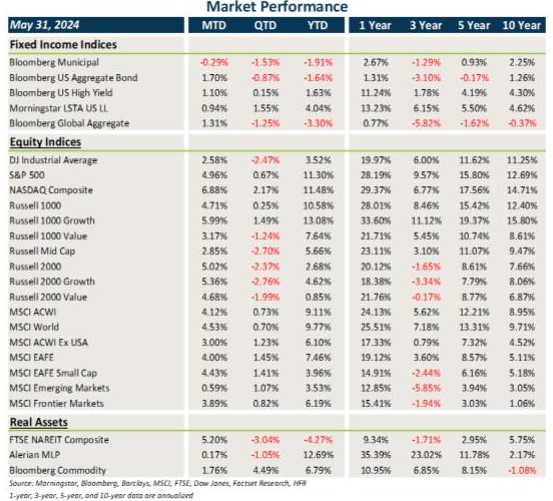
- Treasury and other sovereign debt yields fell across the board in May, resulting in gains for core fixed income. Municipal bond technicals were weak, causing a modest decline.
- Credit spreads generally tightened further last month, leading to gains in investment grade bonds, high-yield bonds and loans.
- Bonds outside the U.S. benefited from similar trends of spread tightening and falling yields, and also got a boost from U.S. dollar weakness.
U.S. Equities
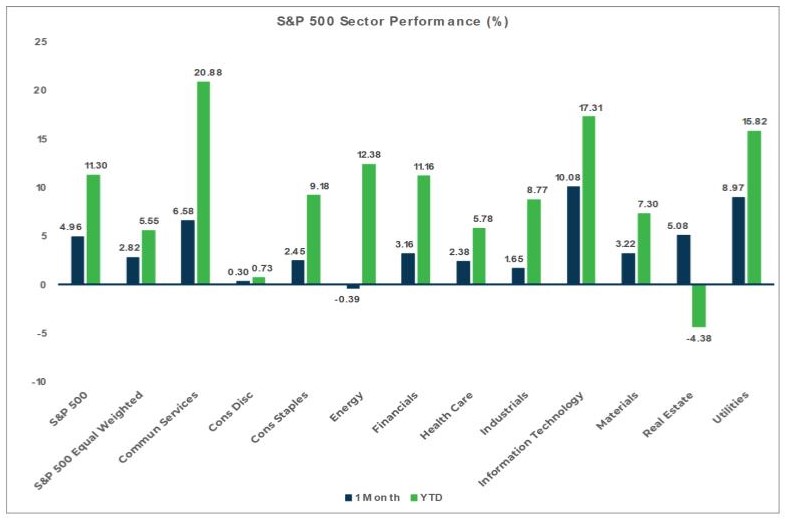
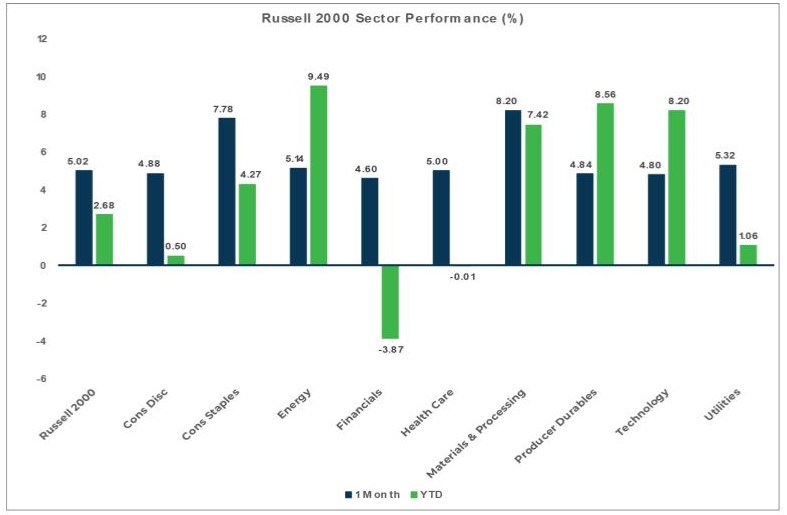
- U.S. equities posted positive returns in May, led by strength in growth/tech stocks and small cap stocks.
- Small caps beat large caps by a slight margin, and growth outperformed value stocks.
- U.S. equities have posted very solid year-to-date gains through the end of May, although market breadth remains fairly narrow.
Non-U.S. Equities
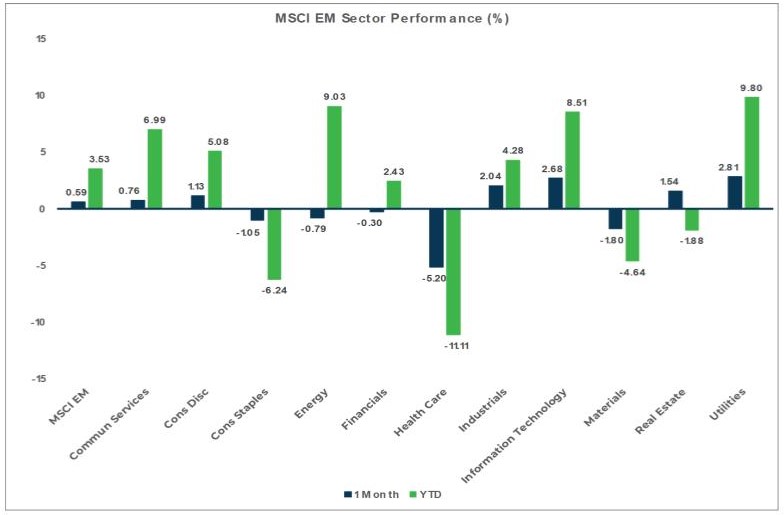
- Non-U.S. equities lagged U.S. equities last month and emerging markets (EM) really lagged developed markets.
- Similar to the U.S., small caps beat large caps outside the U.S., but value outperformed growth stocks.
- LatAm drove the EM weakness.
- U.S. dollar weakness provided a tailwind for non-U.S. equities.
Sector Performance - S&P 500 (as of 05/31/24)
Sector Performance - Russell 2000 (as of 05/31/24)
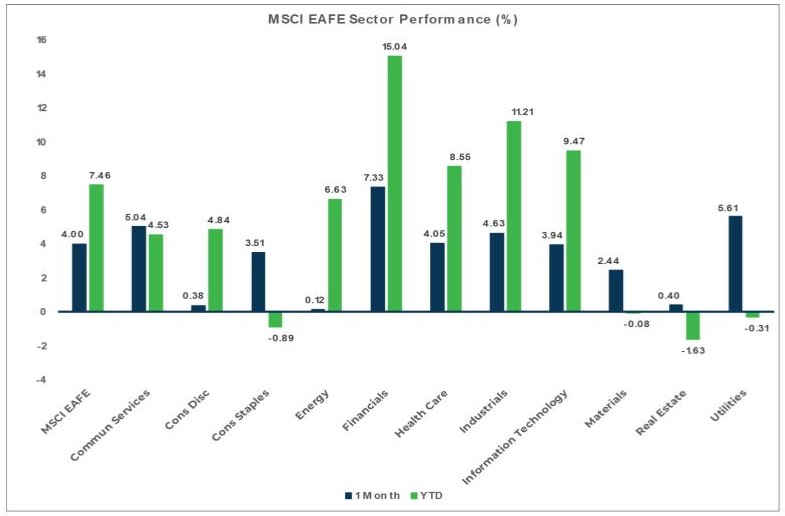
Sector Performance - MSCI EAFE (as of 05/31/24)
Sector Performance - MSCI EM (as of 05/31/24)