Market Flash Report | May 2025

Economic Highlights
United States
- All eyes will be on the May employment report to analyze any impacts from DOGE efforts or tariffs. Economists expect 130,000 new jobs to be added to the U.S. economy and a steady unemployment rate of 4.2%.
- Prices fell more than anticipated in April, with headline Consumer Price Index (CPI) falling to an annualized rate of 2.3%, down from 2.4% in March. Core CPI, which excludes volatile food and energy, held steady at 2.8% in April. Energy prices rebounded 0.7% in April while food prices fell 0.1%. The Personal Consumption Expenditures (PCE) Index rose 0.1% M/M in April or 2.1% Y/Y. Core PCE came in a bit below expectations at an annual rate of 2.5%. Consumer spending slowed sharply in April, posting a 0.2% increase versus the 0.7% increase in March.
- U.S. retail sales growth slowed sharply in April, as the boost from front-loaded purchases faded. Retail sales rose 0.1% after surging 1.7% in March. Core retail sales declined 0.2% after rising 0.5% in March. Sales fell at auto dealerships and sporting goods stores, but rose at online retail and bars and restaurants. Retail sales grew 5.2% Y/Y in April.
- New orders for durable goods plummeted in April, but beneath the headline lay a much more subdued picture. The 6.3% decline in new orders was almost entirely due to the very volatile category of commercial aircraft, which came back down after surging in March. Excluding the transportation sector, orders for durable goods rose 0.2% in April. Core shipments, a key input for business investment in the calculation of GDP, declined 0.1% in April.
- The U.S. manufacturing sector remained in contraction territory, based on the May ISM Manufacturing Purchasing Managers’ Index (PMI) reading of 48.5. Most of the weakness came from the inventories, prices and new export orders components. Most key measures are stuck in contraction territory. Consumer confidence jumped by 12.3 points in May to 98.0, its biggest increase in four years, thanks to optimism about the potential for trade deals.
Non U.S. Developed
- The eurozone flash composite PMI fell back into contraction territory in May, with a reading of 49.5 versus April’s 50.4 headline figure. The services component fell to a 16-month low last month while manufacturing hit a 33-month high. Germany joined France in contraction territory for May as the remaining eurozone countries outperformed the two largest economies. Manufacturing prices fell in May, but they surged across the service sector. The European Central Bank will likely continue with cautious rate cuts.
- The eurozone economy grew by 0.3% in Q1 2025, slightly below the preliminary estimate of 0.4%, but marking the fifth consecutive quarter of expansion. The growth was supported by stronger domestic demand, fueled by easing inflation and lower borrowing costs, and renewed optimism following Germany’s decision to relax fiscal constraints. Expectations of increased defense spending in the coming months also helped counterbalance ongoing concerns over volatile U.S. tariff policies.
- Japan's GDP shrank 0.2% Q/Q in Q1 2025 after growing 0.6% in Q4. This was the first quarterly contraction in a year, weighed by concerns over the impact of U.S. trade policies and weak demand from major trading partners, including China. Net trade subtracted 0.8% from Q1 GDP and consumer and government spending were stagnant. Business spending was a positive contributor in Q1. Inflation in Japan held steady at 3.6% in April, although core CPI jumped to a 2-year high of 3.5%.
Emerging Markets
- China’s manufacturing activity contracted in May for a second month, fueling expectations for more stimulus to support the economy amid a protracted trade war with the U.S. The official manufacturing PMI came in at 49.5 in May, up from 49.0 in April. The non-manufacturing PMI, which includes services and construction, fell to 50.3 in May from 50.4 in the prior month.
- China's consumer prices dropped by 0.1% Y/Y in April 2025, marking the third consecutive month of consumer deflation, weighed by the combined effects of ongoing trade tensions with the U.S., weak domestic demand and persistent employment uncertainty. Core inflation, which excludes volatile food and fuel prices, rose 0.5%, holding steady for the second month.
- India’s economy expanded at a better-than-expected 7.4% annualized rate in Q1 2025, up from 6.4% growth in Q4 2024. The recovery pointed to traction in Indian economic growth after a period of softening, as lower food and energy prices spurred lower interest rates and investment. India also has low dependence on exports, providing insulation against global tariff threats. The annual inflation rate in India fell to 3.2% in April 2025, the lowest since July 2019. With the inflation rate sitting below the Reserve Bank of India’s 4% midpoint target, additional rate cuts could be on the horizon.
- Taiwan’s Q1 2025 GDP surged 5.5%, up from the 3.8% rate in the previous quarter. Exports grew by 20.3% in Q1 2025, supported by strong global demand for electronic information and communication products. Trade policy uncertainty caused the government to cut its 2025 GDP forecast slightly to 3.1%.
- Brazil’s economy expanded by 2.9% year-on-year in Q1 2025, down from 3.6% in the previous quarter. While agriculture grew 10%, growth slowed in construction, services, household spending and government spending.
Fixed Income
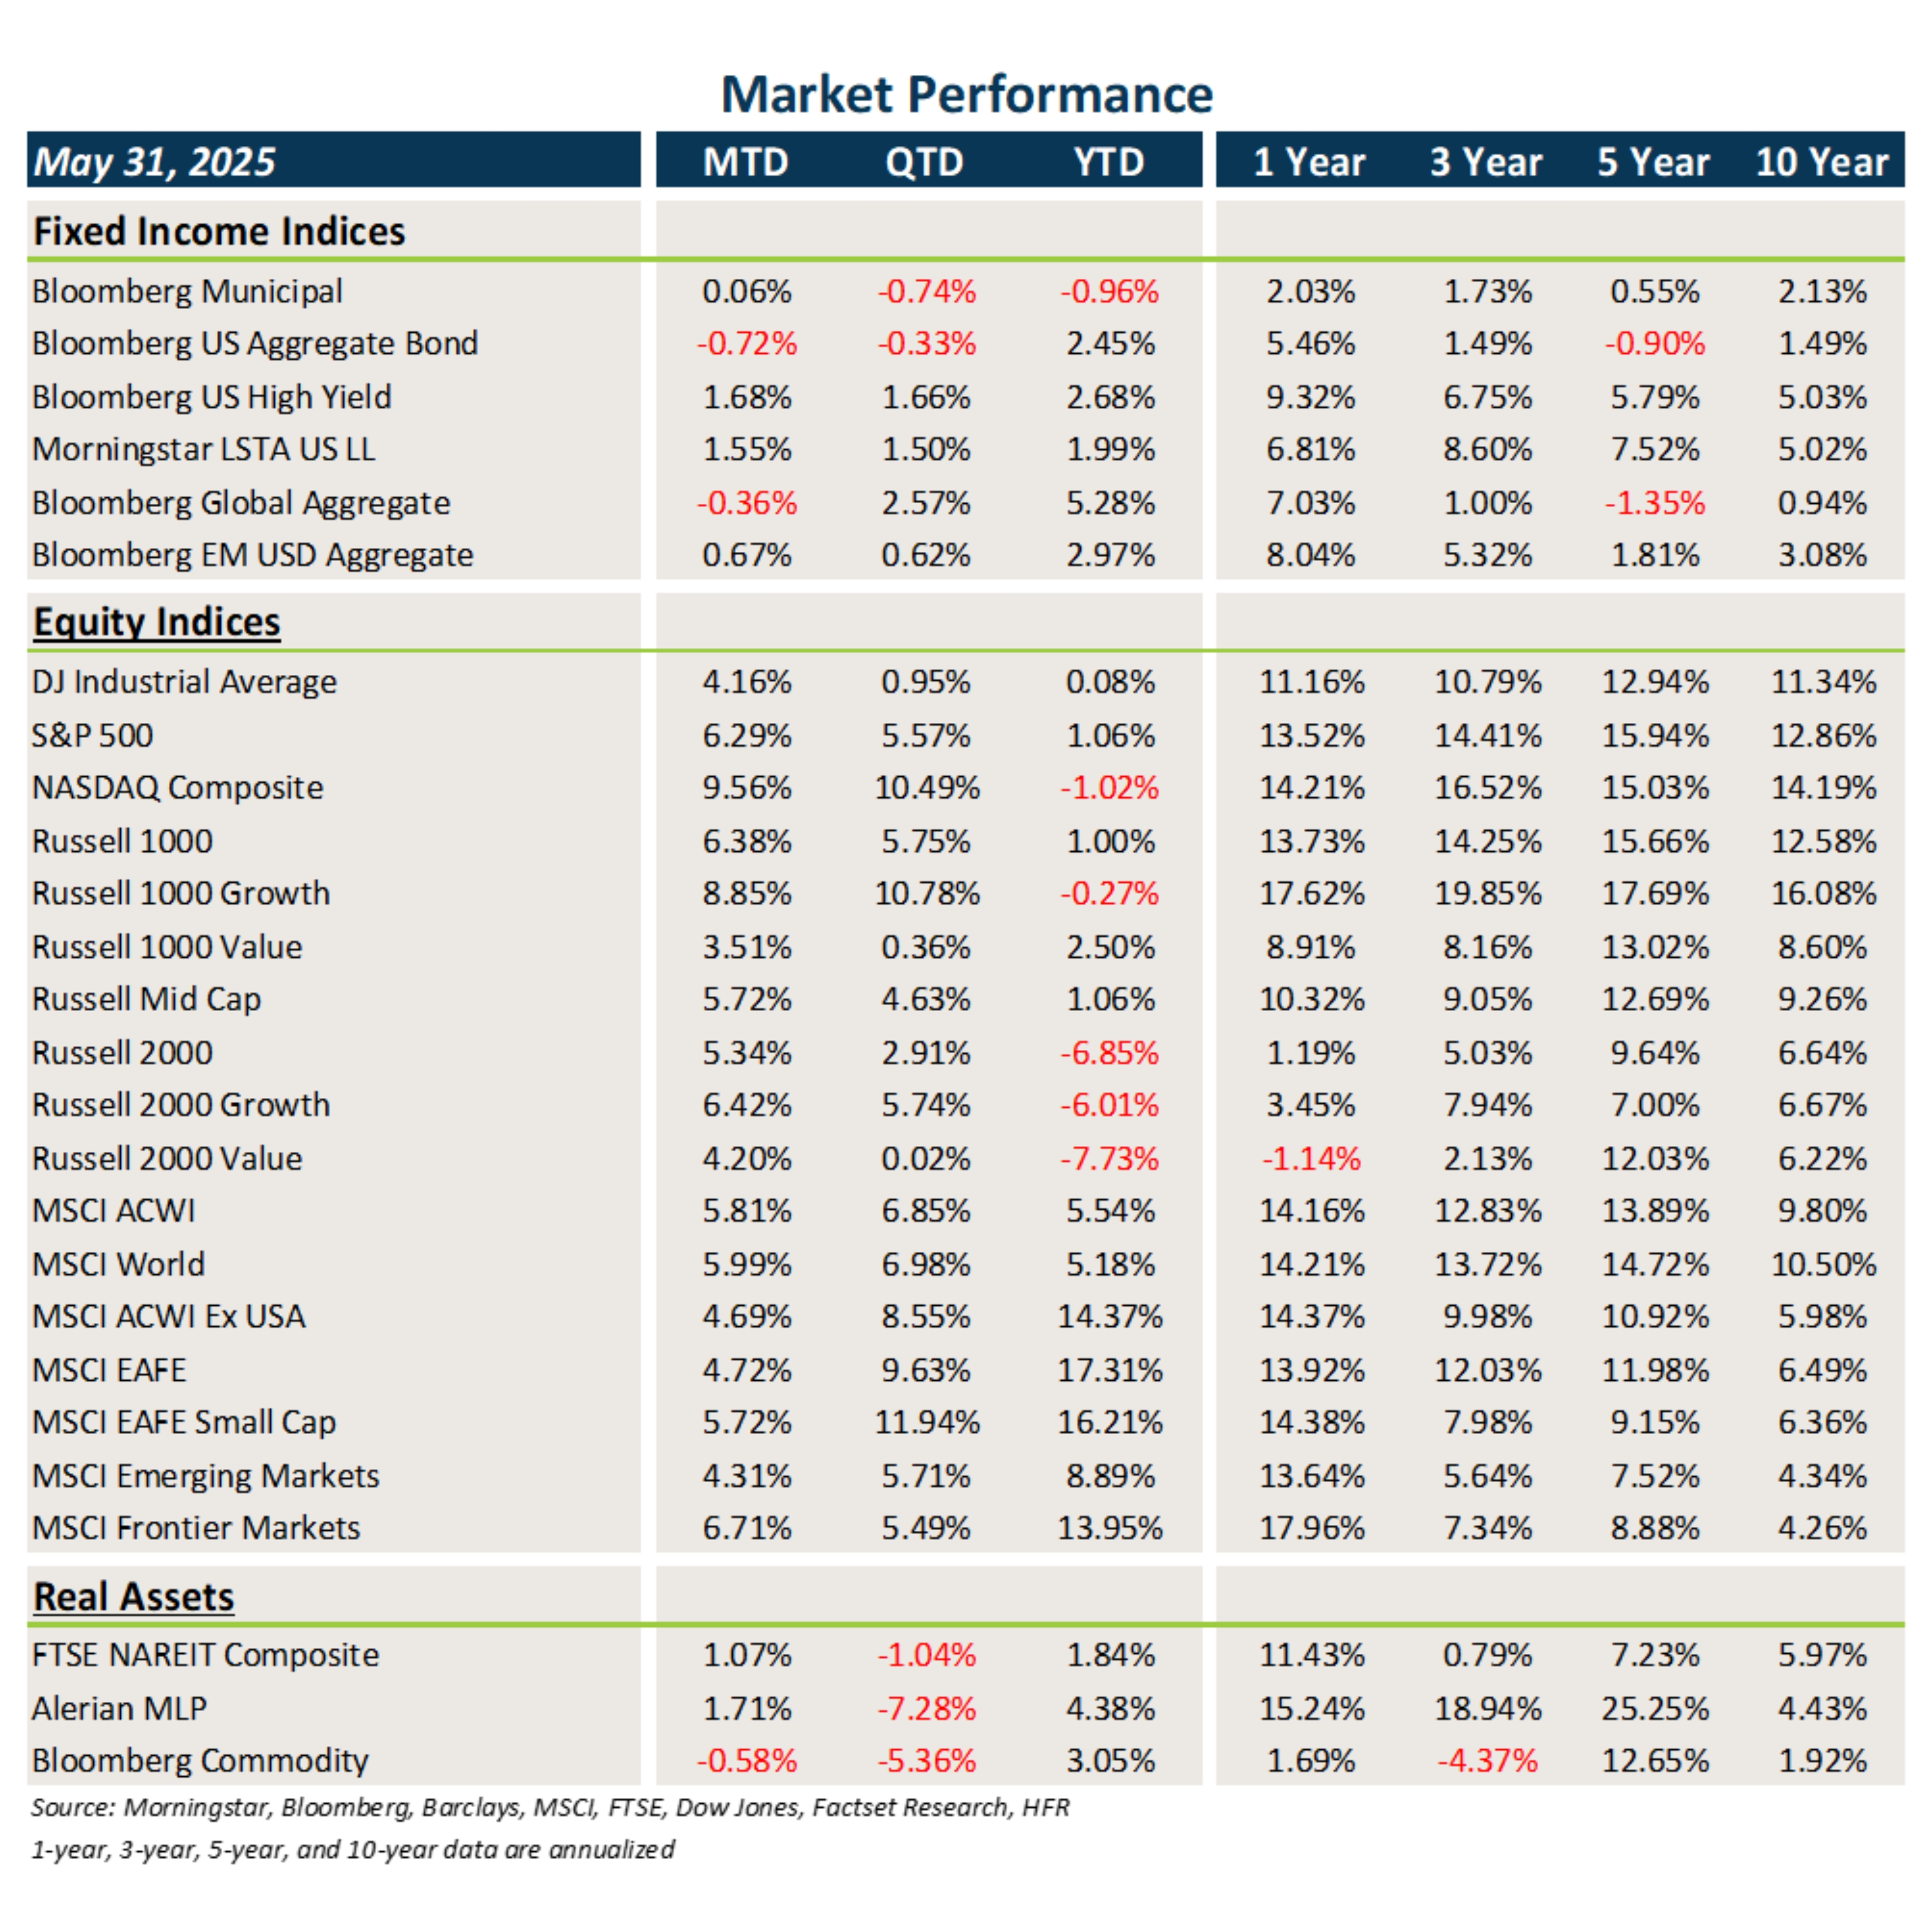
- Interest rates remained volatile in May, ultimately marching higher to end the month. This led to modest losses in core fixed income and flat performance from muni bonds.
- Credit, once again, benefited from spread tightening and higher starting yields.
- Bonds outside the U.S. were hurt primarily by the backup in rates globally during May.
U.S. Equities
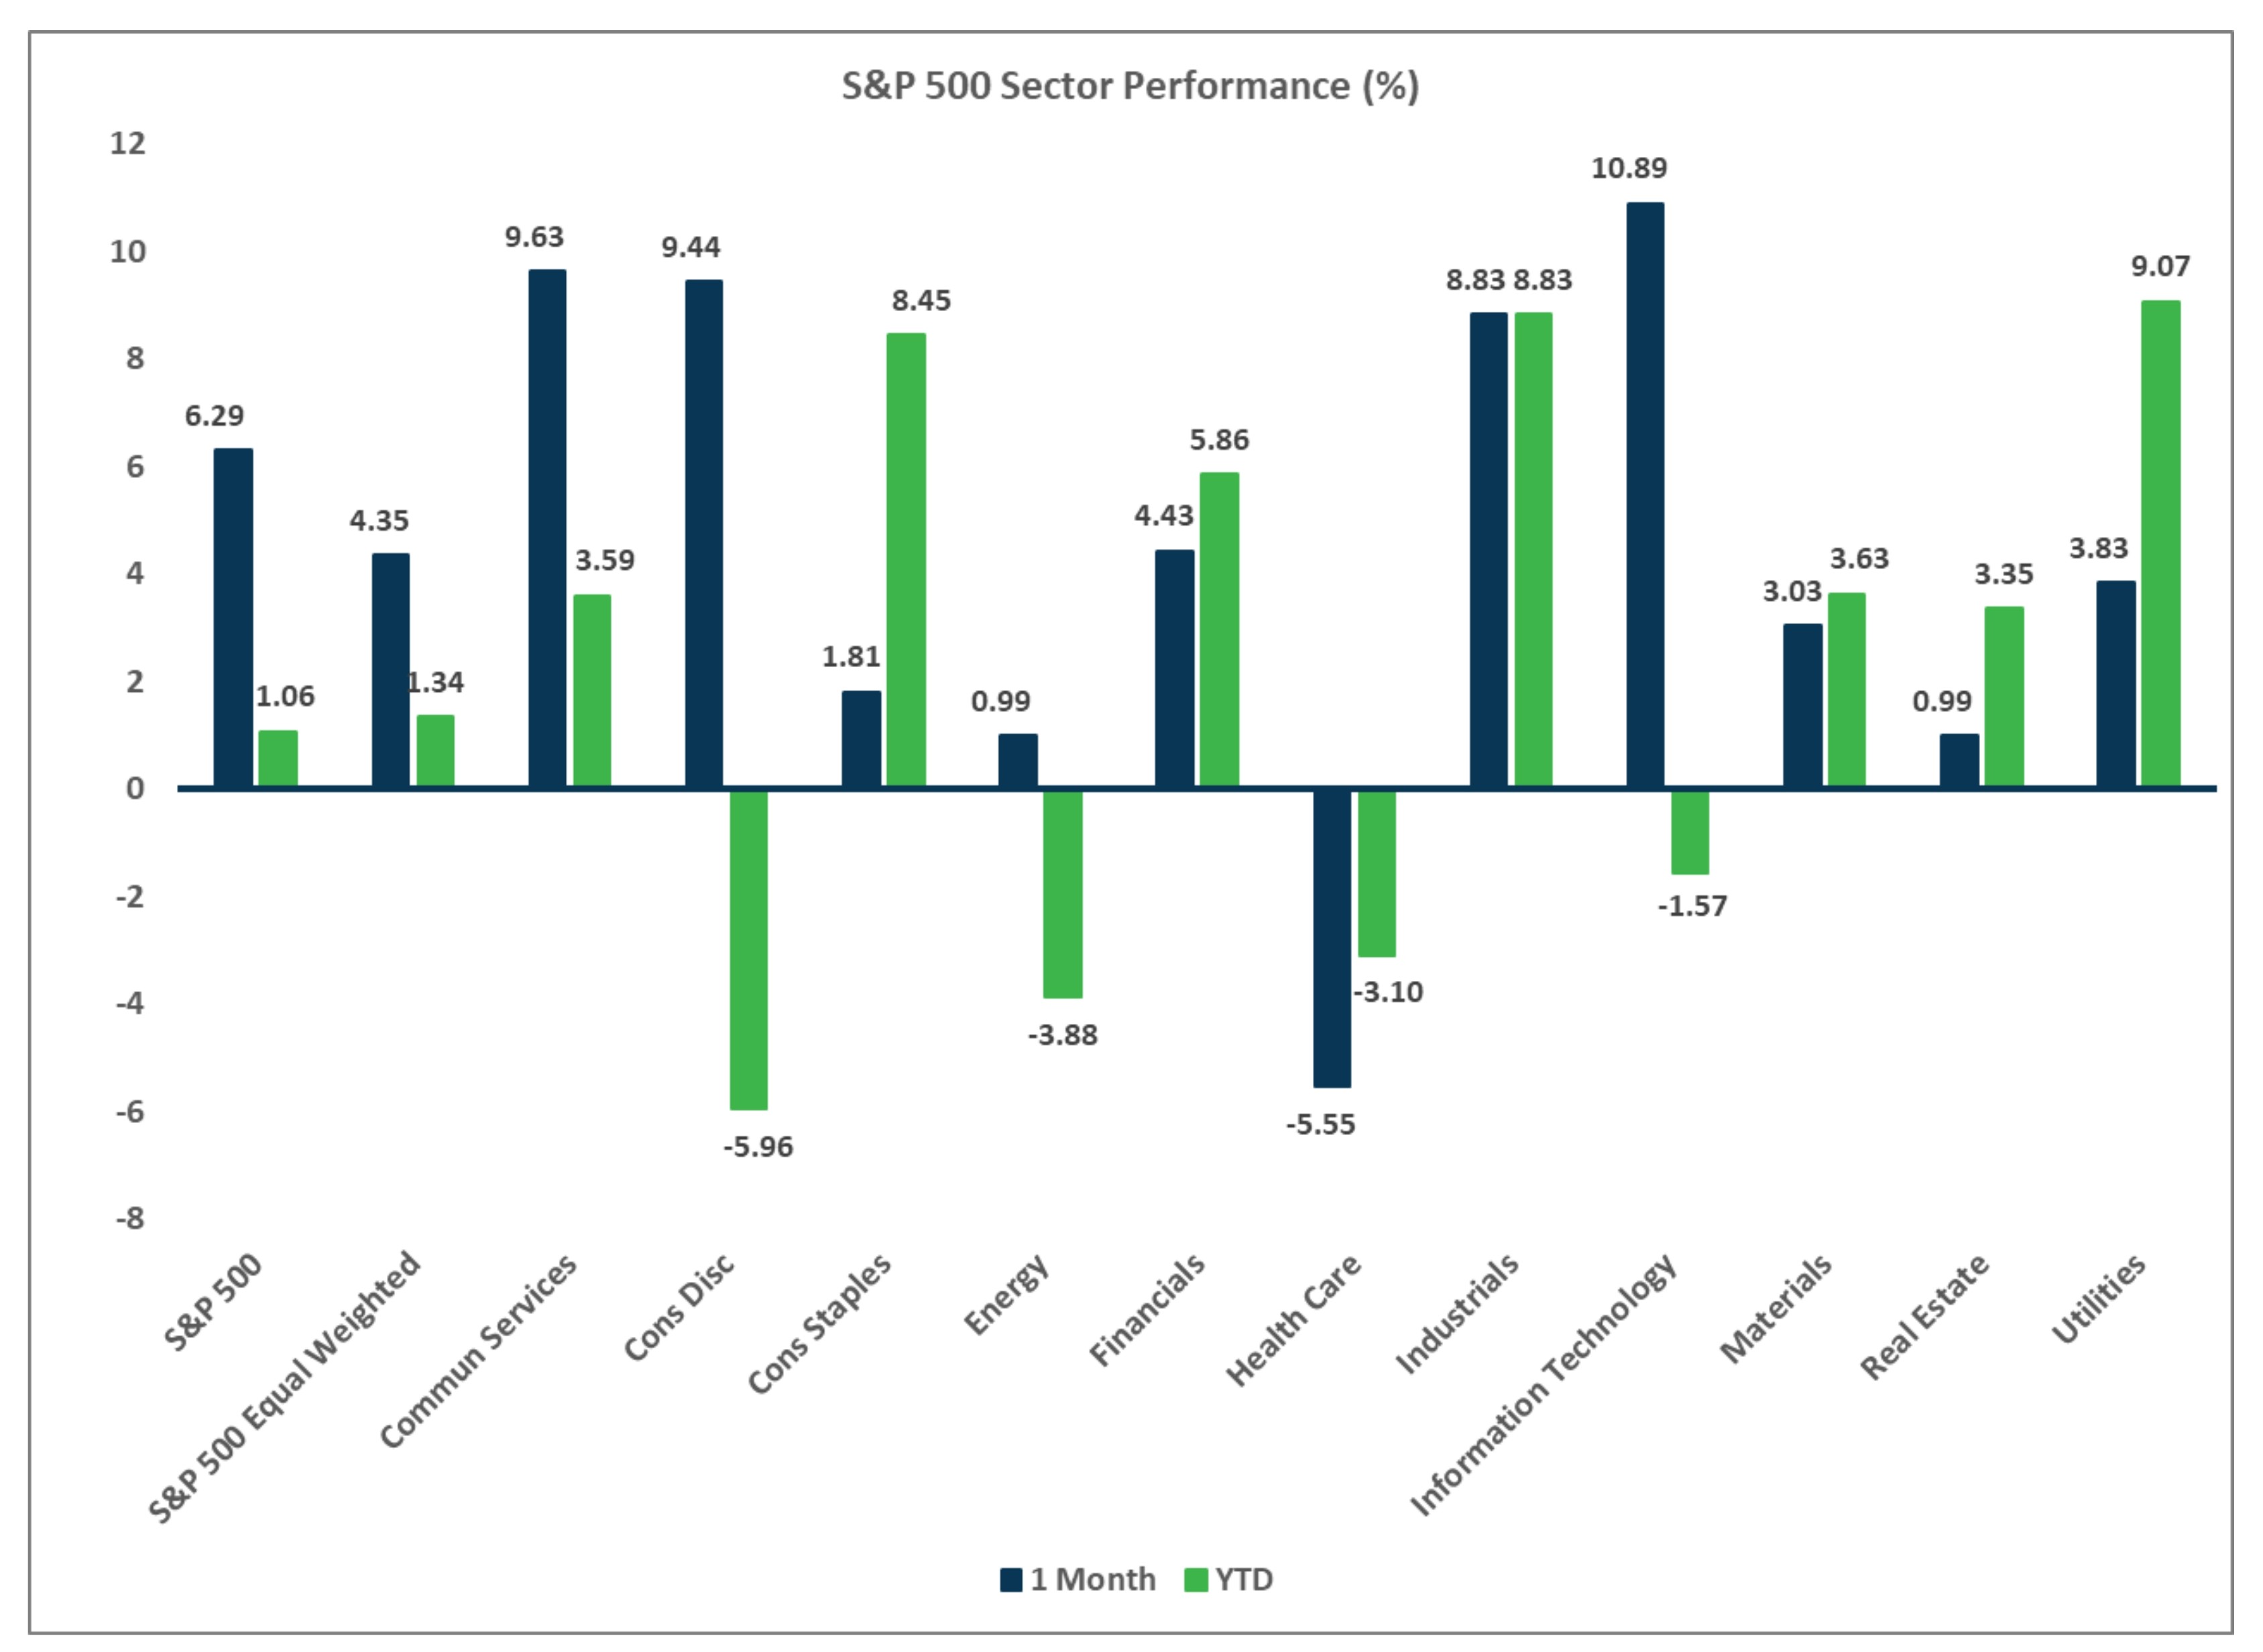
- U.S. equities posted a strong rebound in May, led by gains in large cap tech/growth stocks.
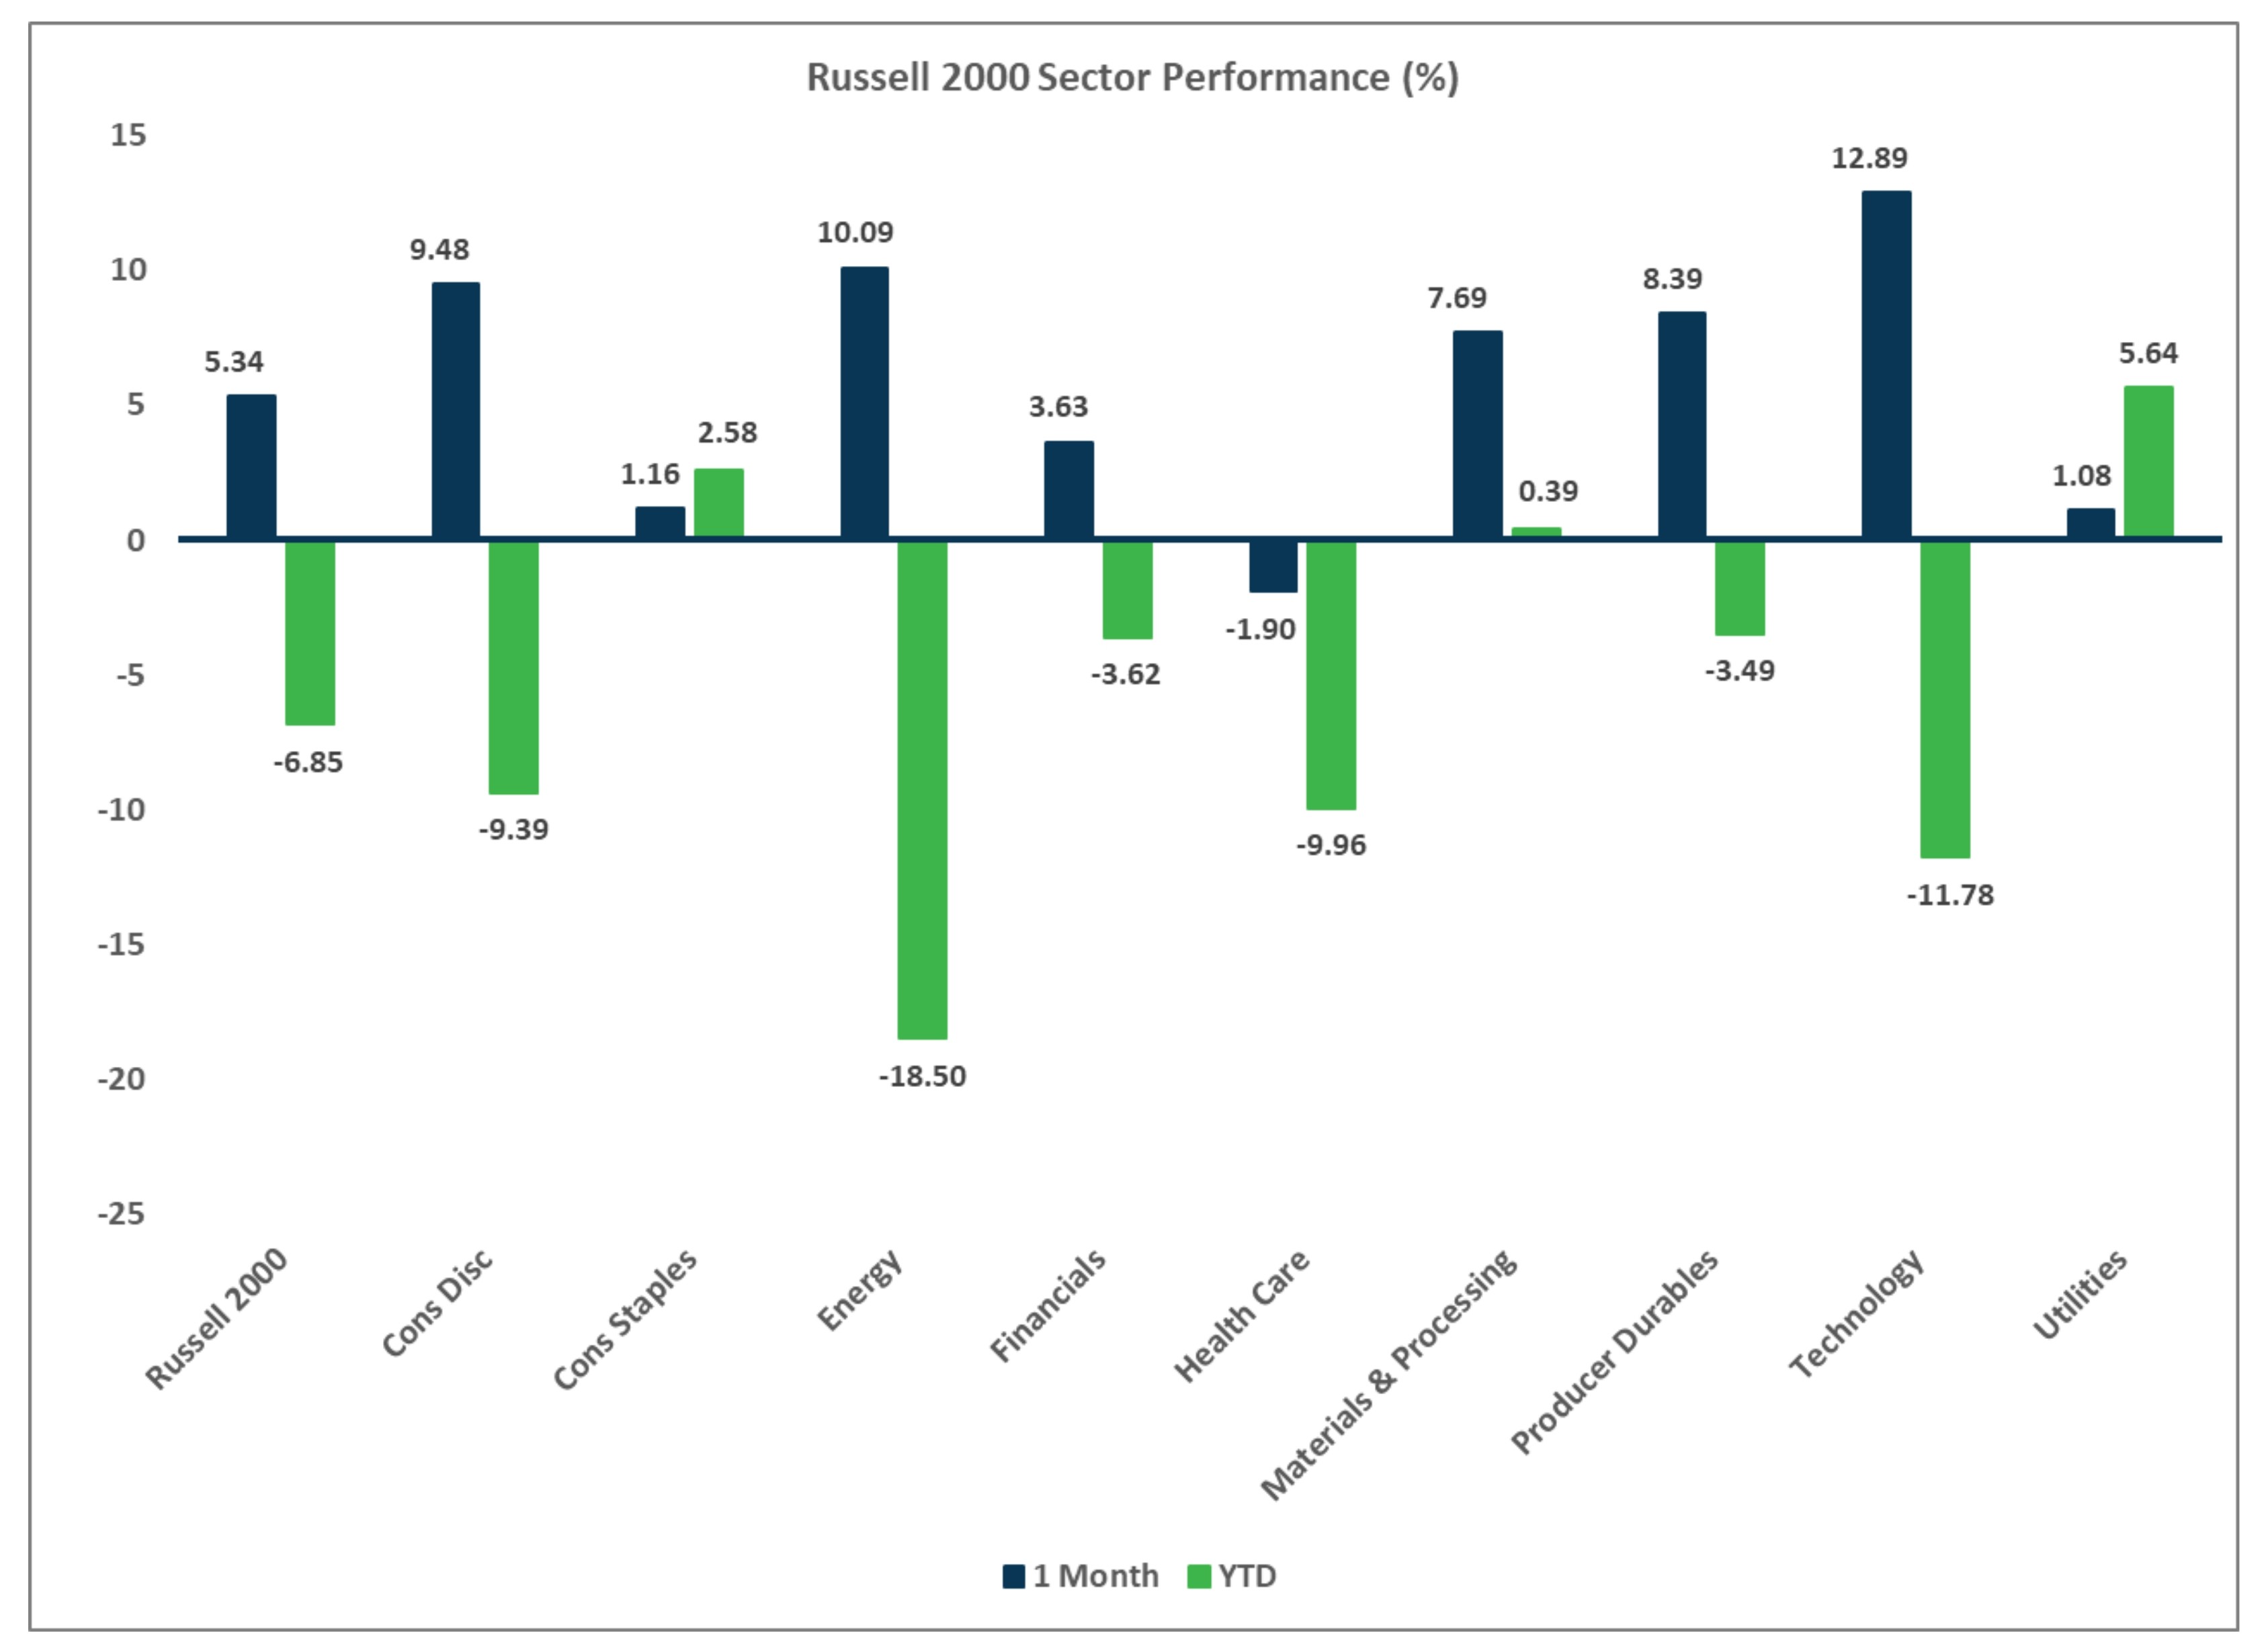
- Large caps beat small caps last month, and growth stocks trounced value stocks.
- Despite all the noise and volatility over the past few months, it is important to note that the S&P 500 is up 1% YTD. Small caps remain weak.
Non U.S. Equities
- Developed markets outside the U.S. gained 4.7% in May, driven by European equities.
- Unlike what occurred in the U.S., small caps outperformed large caps, but growth similarly beat value stocks. Europe bested Japan.
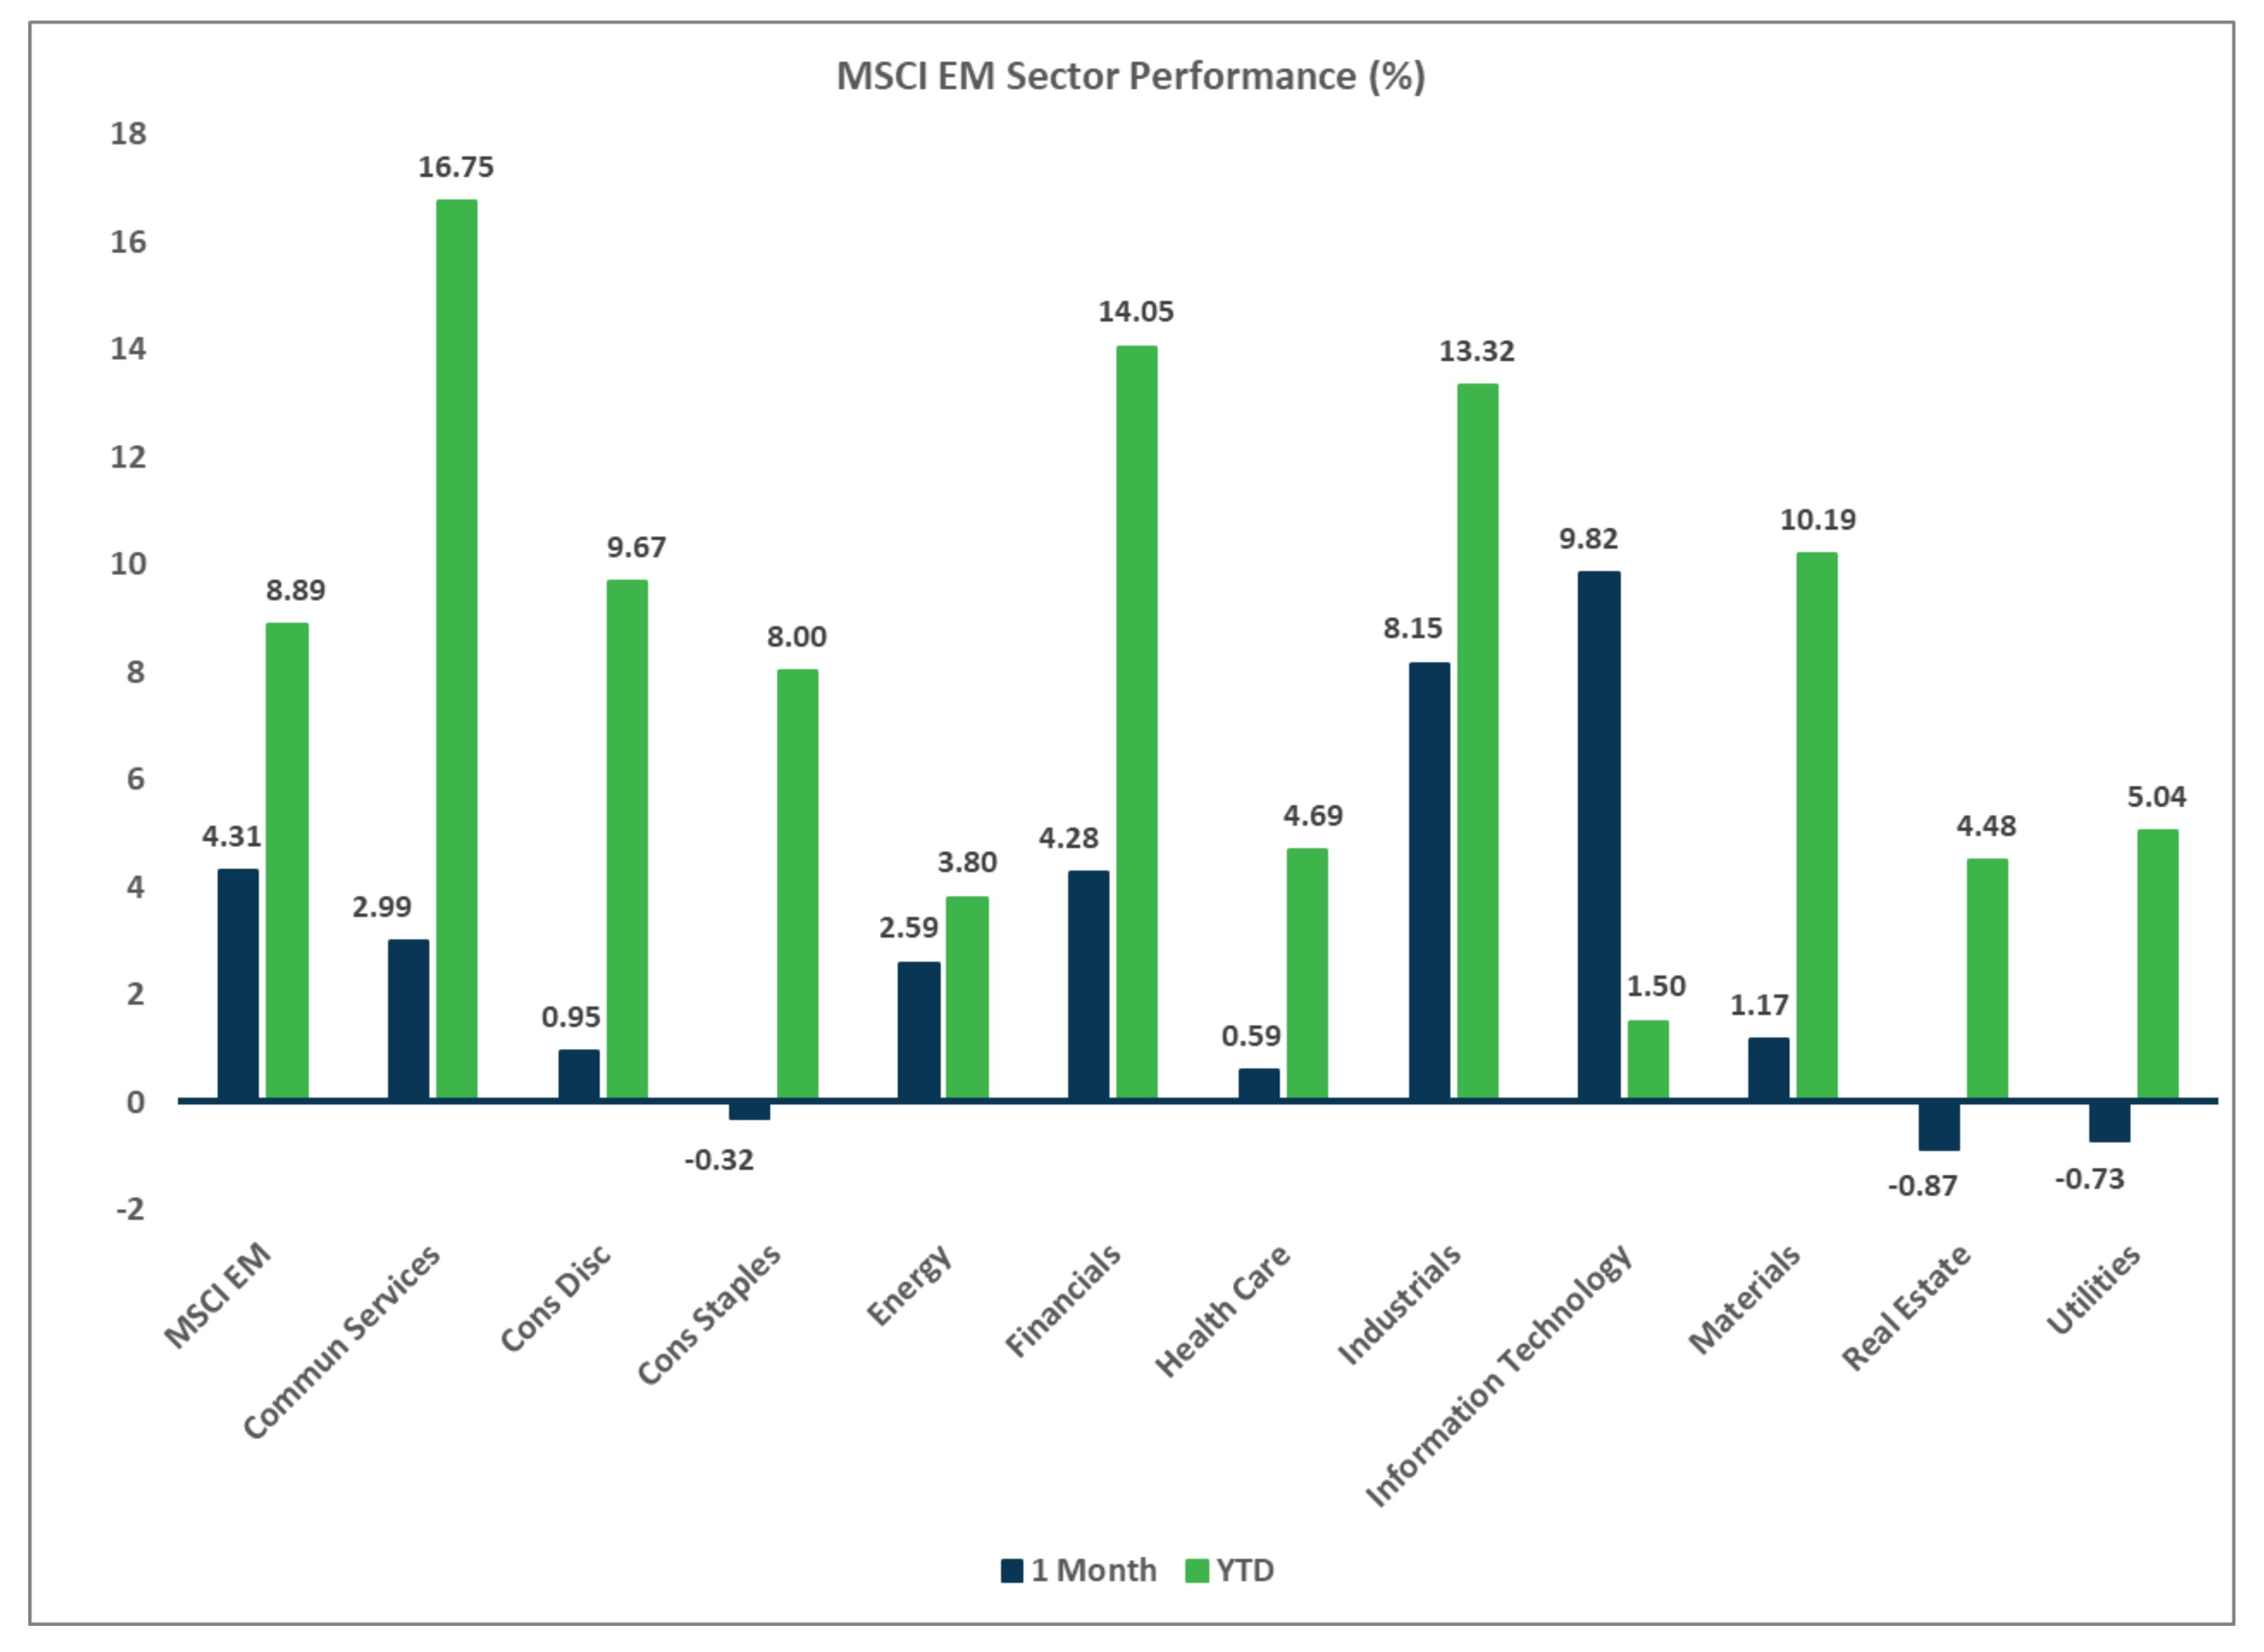
- Emerging markets (EMs) rose 4.3%, led by strength in Asia, ex-China and Eastern Europe. EM small caps also performed well.
- USD strength detracted 9 bps to EAFE returns but added 114 bps to EM returns.
Sector Performance - S&P 500 (as of 05/31/25)
Sector Performance - Russell 2000 (as of 05/31/25)
Sector Performance - MSCI EAFE (as of 05/31/25)
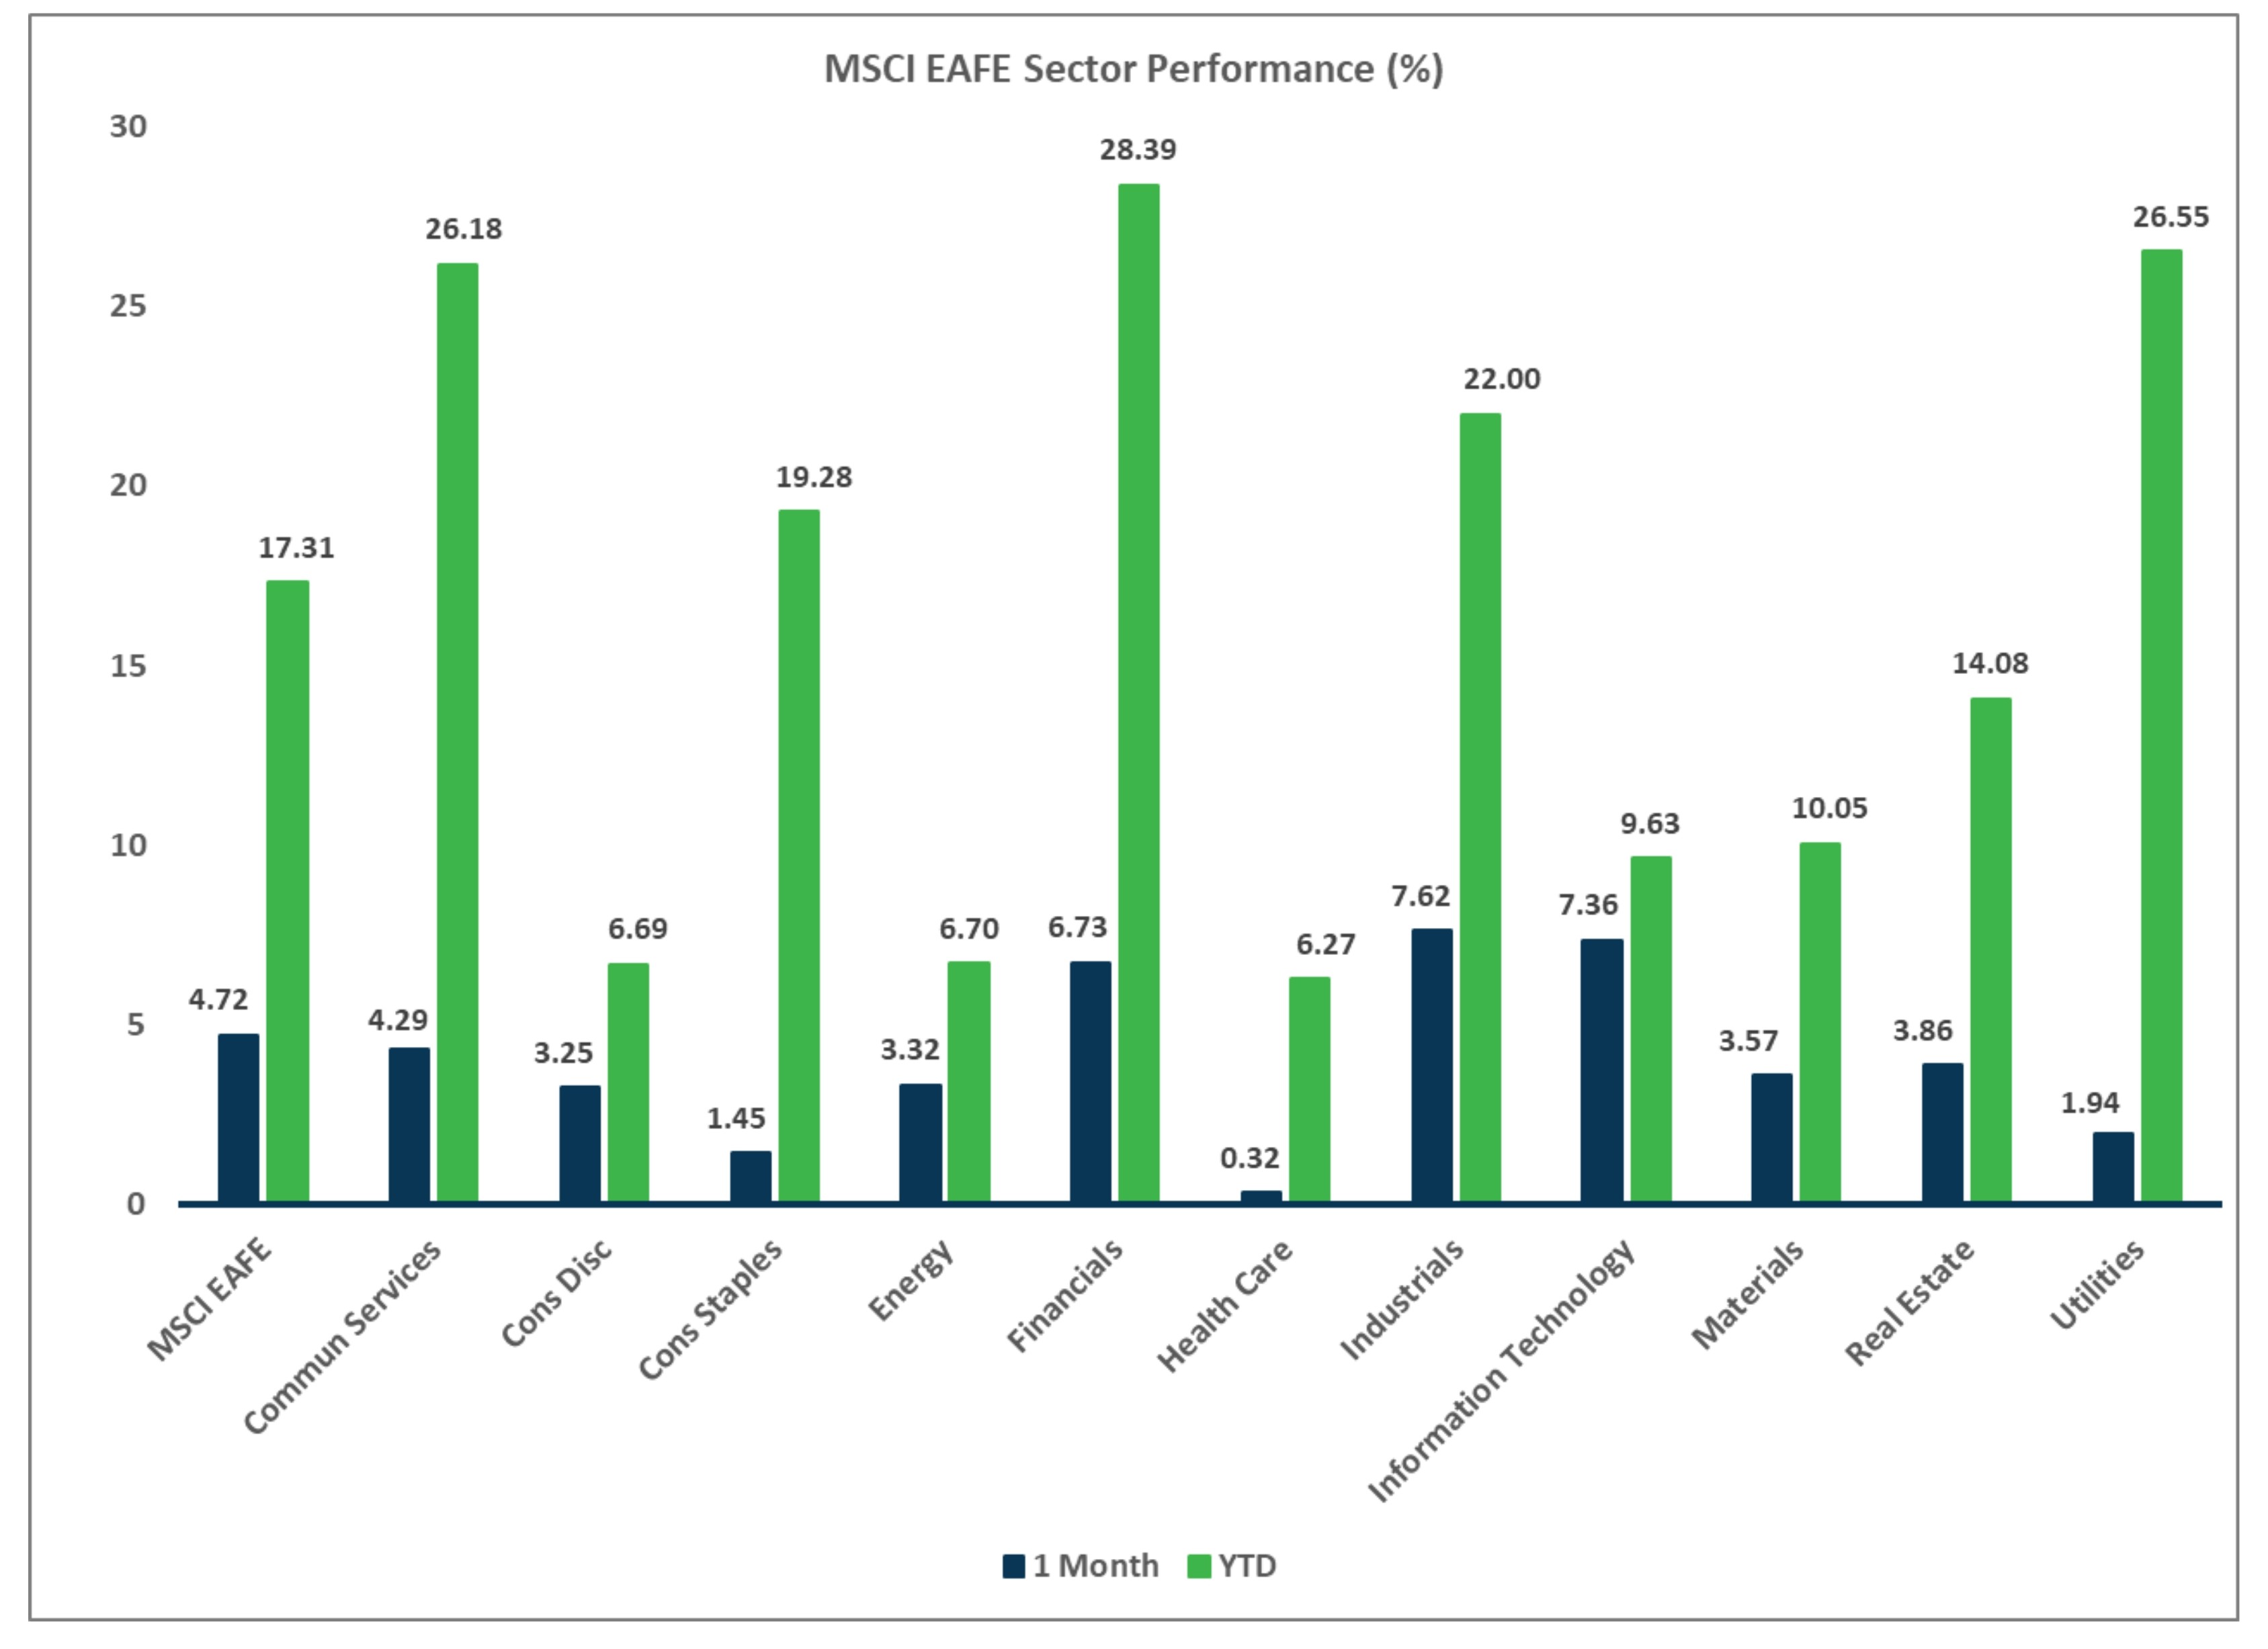
Sector Performance - MSCI EAFE (as of 05/31/25)