Market Flash Report | November 2022

Economic Highlights
United States
- Equity markets and other risk assets rocketed higher on November 10 after the October CPI reading came in “colder” than expected. The headline reading rose 0.4% M/M and 7.7% Y/Y, below the estimate of a 7.9% increase. Stripping out the volatile food and energy components, Core CPI rose 6.3% Y/Y, below the 6.5% expectation. A 2.4% decline in used vehicle prices helped bring down the inflation figures. Apparel prices fell 0.7% and medical care services were lower by 0.6%. Shelter costs, which make up one-third of the CPI, rose 0.8% for the month, the largest monthly gain since 1990, and +6.9% Y/Y, their highest annual level since 1982. Also, fuel oil prices jumped 19.8% higher for the month and are up 68.5% on a 12-month basis.
- The Core PCE Index, a gauge that excludes food and energy and is favored by the Federal Reserve, rose 0.2% M/M in October and 5% Y/Y. The gains also represent a deceleration from September, which saw a monthly increase of 0.5% and an annual gain of 5.2%. Headline PCE rose 0.3% M/M and 6% on an annual basis. Headline inflation also fell from September’s annual pace of 6.3%.
- The November employment report was red hot with job growth and wage growth exceeding expectations. Employers added 263,000 new jobs to the U.S. economy, well ahead of the 200,000 estimate. The unemployment rate held steady at 3.7% and the broader U6 unemployment rate fell slightly to 6.7%. The real problem was the surge in wages. Wages rose 0.6% M/M or 5.1% Y/Y, both figures were well ahead of estimates. The “hotter” than expected jobs report will potentially bring more hawkish Fed policy back into play after markets began pricing in an end to the current policy tightening cycle. A 50 bps rate hike is still expected at the December meeting, but an additional 25 bps rate hike was priced in after the report was released.
- U.S. manufacturing fell back into contractionary territory in November after expanding for 29 straight months. The ISM Manufacturing Index fell from 50.2 in October to 49.0 in November. The main sources of weakness were new orders, employment and prices. Demand eased and the manufacturing sector hit its lowest level since the COVID-19 pandemic began.
Non-U.S. Developed
- The eurozone economy grew 0.2% Q/Q in Q3 or 2.1% Y/Y. Major countries eked out slight growth, but the forecast looks bleak moving forward. November saw business activity fall across the eurozone for the fifth month running, according to flash PMI data. Business sentiment remained gloomy by historical standards, and demand continued to fall at a steep rate, leading to a pull-back in employment growth throughout the month. A further fall in business activity in November adds to the chances of the eurozone economy slipping into recession. So far, the Q4 data are consistent with GDP contracting at a quarterly rate of just over 0.2%.
- Japan's economy unexpectedly shrank for the first time in a year in Q3, stoking further uncertainty about the outlook as global recession risks, a weak yen and higher import costs took a toll on household consumption and businesses. Q3 GDP fell at annualized rate of 1.2% with private consumption growing 0.3% and corporate investment rising 1.5%. External factors were the big reason behind the negative growth. While exports expanded 1.9% from the previous three months, imports grew by 5.2% as higher energy costs and the weak yen pushed up the prices of products coming to Japan. The steeper import bill led to a decline in net exports, dragging GDP lower.
Emerging Markets
- The inevitable economic cost of Chinese cities forced to impose restrictions amid a surge in coronavirus cases has already started to appear. The official manufacturing PMI fell to 48 in November, down from 49.2 the prior month. November marked the second consecutive month of contraction and the lowest reading since April. The official non-manufacturing PMI, which measures business sentiment in the services and construction sectors, also fell to its lowest point since April after slowing to 46.7 in November from 48.7 in October.
- Weakness in PMIs, retail sales, property markets and industrial production point to a bleak economic picture across China. The government has attempted to stimulate the economy through interest/lending rate cuts and more traditional means such as infrastructure investment, but results remain bleak. Consumers are reigning in spending and there is only so much the government can do to continue propping up the troubled real estate market.
- An economic rebound in the world’s second largest economy may remain elusive for the foreseeable future until the government shifts its ‘zero COVID policy.’ China’s equity markets rallied sharply in November on the belief that the government will ease restrictions but the situation is fluid and uncertain.
- With uncertainty impacting China, other EM countries such as India, Indonesia, Mexico, Brazil and South Africa perhaps present better opportunities. Economic growth looks more compelling in most of these EM countries with cheaper valuations and better earnings growth. As investors consider shifting allocations away from unpredictable China, these other EM countries could be beneficiaries.
Market Performance (as of 11/30/22)
Fixed Income
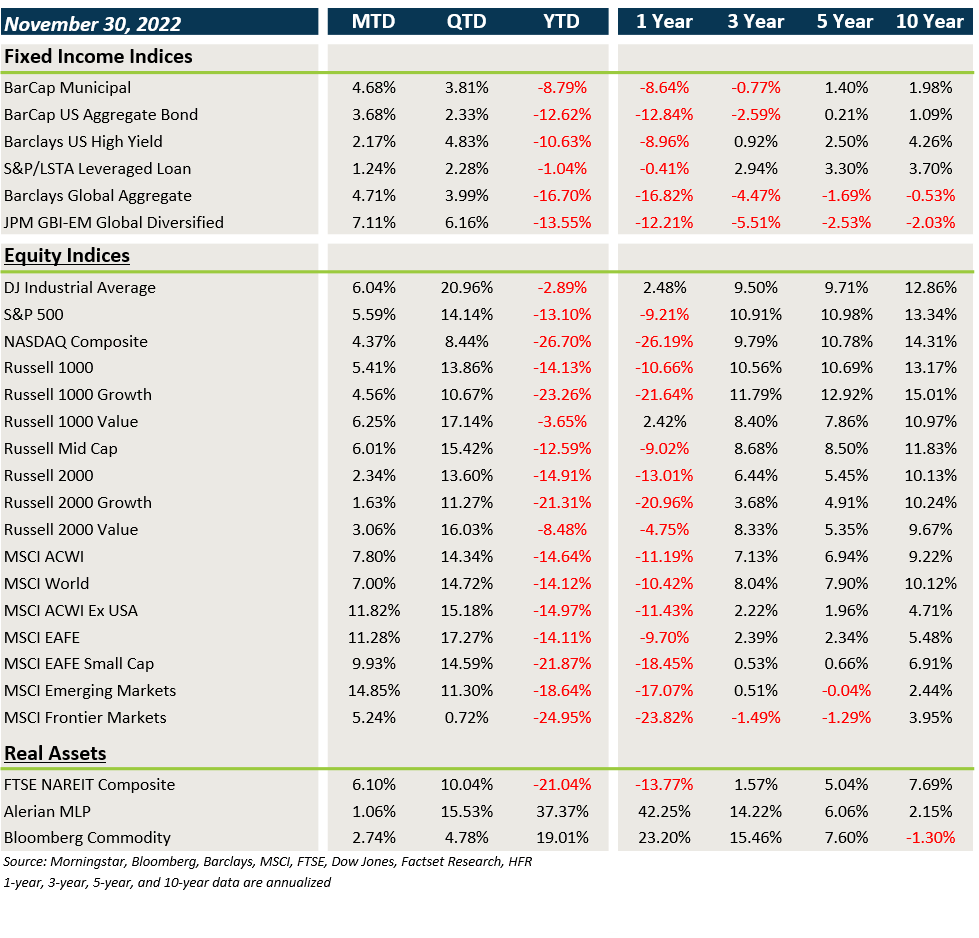
- Fixed income had a strong month as yields fell across the board and spreads tightened.
- The decline in Treasury yields was positive for core fixed income and municipal bonds.
- Credit spreads have tightened sharply in Q3, leading to positive gains in IG, HY, loans and EMD.
- USD weakness provided an added tailwind for non-U.S. assets.
U.S. Equities
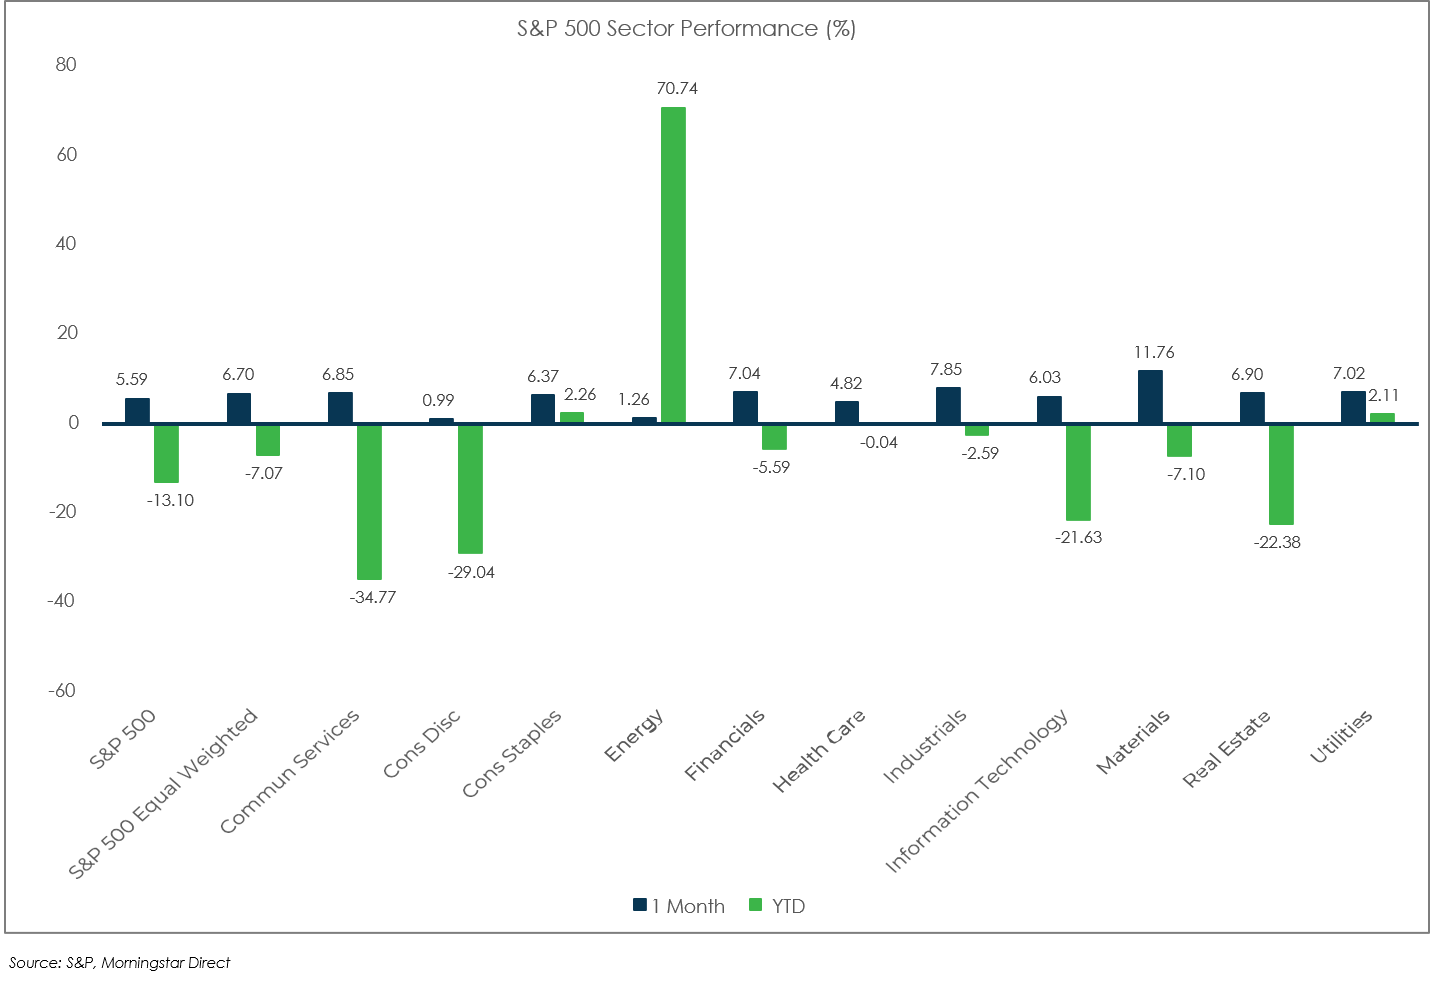
- Global equities surged higher in November, led by non-U.S. equities and value stocks.
- Value beat growth in the U.S. and large
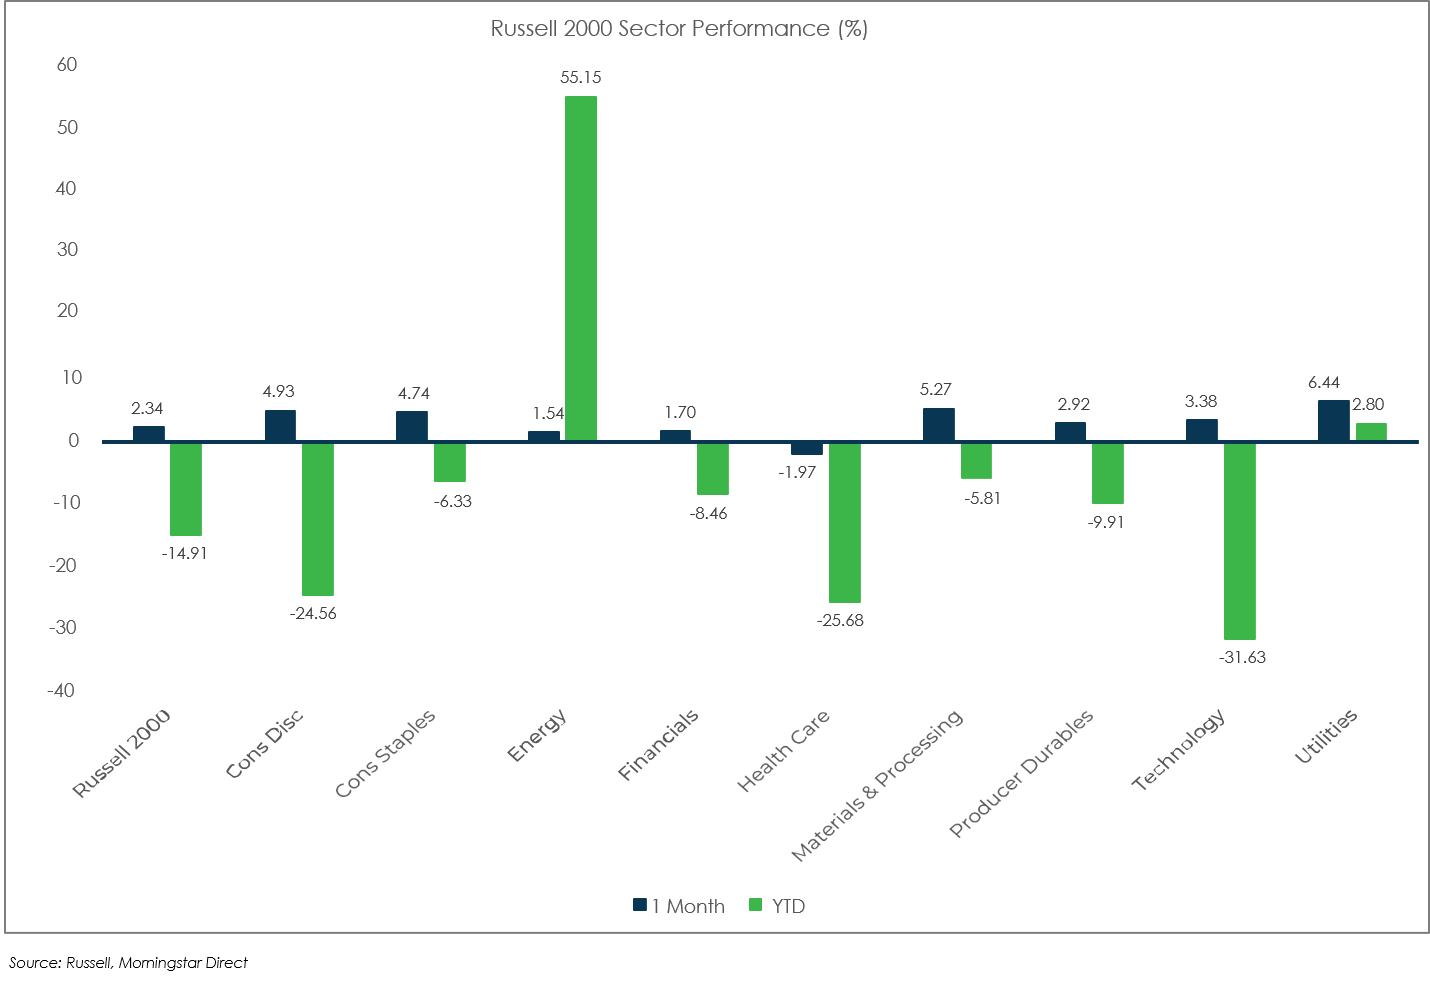
caps stocks trounced small caps. - The tech-heavy Nasdaq continues to lag YTD, but posted better performance in November.
Non-U.S. Equities
- Non-U.S. equities were the best performers last month, boosted by strong gains from China, Europe and large caps.
- Unlike the U.S., the EAFE Growth Index beat the EAFE Value Index.
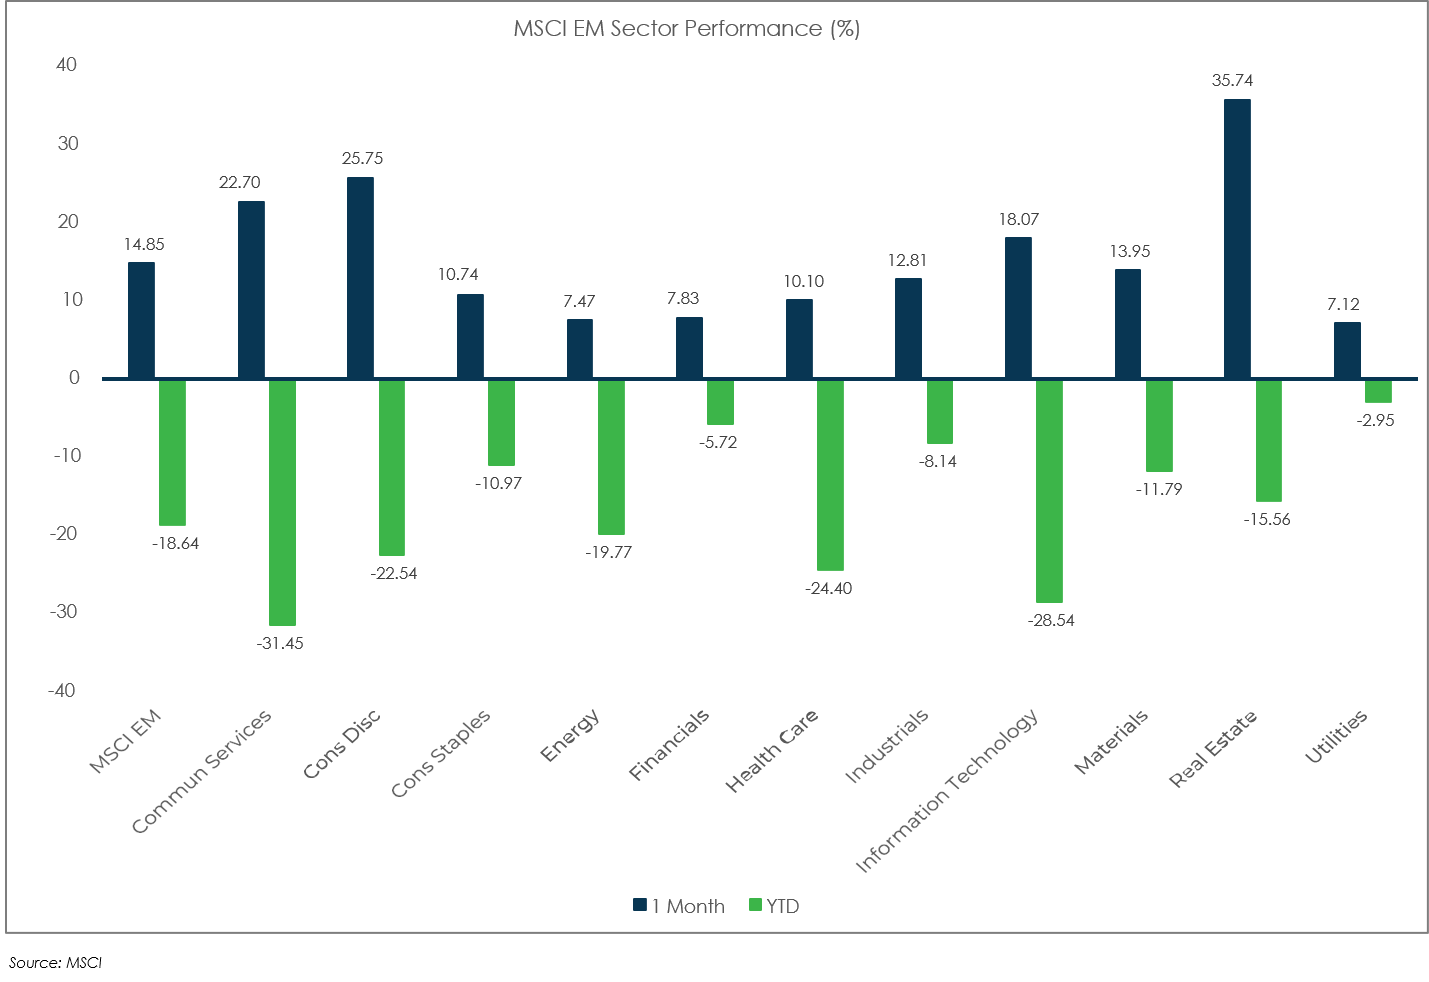
- Within EMs, large caps outperformed small caps and November returns were largely driven by the 29.7% rebound in China.
- The weaker USD boosted EAFE returns by 484 bps and EM returns by 315 bps.
Sector Performance
S&P 500 (as of November 30, 2022)
Russell 2000 (as of November 30, 2022)
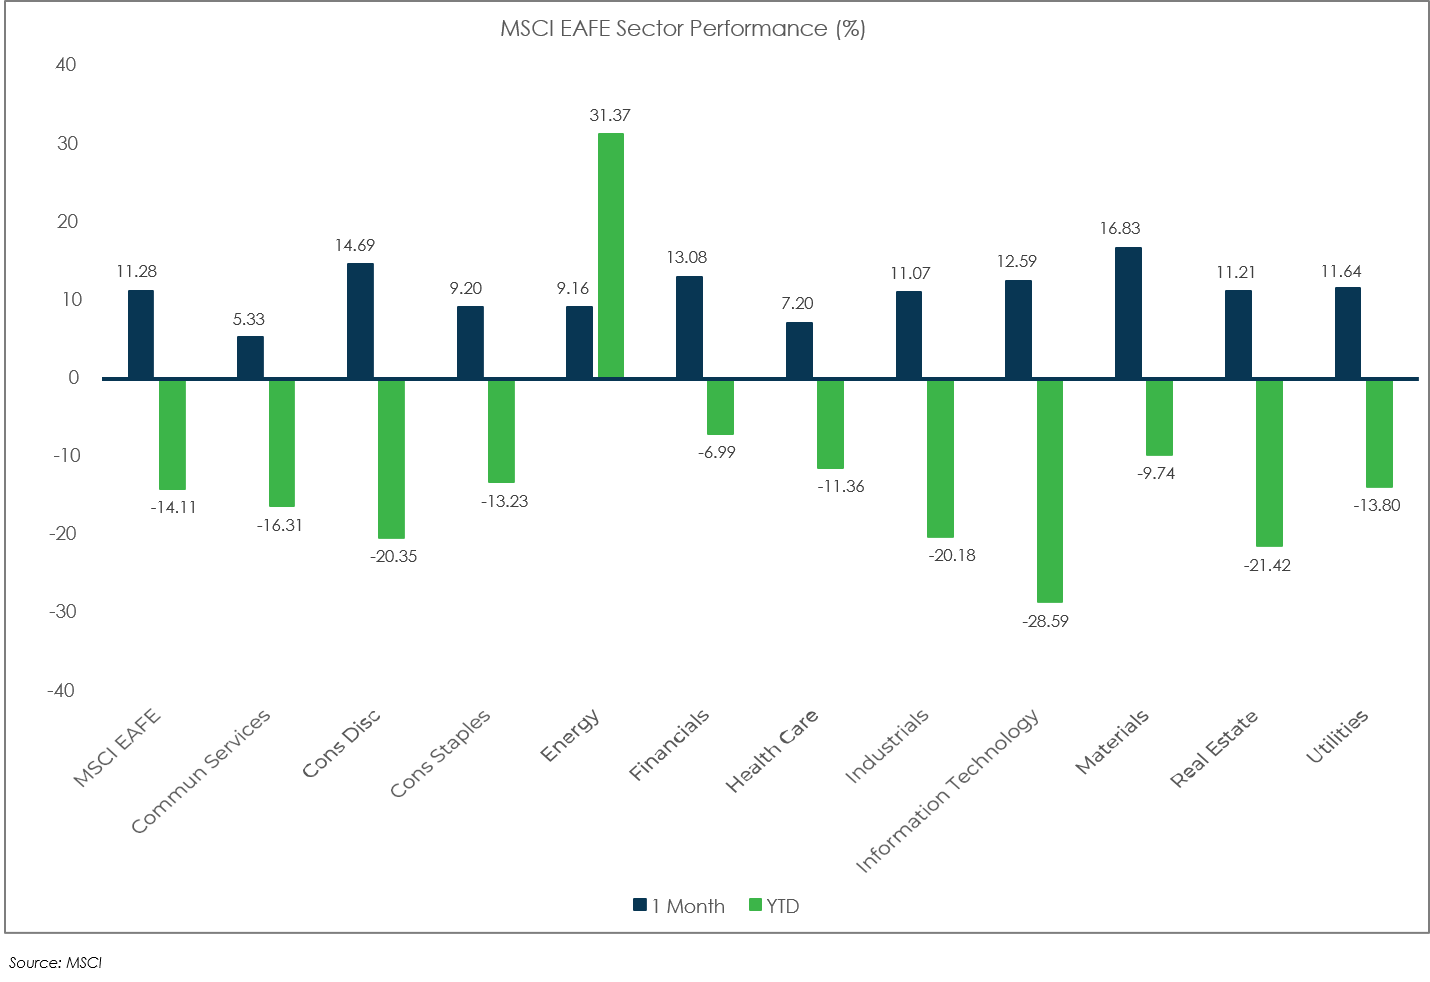
MSCI EAFE (as of November 30, 2022)
MSCI EM (as of November 30, 2022)