Market Flash Report | October 2023

Economic Highlights
United States
- U.S. employers added 336,000 new jobs to the economy in September, well ahead of the 170,000 estimate. The unemployment rate held steady at 3.8%, slightly ahead of the 3.7% forecast. Wage increases, however, were softer than expected, with average hourly earnings up 0.2% for the month and 4.2% from a year ago, compared to respective estimates for 0.3% and 4.3%. Service-related industries contributed 234,000 to the total job growth, while goods-producing industries added just 29,000. The previous two months saw substantial upward revisions. August’s gain is now 227,000, up 40,000 from the prior estimate, while July moved to 236,000, from 157,000. Combined, the two months were 119,000 higher than previously reported.
- The U.S. economy grew at a better-than-expected rate of 4.9% in Q3, up from a 2.1% pace in Q2. The sharp increase came due to contributions from consumer spending, increased inventories, exports, residential investment and government spending. Consumer spending, as measured by personal consumption expenditures, increased 4% for the quarter after rising just 0.8% in Q2, and was responsible for 2.7% of the total GDP increase. Inventories contributed 1.3%. Gross private domestic investment surged 8.4% and government spending and investment jumped 4.6%. Inventory gains are likely a one-time event and signs of slowing by consumers and businesses may negatively impact Q4 growth. Q4 GDP estimates are in the 1.5-2% range.
- Prices increased at a faster-than-expected pace in September, keeping inflation in the spotlight for the Federal Reserve. Headline Consumer Price Index (CPI) increased 0.4% M/M in September or 3.7% Y/Y. Core CPI increased 0.3% M/M and 4.1% Y/Y, both in line with expectations. In keeping with recent trends, shelter costs were the main factor in the inflation increase. The index for shelter, which makes up about one-third of the CPI weighting, accelerated 0.6% M/M and 7.2% Y/Y. The Fed’s preferred inflation gauge, the Personal Consumption Expenditures (PCE) Index, has posted slightly lower readings over the past few months.
- Manufacturing activity in the U.S. slowed further in October based on the ISM Manufacturing PMI (Purchasing Managers’ Index). The headline reading of 46.7 was down from 49.0 in September. New orders, production and employment all slowed last month.
Non-U.S. Developed
- In the eurozone, things are moving from bad to worse. Manufacturing has been in a slump for sixteen months, services for three, and both PMI headline indices just took another hit. In addition, all subindices point very consistently downwards, too, with only a few exceptions. Overall, this points to another lackluster quarter, and we wouldn’t be surprised to see a mild recession in the eurozone in the second half of this year, with two back-to-back quarters of negative growth.
- According the Eurostat data, eurozone GDP fell by 0.1% in Q3, slightly worse than expectations. This highlights how Europe’s economy is being held back by high interest rates, the cost-of-living crisis, and weaker demand from the global economy. Belgium, Spain and France posted positive growth while Ireland, Austria and Germany posted negative results.
- The Japanese economy has been one of the biggest surprises over the past few quarters compared to other developed markets, and the government expects that momentum to continue in Q4. It expects the economy to see moderate growth in the short term, but pointed to downside risks from aggressive monetary tightening in overseas economies and a slowdown in China.
Emerging Markets
- China’s economic recovery continues to be bumpy with more calls for government stimulus. The official manufacturing PMI dropped to 49.5 in October from 50.2 in September. The non-manufacturing PMI, which covers the services and construction industries, fell to 50.6 this month, the lowest level since China lifted its COVID-19 restrictions in December 2022.
- China’s economy is grappling with mounting challenges, ranging from weak consumer spending and a deepening property crisis to subdued global demand. The unexpected decline of the manufacturing PMI shows the recovery in China is a bumpy road, as domestic demand is still quite weak. Manufacturing accounts for ~28% of GDP. The drop in the non-manufacturing PMI suggests that the pent-up demand for travel and gatherings diminished quickly after the Golden Week holiday.
- Chinese policymakers have unveiled a raft of measures after a rapid loss of economic momentum following a brief post-COVID rebound, including modest interest rate cuts, increased cash injections and more aggressive fiscal stimulus. Additional reserve requirement ratio cuts may be necessary in the coming months along with a potential lift to the budget deficit target of 3% for more stimulus.
- The International Monetary Fund (IMF) recently cuts its forecast for Chinese growth in 2023 and 2024. 2023 growth was cut by 0.2% to 5.0% and 2024 growth was cut by 0.3% to 4.2%. The IMF cited the property crisis and weak external demand. The IMF also indicated that growth projections could be cut by as much as 1.6% if the property crisis deepens further.
Market Performance (as of 10/31/23)
Fixed Income
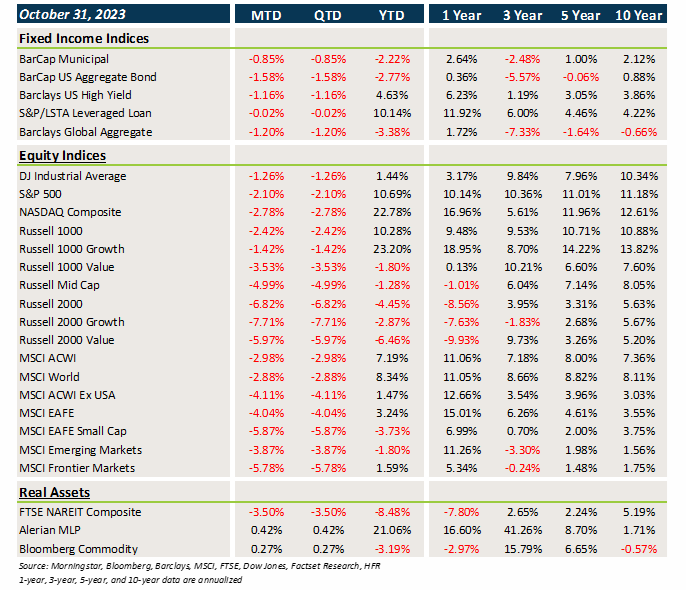
- Treasury and other sovereign debt yields continued their trek higher in October, leading to losses in core fixed income and municipal bonds.
- Credit did not fare much better, as spreads finally began to widen with the economic and geopolitical uncertainty.
- USD strength has been a major headwind for non-U.S. assets over the past few months, but the currency translation was largely flat in October.
U.S. Equities
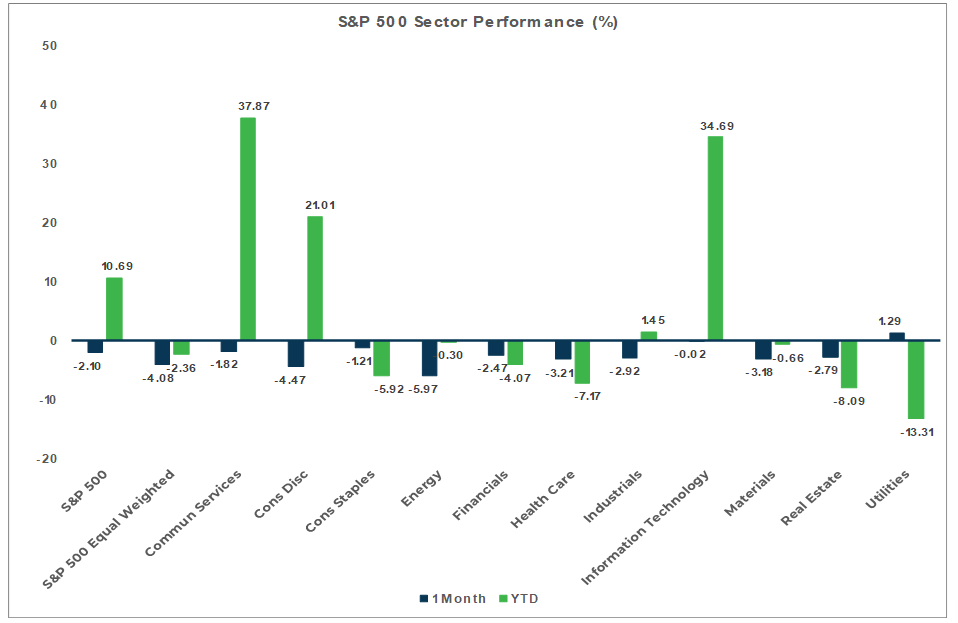
- U.S. equities finished October with losses on the heels of geopolitical uncertainty and higher volatility.
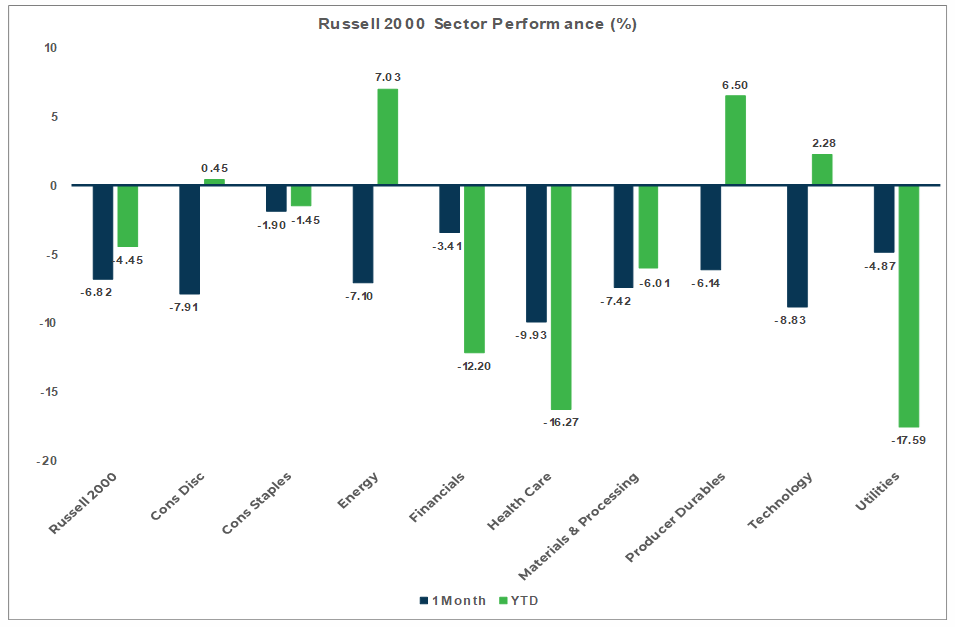
- Small caps were hit particularly hard by uncertainty over U.S. growth and the impact of higher interest rates.
- Large caps beat small caps and growth led value within large caps. Value outperformed within small caps.
Non-U.S. Equities
- Non-U.S. equities lagged U.S. equities last month with weakness coming from both Europe and Japan.
- Growth beat value outside the U.S., and small caps trailed large caps within EAFE markets.
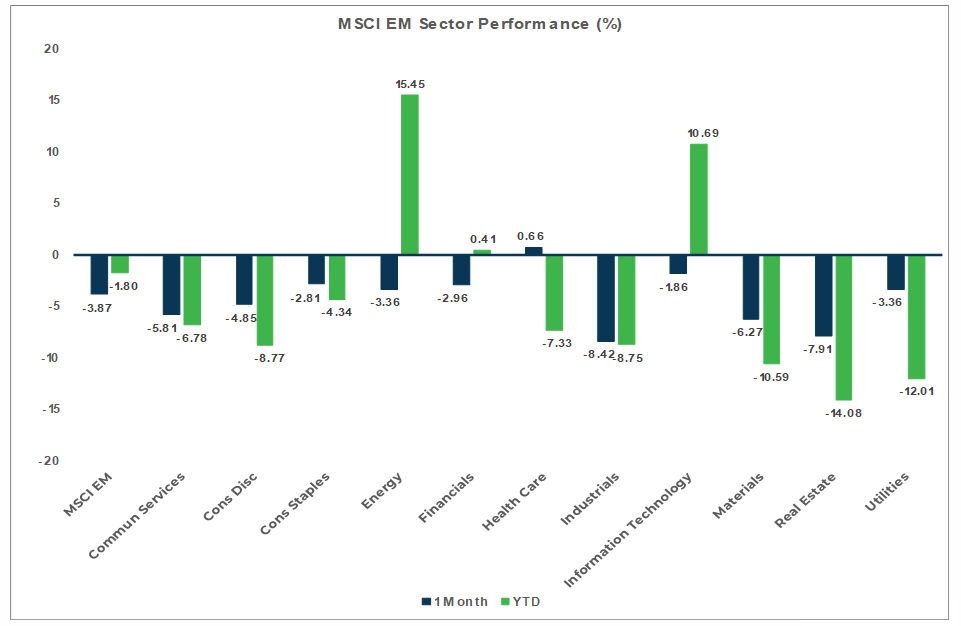
- EMs were weak in October, with broad based losses from all major regions and market caps.
- The USD played a minimal role in returns last month.
Sector Performance - S&P 500 (as of 10/31/23)
Sector Performance - Russell 2000 (as of 10/31/23)
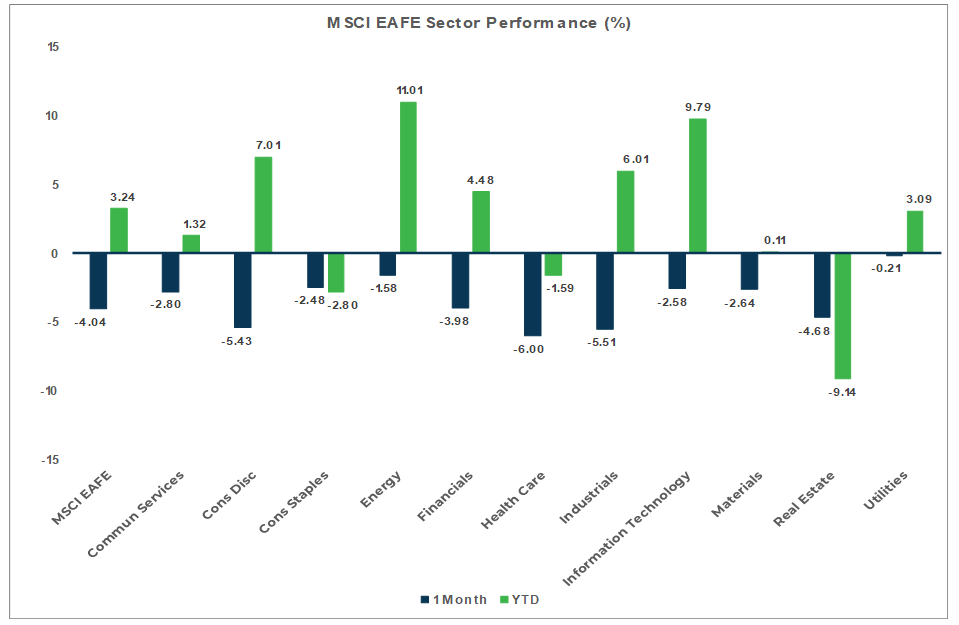
Sector Performance - MSCI EAFE (as of 10/31/23)
Sector Performance - MSCI EM (as of 10/31/23)