Market Flash Report | September 2023

Economic Highlights
United States
- The August jobs report showed some cooling, but still exceeded expectations. 187,000 new jobs were added to the U.S. economy last month, but the unemployment rate increased from 3.5% to 3.8%. The broader U6 unemployment rate surged 0.4% in August to 7.1% in September. Average hourly earnings increased 0.2% M/M or 4.3% Y/Y. For September, economists expect 150,000 new jobs added to the economy and an unemployment rate of 3.7%. Q3 GDP is also due towards the end of October and the Atlanta Federal Reserve currently projects growth of 4.9%. At its September meeting, the Fed held steady on interest rates, but sharply raised its forecast for economic growth in 2023 and 2024. It does not expect a recession any time soon, but may be behind the curve.
- Personal consumption expenditures (PCE), the Fed’s preferred inflation gauge, increased 0.4% in August or 3.5% over the past year. Headline inflation has been creeping higher in recent months after hitting 3.2% in June. Core PCE increased 0.1% M/M in August or 3.9% Y/Y. Core PCE was the first sub-4% Y/Y reading in nearly two years and a decrease from the 4.3% July reading. August inflation was largely driven by energy costs, which accelerated 6.1%. Food prices increased 0.2%. On an annual basis, energy was down 3.6% while food increased 3.1%.
- Retail sales in the U.S. advanced 0.6% M/M in August 2023, higher than a downwardly revised 0.5% rise in July and beating forecasts of a 0.2% advance. The data continues to point to robust consumer spending despite high prices and borrowing costs. The increase was largely driven by spending at gas stations, which advanced 5.2% last month. Excluding sales at gasoline stations, retail spending advanced a more modest 0.2% in August from July. Retail spending increased across most categories, including at restaurants and grocery stores.
- The U.S. manufacturing sector gained some steam in September, but remains in contraction territory. The ISM Manufacturing PMI rose to 49.0 (from 47.6) on the heels of strength in production and employment as well as new orders.
Non-U.S. Developed
- The eurozone private sector remained in contraction at the end of the third quarter as waning demand led to a further decline in activity. The overall reduction in output was again led by manufacturing, but the service sector saw activity decrease for the second straight month. Despite the weak demand environment, input costs continued to rise sharply, and the rate of inflation picked up from August. The headline composite PMI was 47.1 in August, with services sitting at 48.4 and manufacturing at 43.4. Based on this data, an economic contraction in Q3 is looking more likely.
- Annual inflation in the eurozone cooled to its lowest level since October 2021, falling to 4.3% in September. That was down from a 5.2% annual reading in August, while month-on-month inflation dipped from 0.5% to 0.3%. Core inflation dropped to 4.5% Y/Y in September from 5.3% in August.
- Japan’s economy expanded at a slower pace than initially estimated in Q2 as businesses and consumers pulled back more than expected. GDP grew at an annualized 4.8% from the previous three months, with the expansion almost entirely reliant on overseas demand. This was a smaller gain than the preliminary reading of 6% and came in well below economists’ forecast of 5.6%. Capital investment was revised down to a 1% decline in Q2 and private consumption fell 0.6% versus the initial -0.5% estimate.
Emerging Markets
- According to the National Bureau of Statistics, activity in services and construction also accelerated last month, according to a separate index that hit 51.7 its best level in three months. The smaller-company focused Caixin China Manufacturing PMI slipped a bit to 50.6 in September from 51.0 in August.
- The Caixin China General Service PMI dropped to 50.2 in September 2023 from 51.8 in the previous month, pointing to the softest increase in services activity since the start of the year, as both business activity and new orders grew the least in 2023. China’s official services PMI rose slightly last month to 51.7 from 51.0 in August. Industrial production also increased 4.5% in August from a year earlier, accelerating from the 3.7% growth registered in July. Retail sales rose 4.6% in August, the fastest growth since May.
- While many global investment banks have ratcheted down their economic growth forecasts for China in recent months, the International Monetary Fund still believes 5% growth is achievable this year. In addition, the World Bank cut its 2024 forecast for China GDP growth to 4.4% from 4.8%, citing persistent difficulties such as elevated debt, the property market crisis and an aging population.
Market Performance (as of 9/30/23)
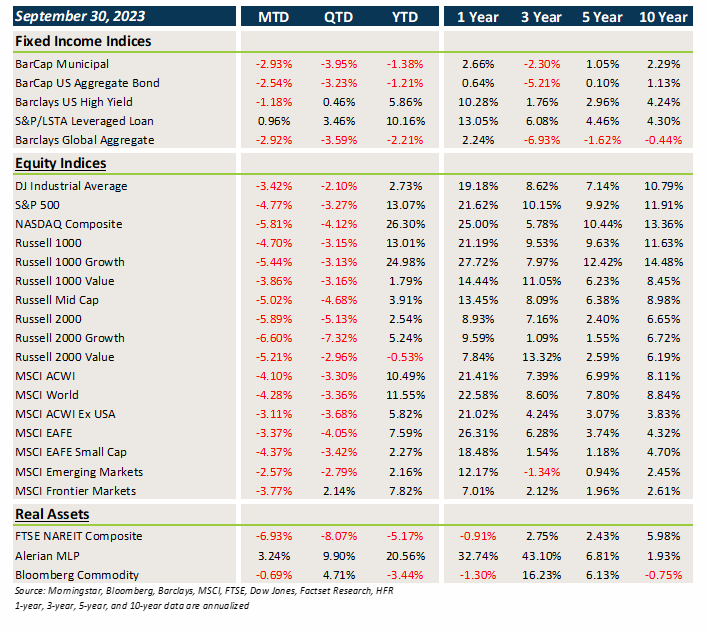
Fixed Income
- Core fixed income and municipal bonds posted losses last month in the face of rising rates. Treasuries, sovereign bonds and munis are now all negative YTD.
- Loans bucked the trend in September, but high yield and emerging market debt fell in value. Higher carry in credit has helped offset the impact of higher rates.
- Bonds outside the U.S. were also hurt by the strong rebound of the U.S. dollar.
U.S. Equities
- September was a weak month for U.S. equities, particularly growth/tech stocks that are considered long-duration assets.
- Value outperformed growth across all market caps and small caps broadly lagged large caps.
- Growth continues to lead value by a wide margin in 2023.
Non-U.S. Equities
- Non-U.S. equities posted negative absolute returns last month, but provided some modest relative outperformance versus U.S. equities.
- Value sharply beat growth and small caps lagged large caps in September.
- USD strength was a sharp headwind with a 234 bps impact on the EAFE Index and 82 bps on the EM Index.
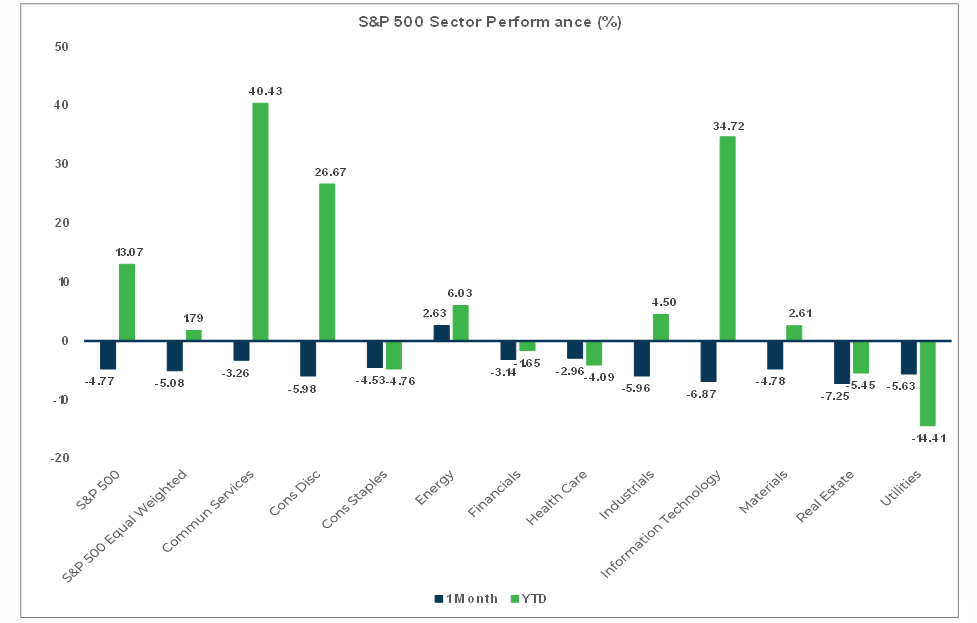
Sector Performance - S&P 500 (as of 9/30/23)
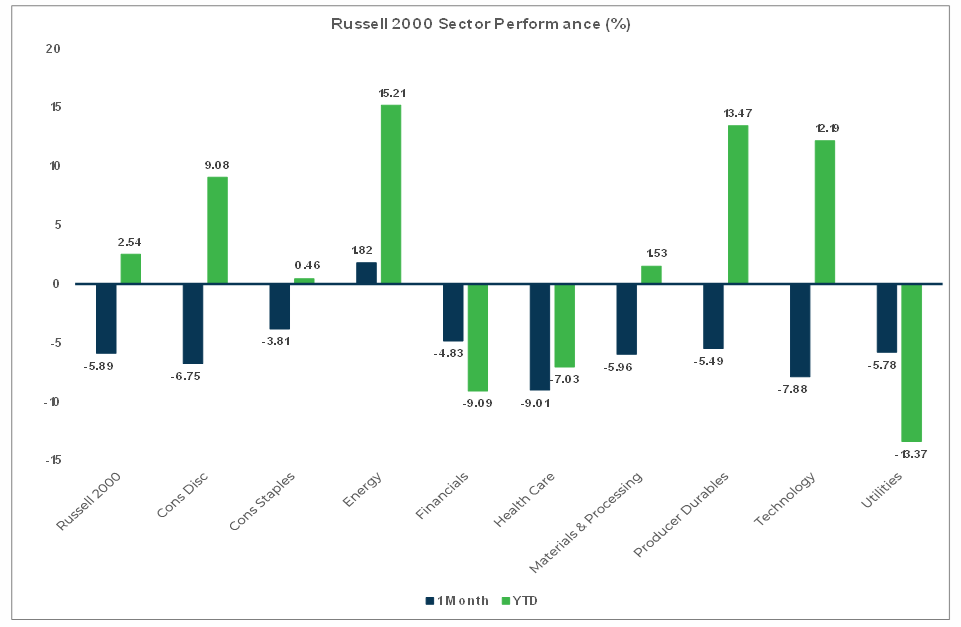
Sector Performance - Russell 2000 (as of 9/30/23)
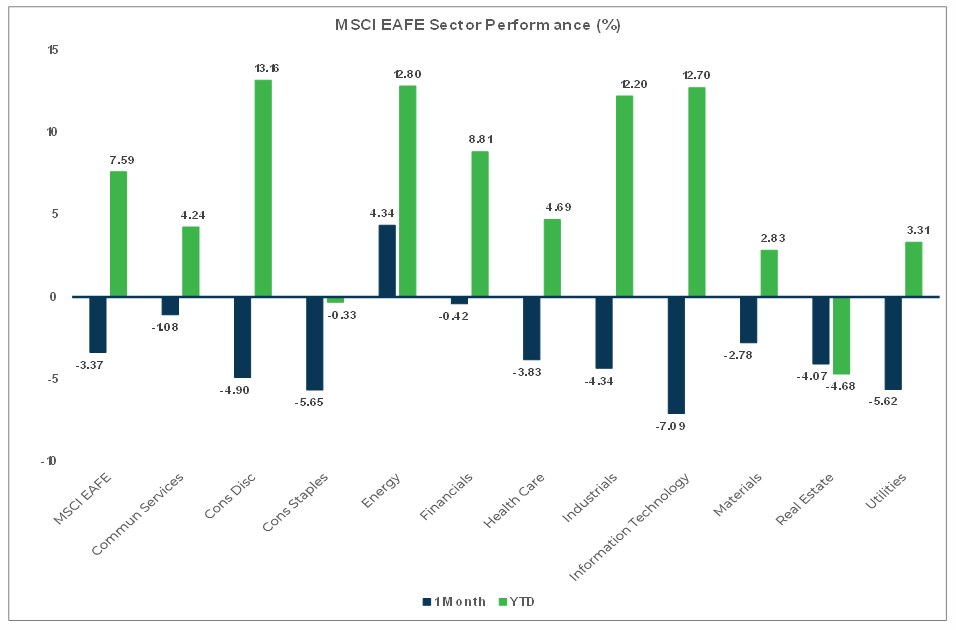
Sector Performance - MSCI EAFE (as of 9/30/23)
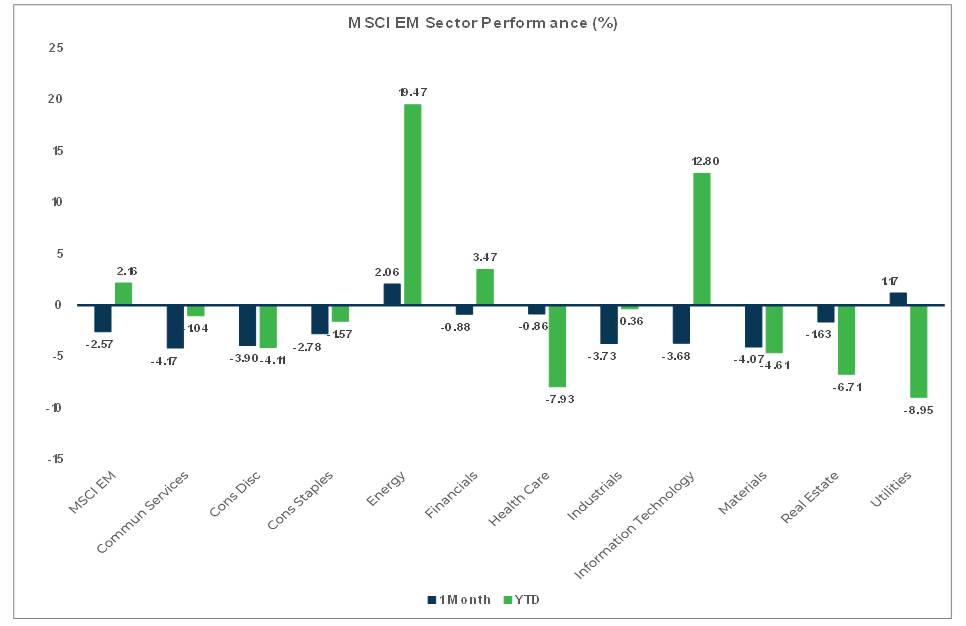
Sector Performance - MSCI EM (as of 9/30/23)