
April 2026 Market Update

Economic Highlights
United States
- First quarter GDP in the U.S. grew 2% Y/Y, well ahead of the 0.5% rate reported in Q4 of 2025, but the reading slightly missed Wall Street expectations. The main contributors to the rise in GDP in Q1 were investment, exports, consumer spending and government spending. Imports increased in the first quarter. Business investment, driven largely by the AI boom, rose 8.7% on an annual basis, and consumer spending, which drives nearly two-thirds of economic activity in the U.S., slowed slightly from last quarter, falling from 1.9% at the end of 2025 to 1.6%. While the economy has remained resilient, the Iran war is clouding the outlook. Thus far, most economists pin the impact from the Iran war and higher oil/energy prices at a 0.3-0.5% drag on 2026 GDP growth.
- Americans have been hit hard by the surge in energy prices. The latest PCE Index report showed that headline prices rose 0.7% M/M or 3.5% Y/Y in March. Core PCE jumped 0.3% M/M or 3.2% Y/Y. The inflation report indicated that the bulk of the price pressure came from goods, which rose 1.4%, boosted by an 11.6% surge in energy goods and services. Services prices overall rose 0.3%. The March CPI report showed headline inflation increased at an annual rate of 3.3%, with core CPI rising just 2.6%.
- U.S. retail sales rose 1.7% in March, after an upwardly revised 0.7% increase in the prior month. This marks the steepest growth since March 2025, driven largely by a record 15.5% surge in gasoline station receipts, as fuel prices spiked amid the escalating conflict with Iran. Despite rising pump prices, consumer spending remained solid across nearly all categories, likely boosted by larger-than-usual tax refunds. Core retail sales, excluding volatile sectors, climbed 0.7%.
- New orders for durable goods rose 0.8% in March. The large headline gain occurred despite a 21.1% drop in commercial aircraft orders. Orders excluding transportation increased 0.9% in March and 7.6% Y/Y. Core shipments – a key input for business investment in the calculation of GDP – rose 1.2% in March and were up an 8.3% annualized rate in Q1 versus the Q4 average. Business investment has consistently risen since mid-2025, driven by a more favorable tax environment and AI spending.
Non-U.S. Developed
- After 16 consecutive months in expansion territory, the eurozone composite PMI dipped back below 50 into contraction. The headline reading of 48.6 was down from 50.7 in March, representing a 17-month low. The service sector fell to a 62-month low in activity while the manufacturing sector hit a 47-month high. April’s flash PMI has moved into contraction territory for the first time since late 2024, signaling a 0.1% quarterly rate of GDP decline after a 0.2% gain had been signaled for Q1. The war is hitting the service sector hardest, where business activity is falling at a rate not seen since the pandemic lockdowns of early 2021.
- Eurozone GDP grew by 0.1% Q/Q in Q1 2026, down from 0.2% growth in Q4 2025. On an annual basis, the eurozone economy expanded by 0.8%, with manufacturing and energy shocks contributing to the sluggish performance. Eurozone inflation hit 3% in April, the highest reading since September 2023. Services inflation increased 3% amid a 10.9% surge in energy prices.
- Japanese bond yields have been jumping higher on the back of higher inflation readings and expectations. The 10-year Japanese Government Bond hit 2.5% last week, driven by the war in Iran and core inflation, which hit an annualized clip of 2.4%. While the Bank of Japan indicated in March that it was holding current policy rates at 0.75%, a growing consensus has formed that the central bank must swiftly raise the policy interest rate if underlying inflation continues to rise above 2%.
Emerging Markets
- China’s economy gathered steam in the first quarter, as robust exports offset sluggish domestic consumption. GDP grew 5% Y/Y in Q1, up from the 4.5% rate reported in the final quarter of 2025. For the full year, China has lowered its growth target to a range of 4.5-5%. The real estate downturn persisted in Q1, with investment falling 11.2%, an acceleration from a 9.9% drop during the same period last year. In addition, retail sales rose 1.7% Y/Y in March and industrial output expanded 5.7%. In the first quarter, China’s exports grew 14.7% from a year earlier in terms of U.S. dollars, the fastest pace since early 2022.
- As the world’s largest oil importer and a heavily export-reliant economy, China is vulnerable to an oil shock that’s already slowing trade, pushing up factory costs and darkening the outlook for the rest of the year.
- China’s official manufacturing PMI increased to 50.3 in April from 50.1 in March. Non-manufacturing PMI fell into contraction territory at 49.4 compared to the 50.1 seen in March, with activity in the services and construction sectors both shrinking. Output and new orders both slowed but remain in expansion territory. The smaller-company focused RatingDog Manufacturing PMI posted the strongest gain in April since December 2020. The headline reading jumped from 50.8 in March to 52.2 in April. Production increased at the fastest pace in nearly two years, driven by robust demand, operational improvements and the launch of new products. The expansion was broad-based and particularly strong in the consumer goods sector.
- Taiwan's economy expanded 13.7% in the first quarter of 2026, the fastest pace since 1987, fueled by soaring demand for AI-related exports. Several economists have raised their 2026 growth estimates to the 8% range, up from 6.5-7%.
Market Performance (as of 4/30/26)
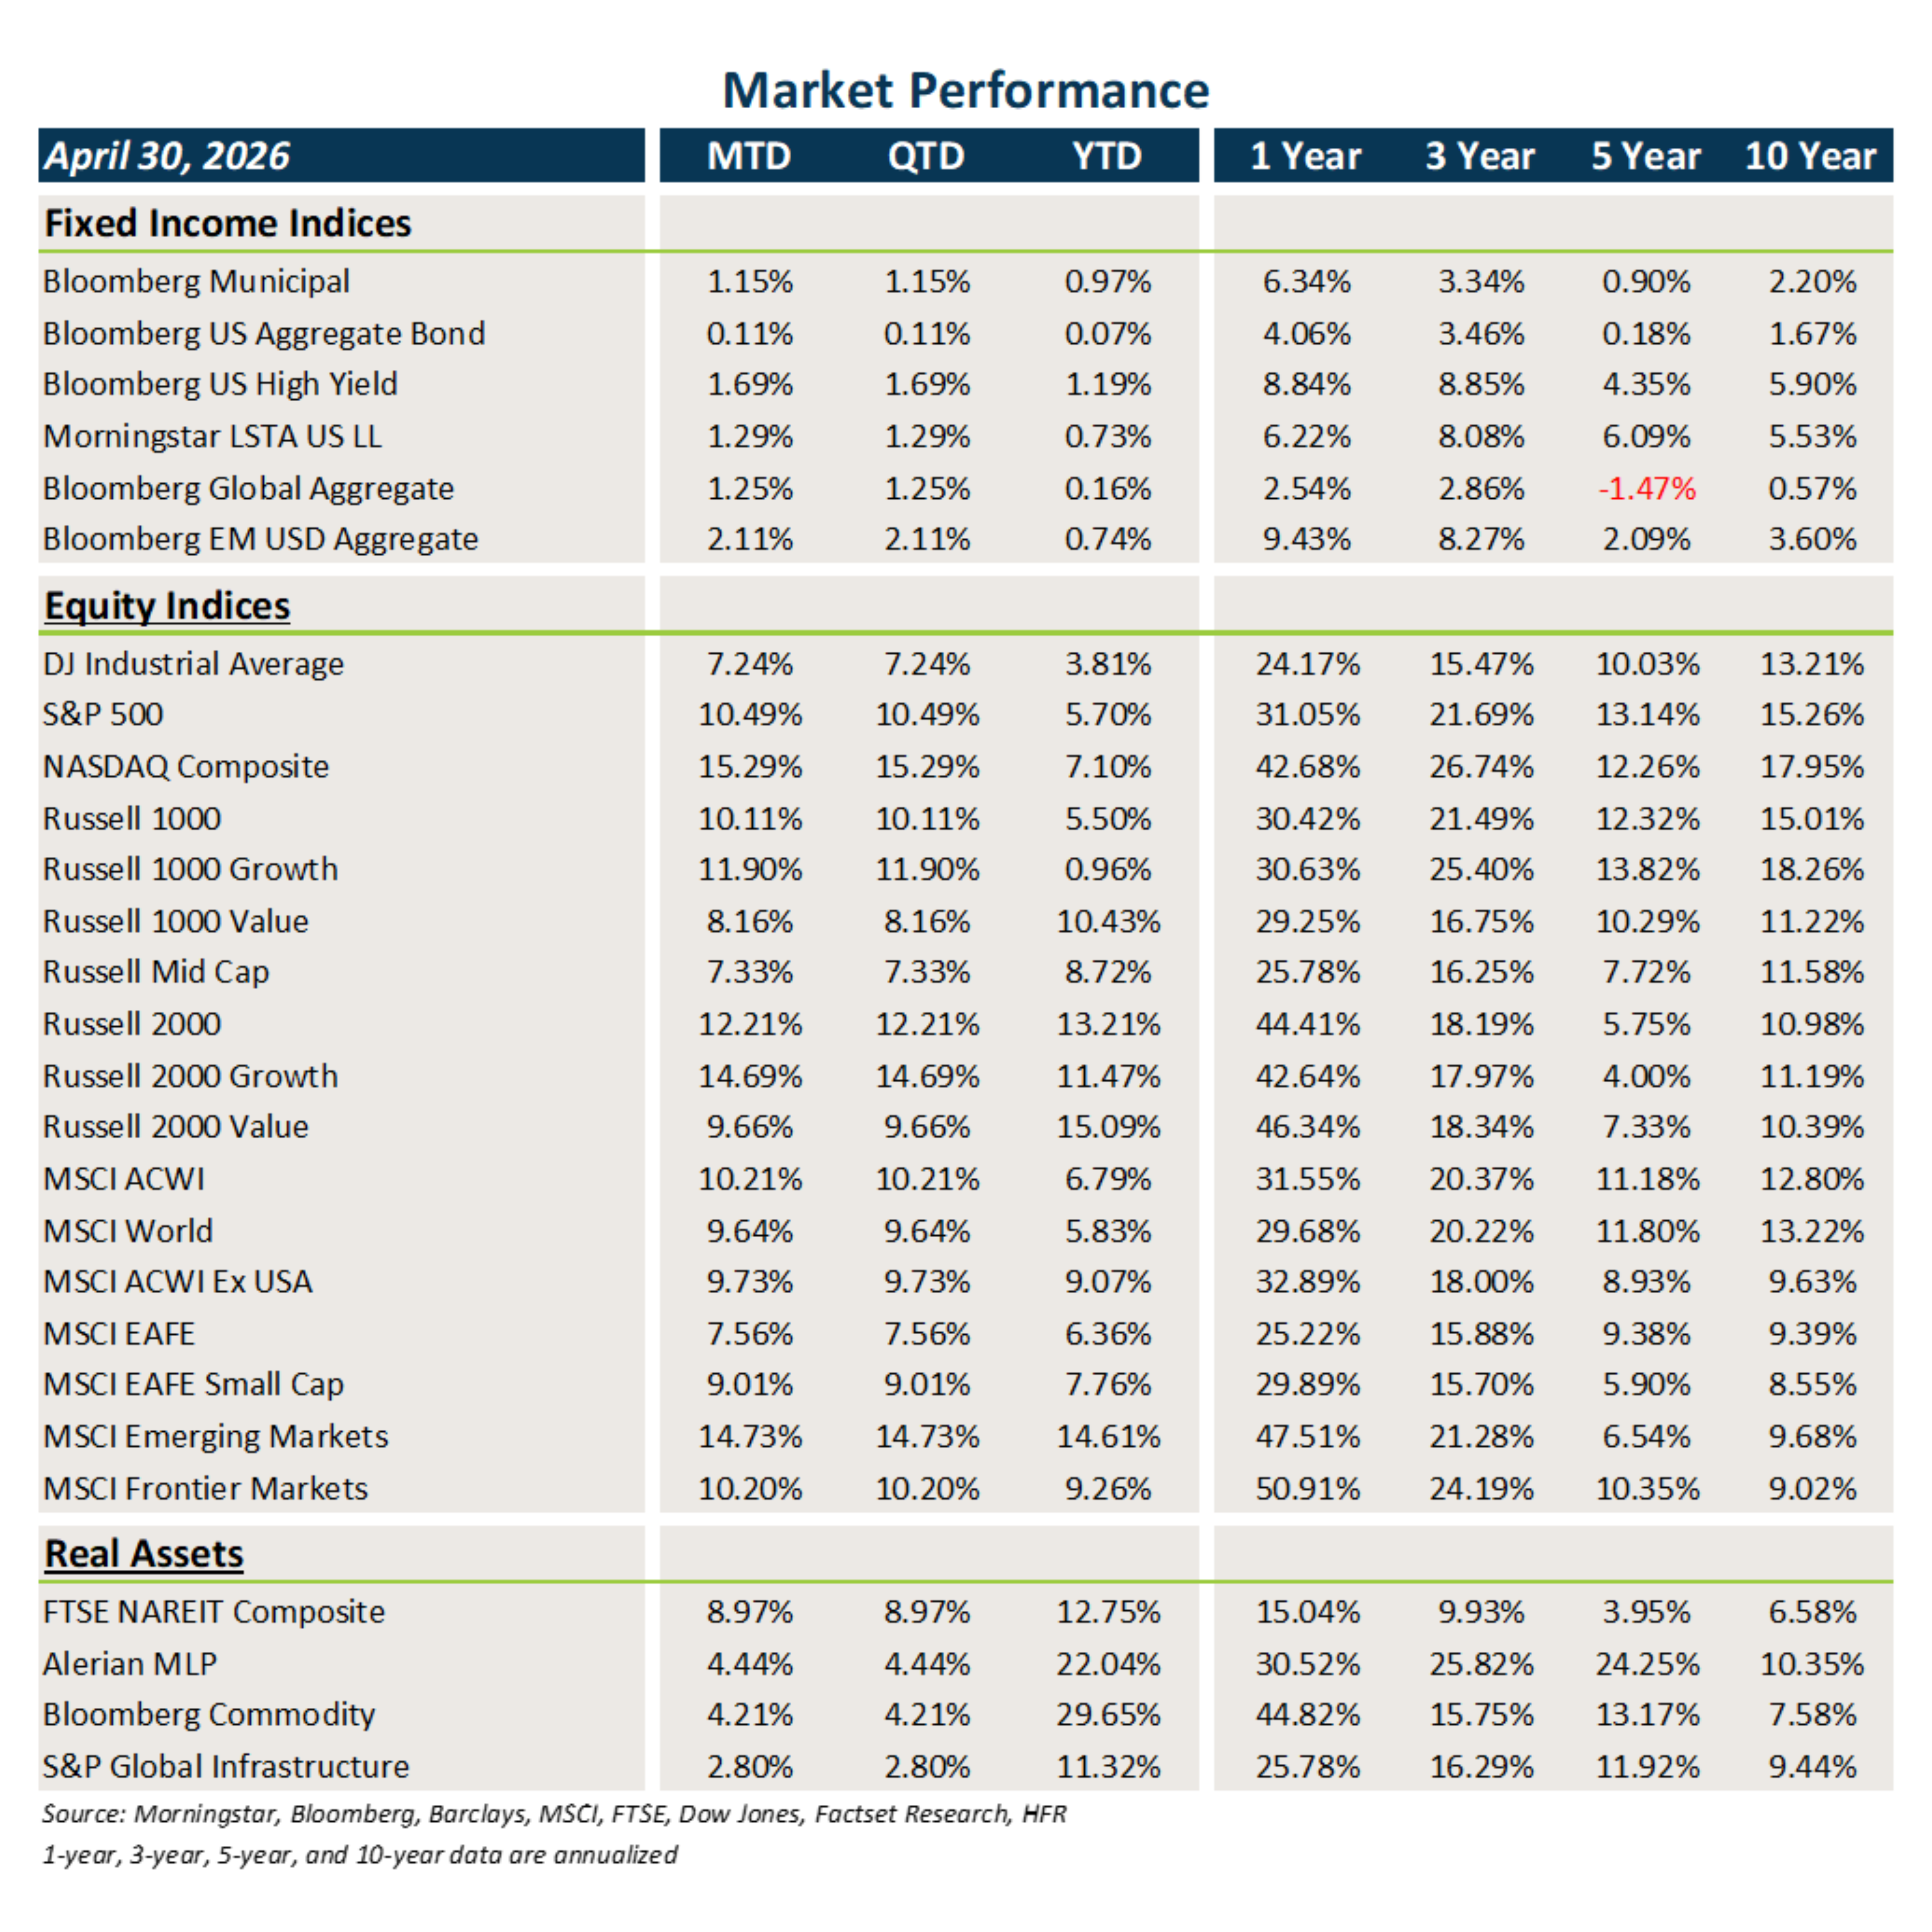
Fixed Income
- Yields on the 10-year Treasury and other global sovereign debt fell in April, providing a nice boost to core fixed income and municipal bonds.
- After some minor spread widening during the March selloff, credit spreads tightened in April, driving another month of clipping coupons.
- Bonds outside the U.S. posted modest gains last month on the heels of some spread compression and modest U.S. dollar weakness.
U.S. Equities
- U.S. equities posted an exceptional month, with broad-based gains up and down the market cap spectrum. Tech/AI stocks led the rebound.
- Growth beat value in April, and small caps outpaced large caps.
- The March selloff brought tech valuations more in line with the broader market, which was compelling for investors.
Non-U.S. Equities
- Stocks outside the U.S. generated solid gains in April in local terms but received an added boost from USD weakness.
- Similar to what occurred in the U.S., small caps beat large caps within EAFE markets and growth outperformed value. Within EMs, small caps lagged large caps.
- U.S. dollar weakness boosted EAFE returns by 237 bps and EM returns by 145 bps in April.
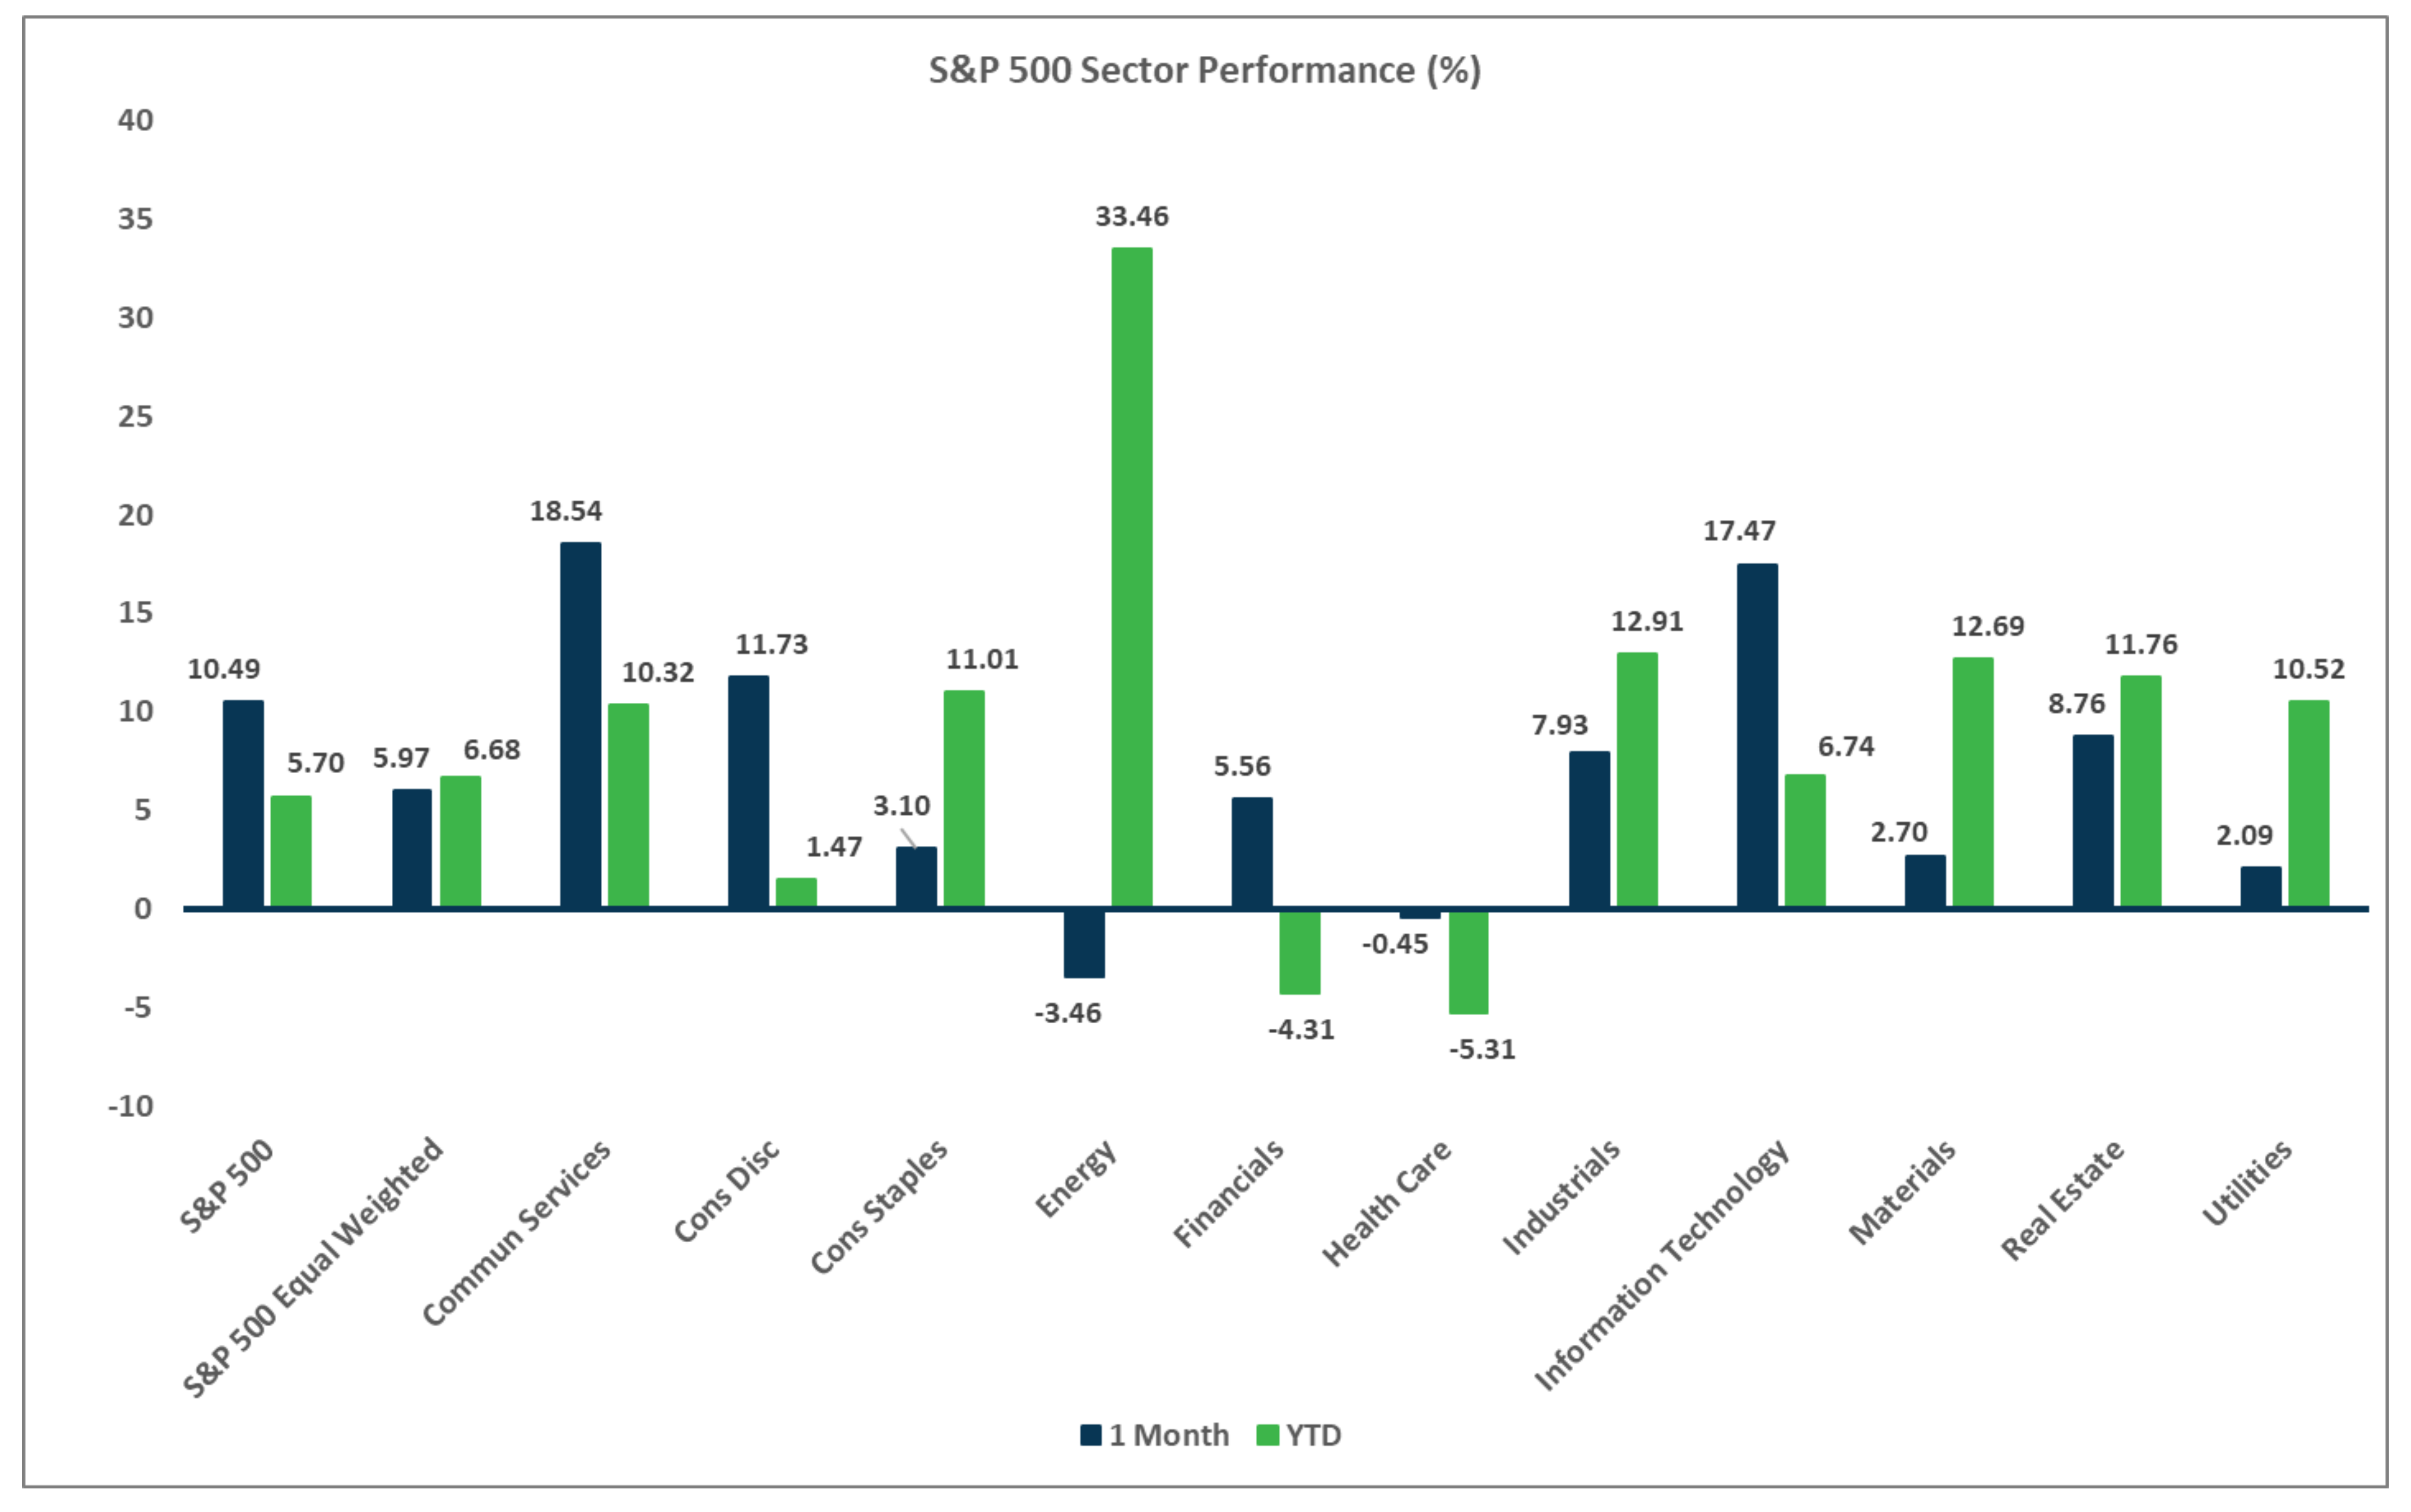
Sector Performance – S&P 500 (as of 4/30/26)
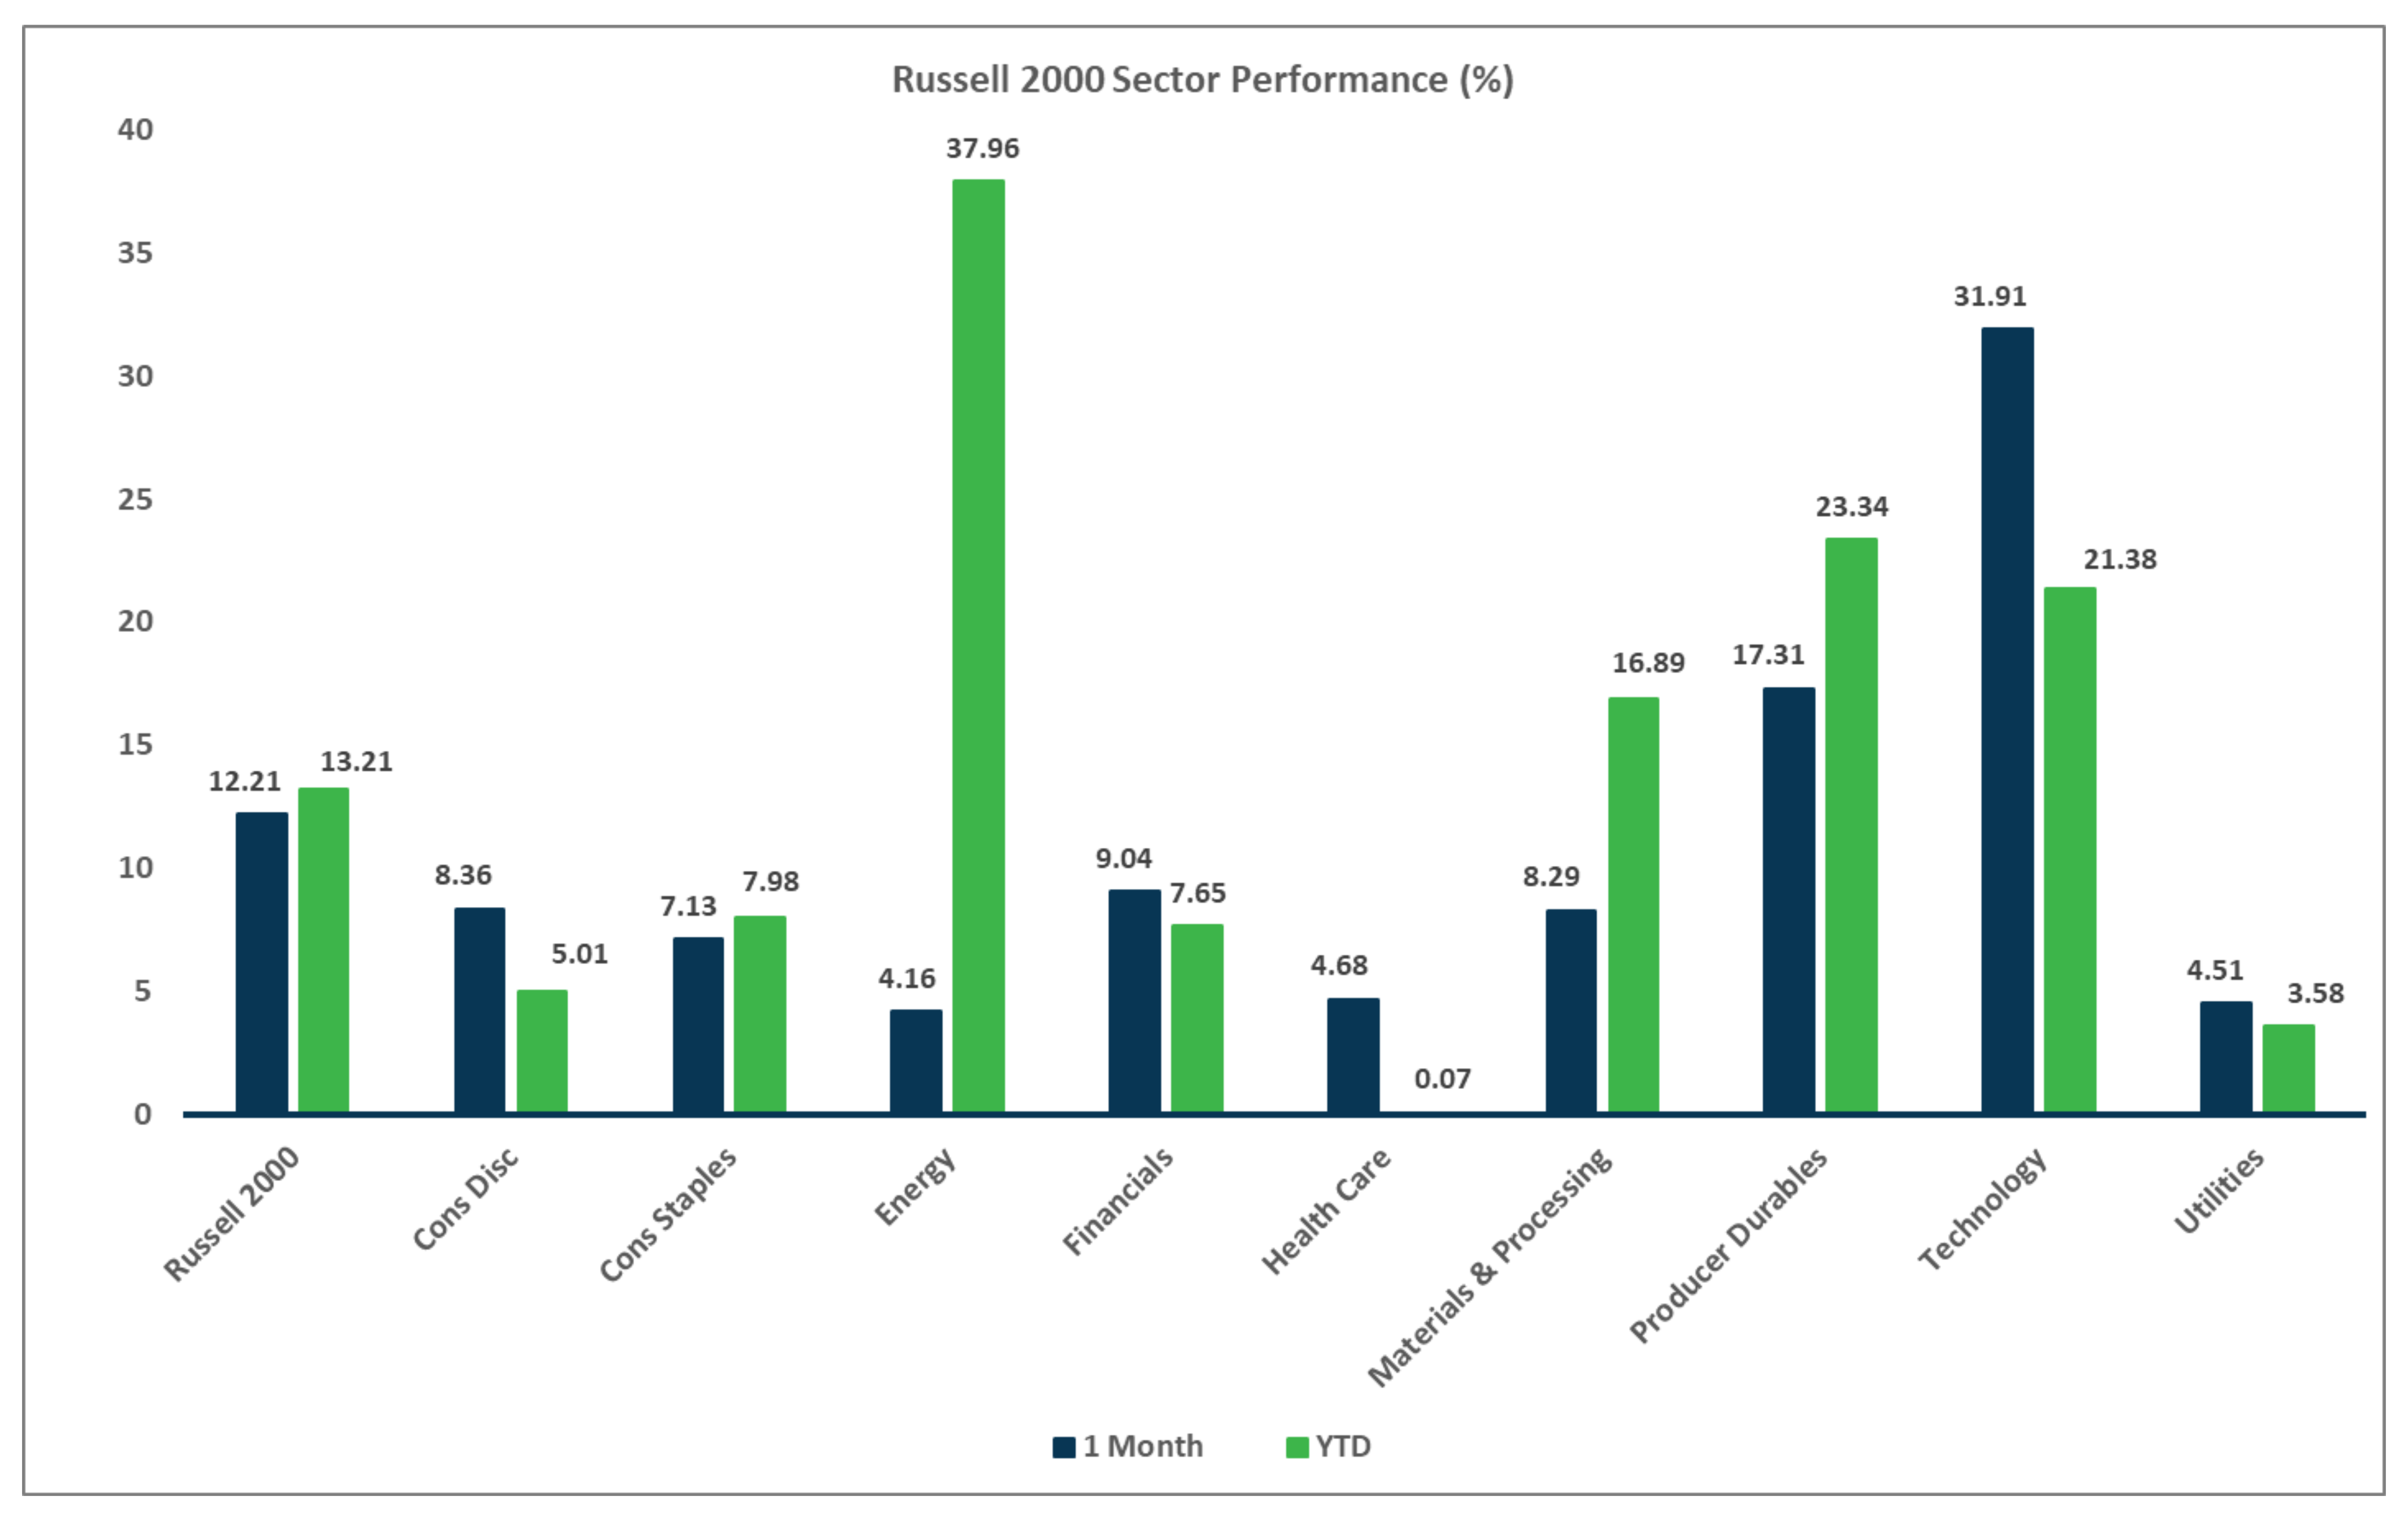
Sector Performance – Russell 2000 (as of 4/30/26)
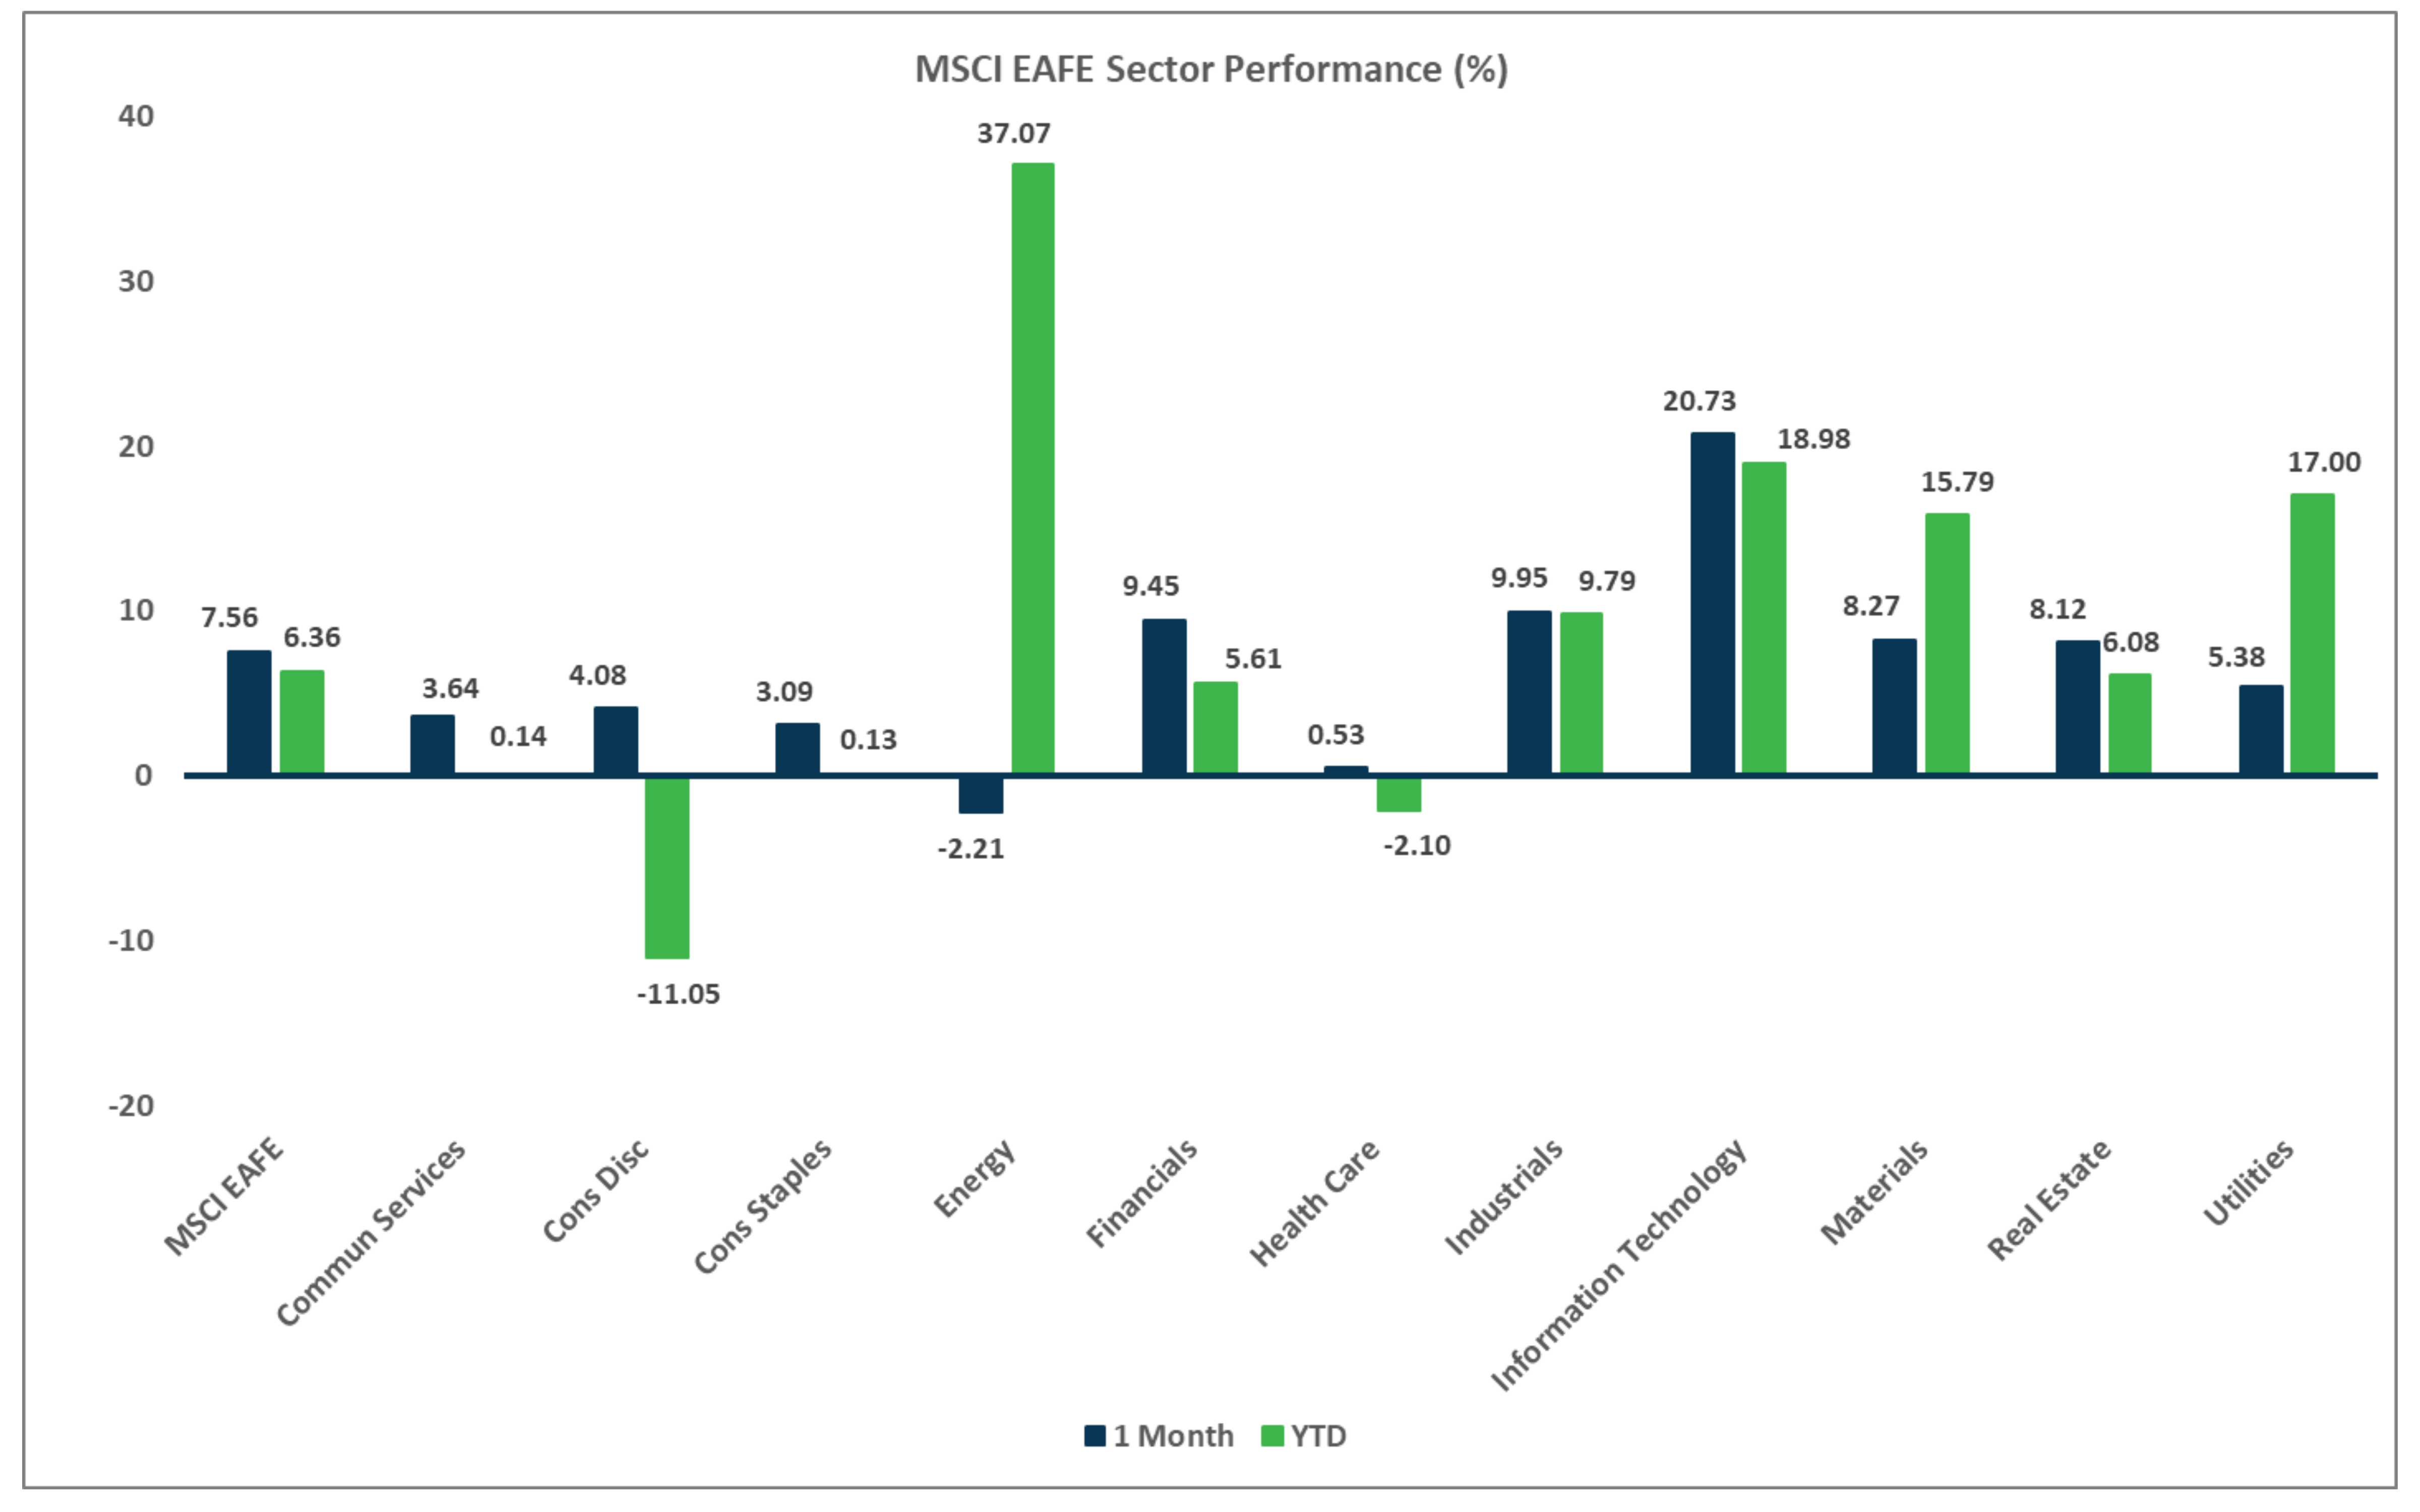
Sector Performance – MSCI EAFE (as of 4/30/26)
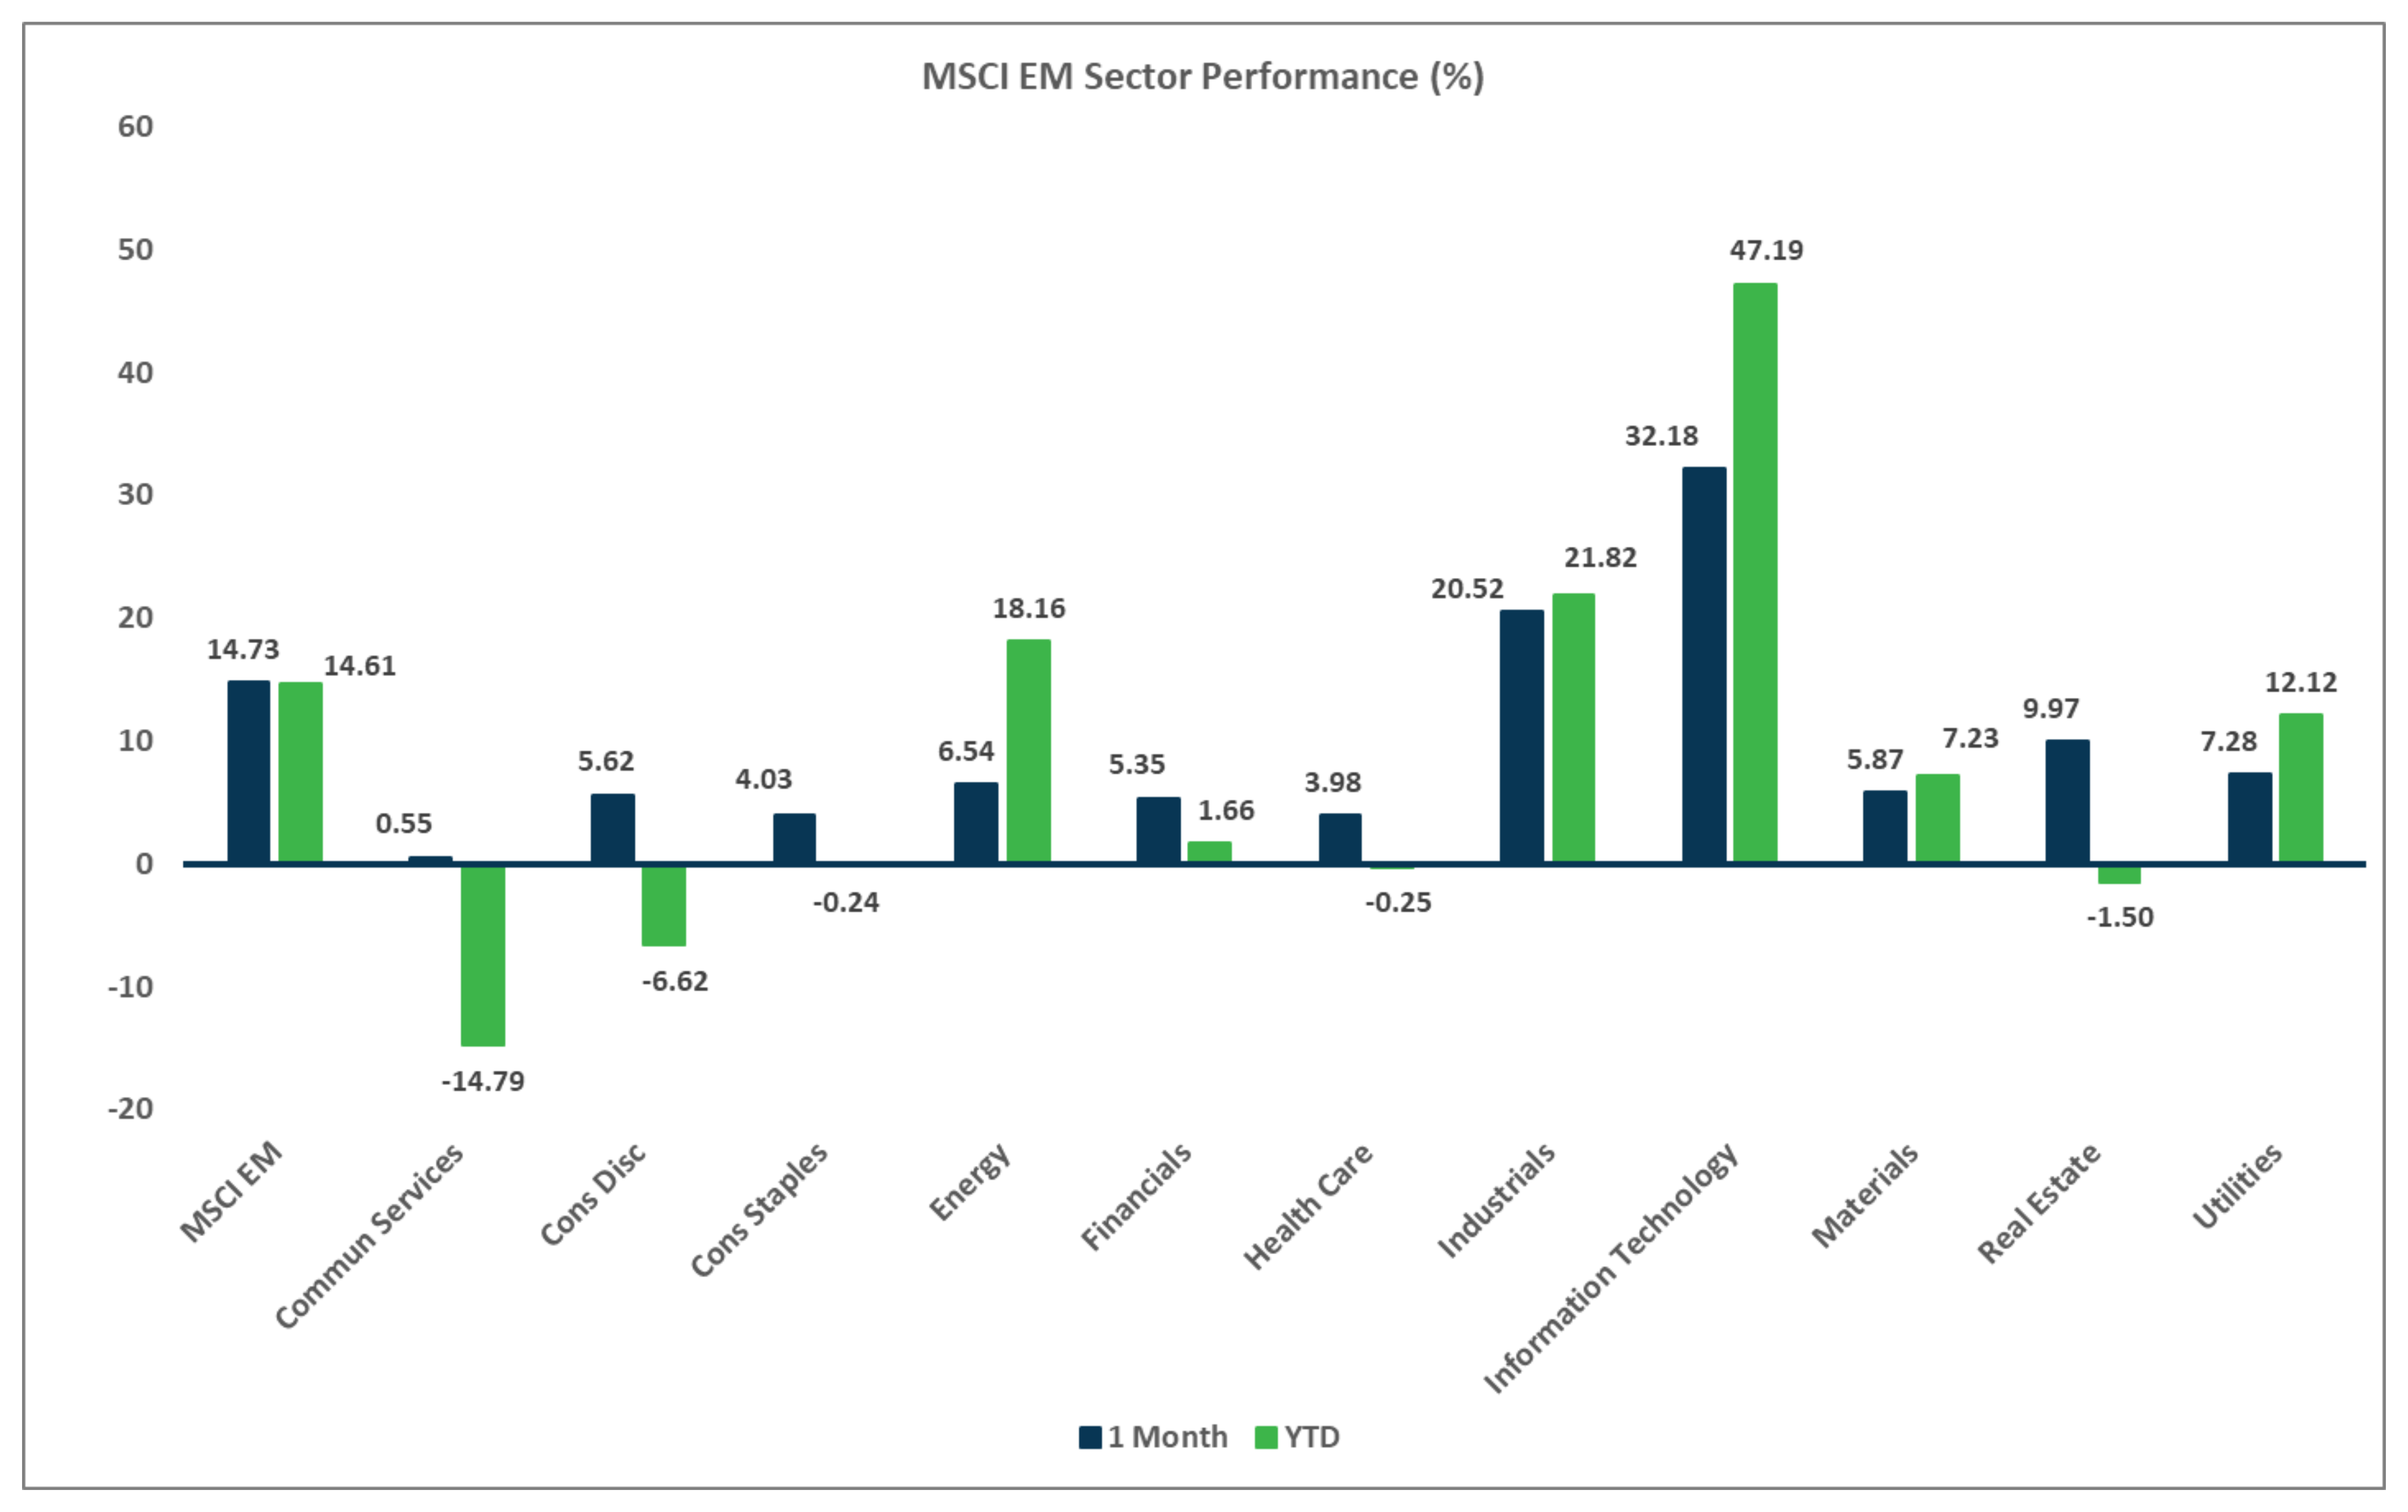
Sector Performance – MSCI EM (as of 4/30/26)
Disclosures
Investment services offered by Enterprise Bank & Trust are not deposits, obligations, or guaranteed by the bank or its affiliates. The information provided represents the opinions of Enterprise Bank & Trust and is not intended to forecast future events or guarantee future results. Past performance does not guarantee future returns. This information is for educational purposes only. Investors should consult with their investment professionals for advice concerning their particular situation.
Investments are: *Not FDIC insured *May lose value *Not financial institution guaranteed *Not a deposit *Not insured by any federal government agency.

