
March 2026 Market Update

Economic Highlights
United States
- Fourth-quarter GDP was revised down to just 0.7% growth, well below the 1.5% estimate and previous reading of 1.4%. It also marked a considerable slowdown from the 4.4% gain in Q3, hampered by a record-long government shutdown that saw government spending tumble 16.7%. The downward revision came due to adjustments in consumer and government spending and exports. A decline in imports, which technically subtract from GDP, also was less than the previous estimate. Consumer spending rose 2% for the quarter, down from the earlier 2.4% projection, which represented a decline from the 3.5% increase in Q3.
- February’s CPI report was in line with expectations and perhaps the last one to reflect cooling inflation. Headline prices rose 0.3% M/M or 2.4% Y/Y. Core CPI increased 0.2% M/M or 2.5% Y/Y. Rent rose just 0.1%, the smallest monthly increase since January 2021. In contrast, the PCE Index rose 2.8% in January, with core PCE increasing 3.1%.
- The U.S. economy shed 92,000 jobs in February, well below the expectation for a 50,000 gain. This marked the third time in five months that the economy lost jobs. Health care, the primary growth driver in payrolls, saw a loss of 28,000, due largely to a strike at Kaiser Permanente that sidelined more than 30,000 workers in Hawaii and California. Average hourly earnings increased 0.4% for the month and 3.8% from a year ago, both 0.1% above forecast. The broader U6 unemployment rate fell to 7.9%. One additional area of concern was the labor participation rate, which dropped to 62%, its lowest level since December 2021.
- New orders for durable goods treaded water to start off the year, remaining unchanged from December. The tepid reading was driven by a 0.9% decline in transportation equipment — particularly a 23.7% drop in defense aircraft. Transportation is a notoriously volatile category, so the preference is to focus on orders excluding transportation for a better check on the broader economy. Orders excluding transportation rose 0.4% in January and 5.7% Y/Y. Orders for commercial aircraft and fabricated metal products rose in January while orders for defense aircraft and autos declined. The government calculates business investment for GDP purposes by using shipments of non-defense capital goods excluding aircraft. This measure declined 0.1% in January.
Non-U.S. Developed
- Flash composite PMI data from the eurozone pointed to a near-stalling of output growth in the private sector amid a reduction in new orders. The rate of input cost inflation accelerated sharply following the outbreak of war in the Middle East to the fastest in just over three years. The war also caused disruption to supply chains, with manufacturers reporting the most marked lengthening of suppliers' delivery times in over three-and-a-half years. Meanwhile, companies scaled back employment marginally and were much less confident regarding the outlook for output over the coming year than had been the case in February.
- The headline reading of 50.5 was down from 51.9 in February, with most of the slowdown in growth attributed to service sector softness. The survey data are indicative of eurozone GDP growth slowing to a quarterly rate of just below 0.1% in March, with the forward-looking indicators pointing to a heightened risk of a downturn in the coming months.
- Japan's economy grew faster than initially estimated in Q4 versus the prior quarter, based on revised data from Japan’s Cabinet Office. The economy expanded an annualized 1.3% in Q4, compared with the initial estimate of 0.2%. Private consumption, which accounts for more than half of Japan's economy, increased 0.3%, versus a 0.1% uptick in the preliminary data. Businesses' capital expenditure rose 1.3% in Q4, revised up from the initial estimate for a 0.2% rise. Finally, external demand, or exports minus imports, was unchanged from the preliminary data of no contribution to GDP. Domestic demand contributed 0.3%, revised up from zero contribution.
Emerging Markets
- China’s manufacturing sector rebounded in March, posting its fastest pace of activity in more than a year. The official manufacturing PMI increased from 49.0 in February to 50.4 in March. The report showed that production and new orders expanded while the measures on raw materials inventory, employment and delivery time remained in contraction territory. In the first two months of this year, China’s exports surged 21.8% from a year earlier, sharply beating expectations, as robust demand from Southeast Asia and Europe more than offset the slump in U.S.-bound shipments.
- The official non-manufacturing PMI, which measures activity in the services sector such as tourism, rose to 50.1 from 49.5 in February.
- India's GDP growth is expected to moderate to 6.5% in FY27 from the projected 7.5% in FY26, owing to the adverse impact of elevated energy prices and concerns around energy availability. While energy dependence could have a negative impact on the Indian economy, lower tariffs, policy rate cuts, subdued food inflation and an improved farm sector outlook could provide an added boost to GDP growth.
- Brazil’s battle against inflation finally paid off in February, with headline inflation falling to 3.8% (down from 4.4%). The decline was driven primarily by base effects in housing and electricity, where Y/Y increases fell sharply from 10% to 5.7%. However, the monthly reading tells a different story, with consumer prices rising 0.70% in February — the largest M/M increase in a year. The conflict in Iran and Brent crude above $110 introduce yet another inflationary shock that could plague countries across the globe.
Market Performance (as of 3/31/26)
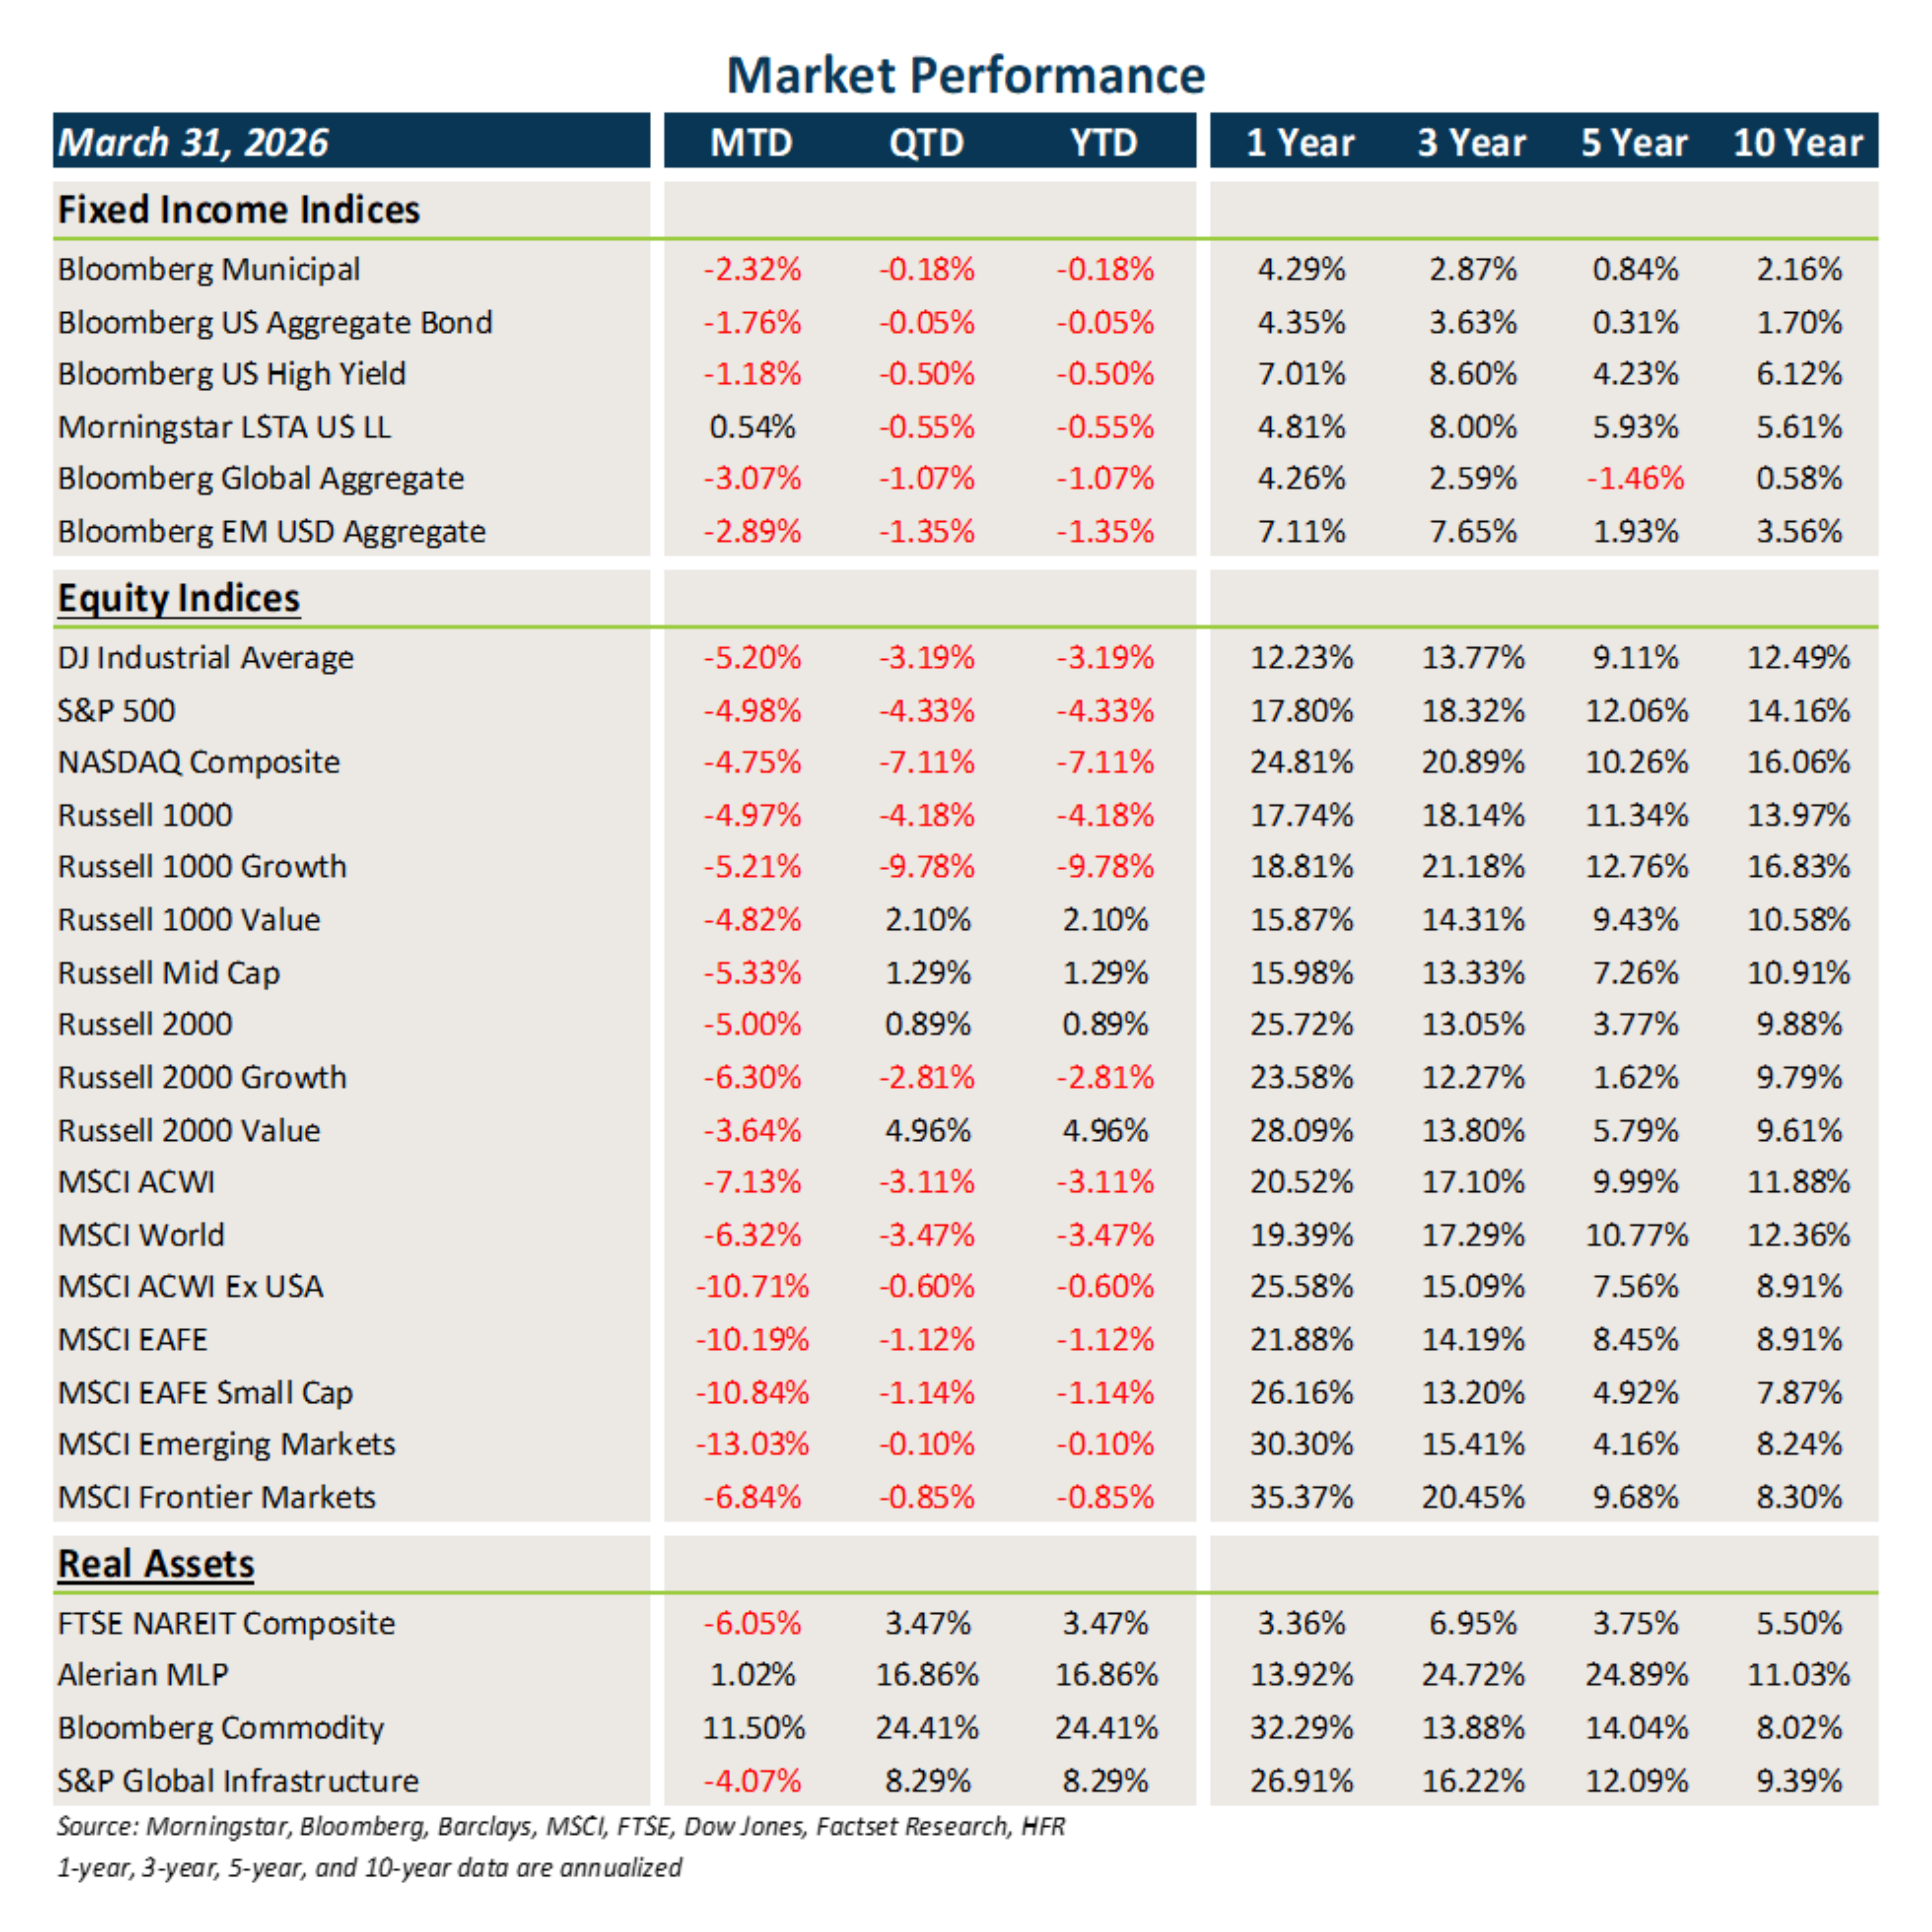
Fixed Income
- Yields on the 10-year Treasury and other global sovereign debt surged higher in March as investors repriced inflation expectations and global risk.
- The jump in interest rates was negative for core fixed income and municipal bonds. Bonds outside the U.S. were also plagued by USD strength.
- Risk-off sentiment led to spread widening across all areas of credit last month. Loans benefited from their floating rate properties, but high yield and EMD fell in value.
U.S. Equities
- U.S. equities struggled in March, largely due to the conflict in Iran, higher oil prices and surge in inflation expectations. Markets hate uncertainty and that drove the narrative last month.
- Growth underperformed value across all market capitalizations, and there was little dispersion between small caps and large caps.
- After starting 2026 on a positive note, the S&P 500 finished Q1 down 4.3%. There was strong correlation between higher interest rates and equity market weakness in March.
Non-U.S. Equities
- Stocks outside the U.S. posted strong gains to start the year but were hit particularly hard in March by the conflict in Iran, the surge in interest rates and inflation expectations.
- EAFE and EM equities lagged their U.S. counterparts last month. Growth trailed value, and small caps underperformed large caps.
- USD strength cost EAFE investors 230 bps of performance in March and EM investors 252 bps.
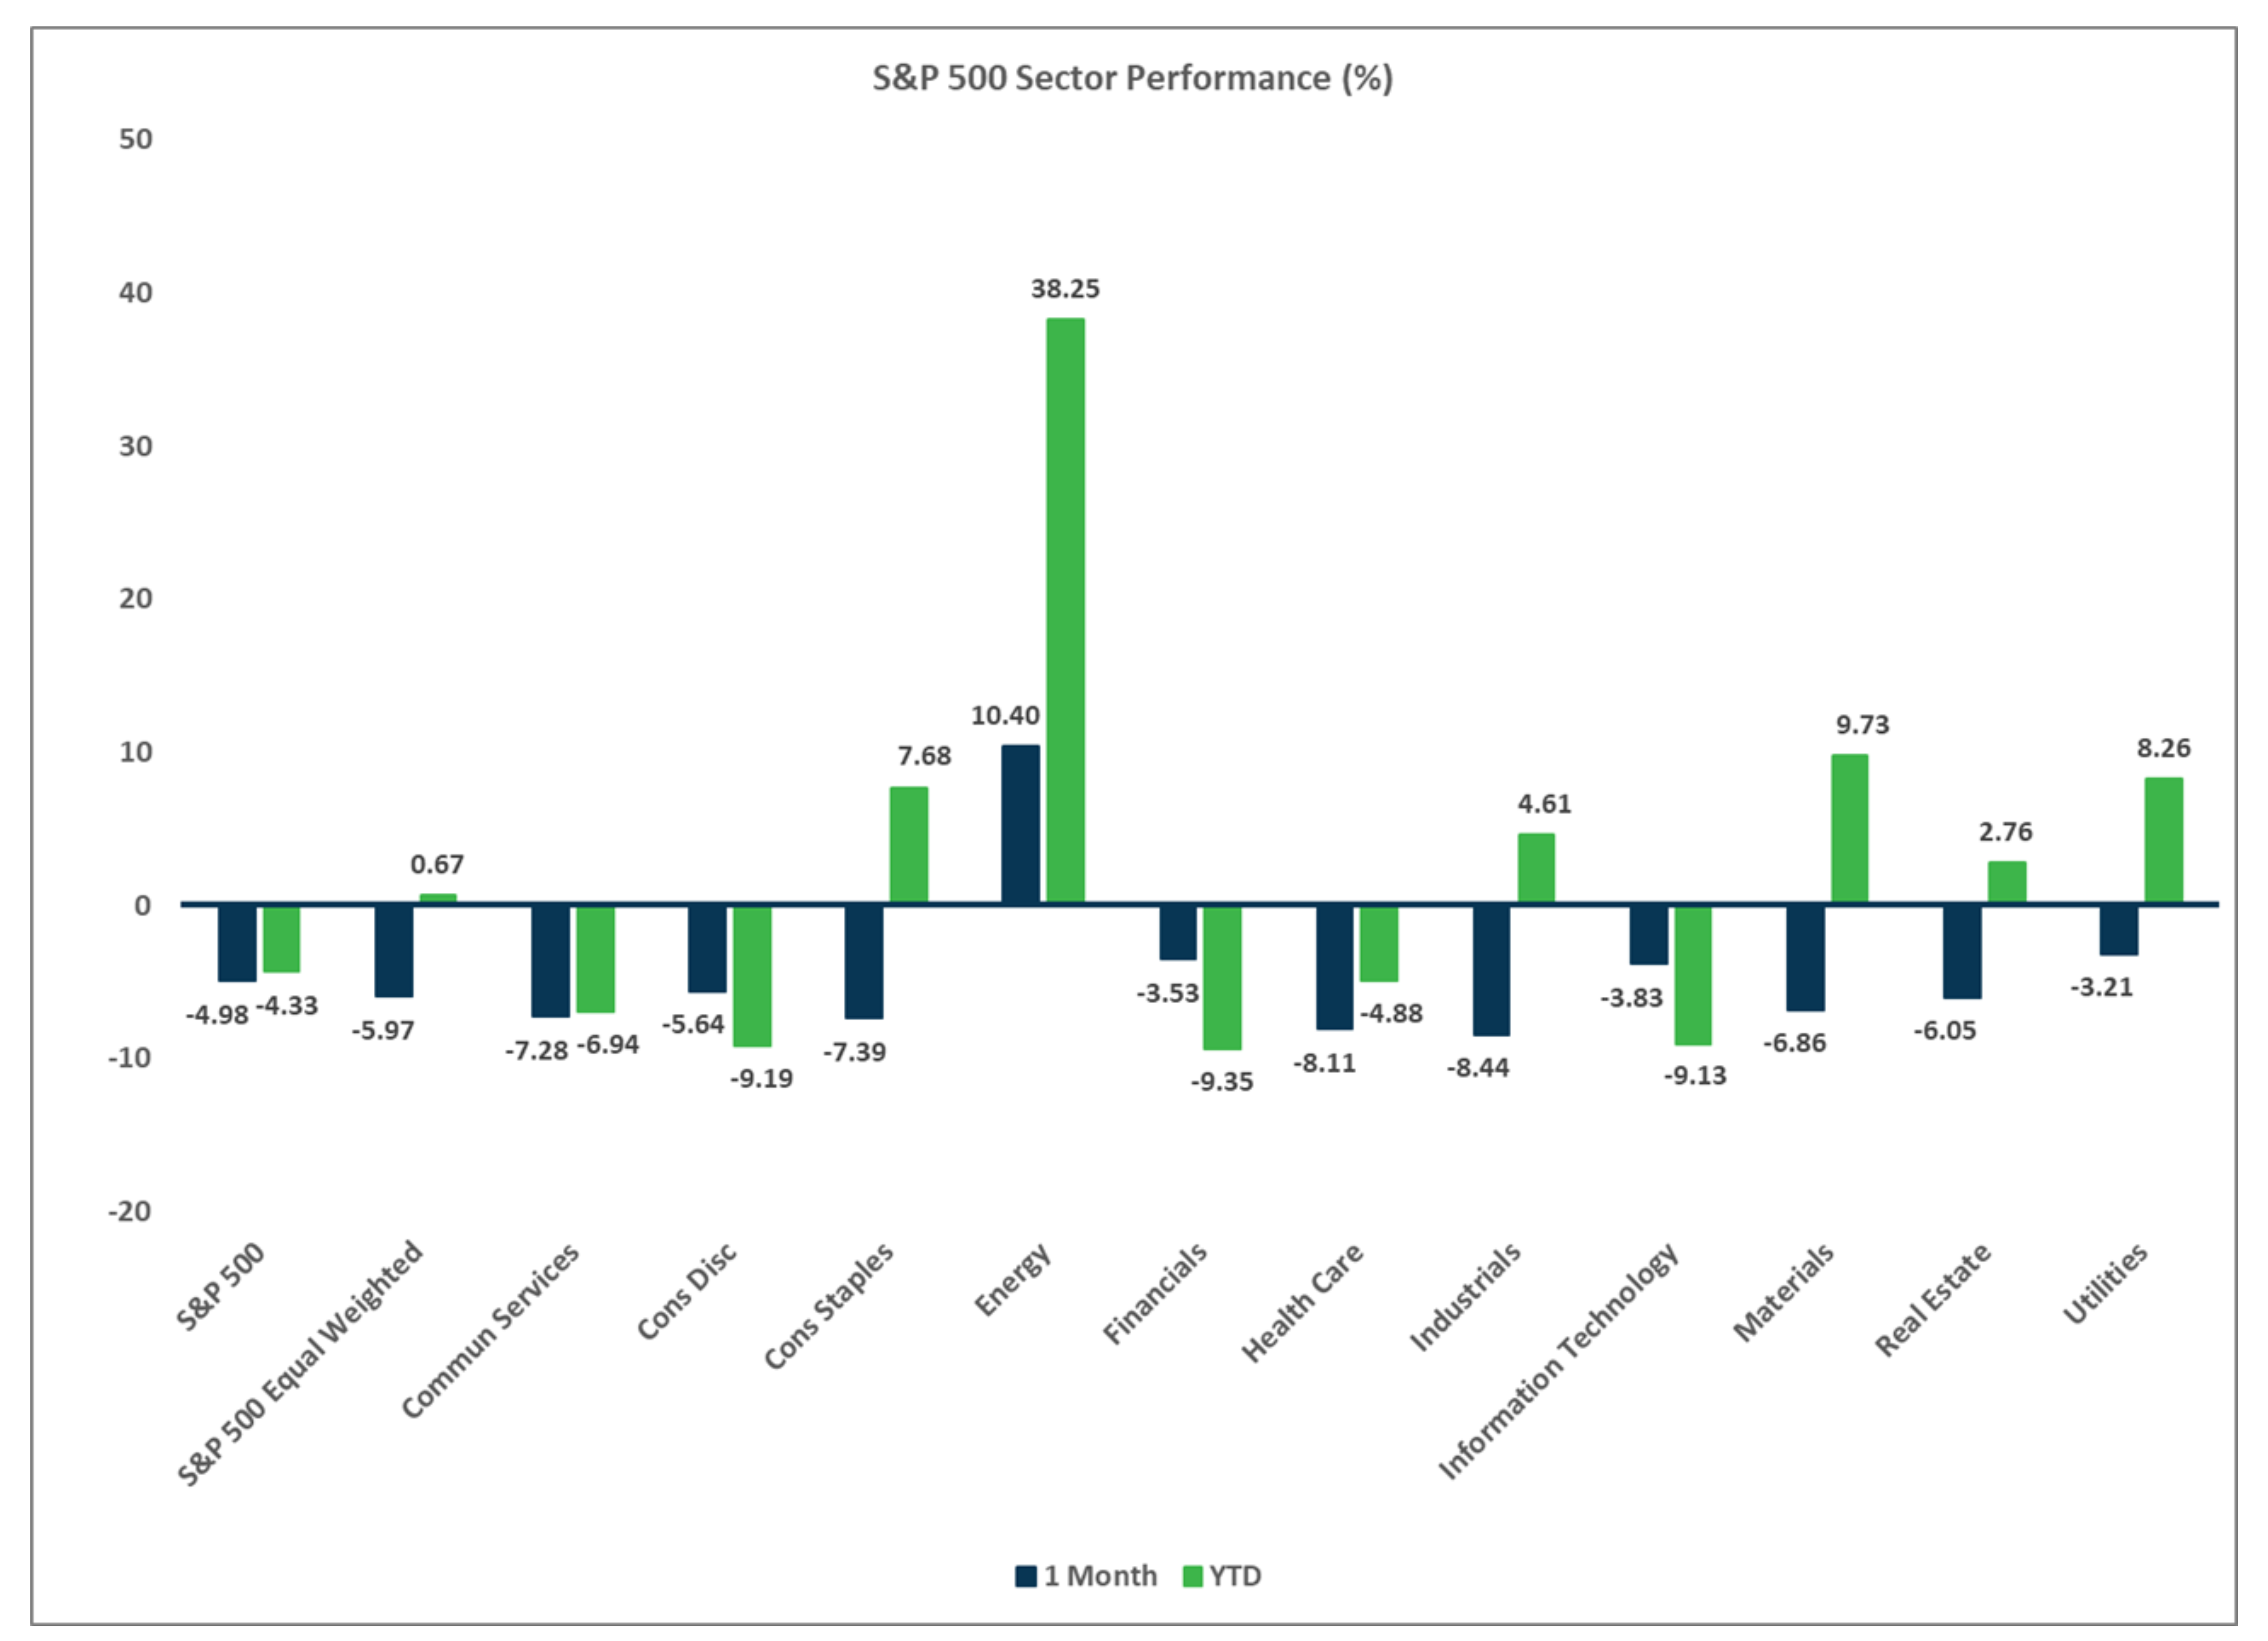
Sector Performance – S&P 500 (as of 3/31/26)
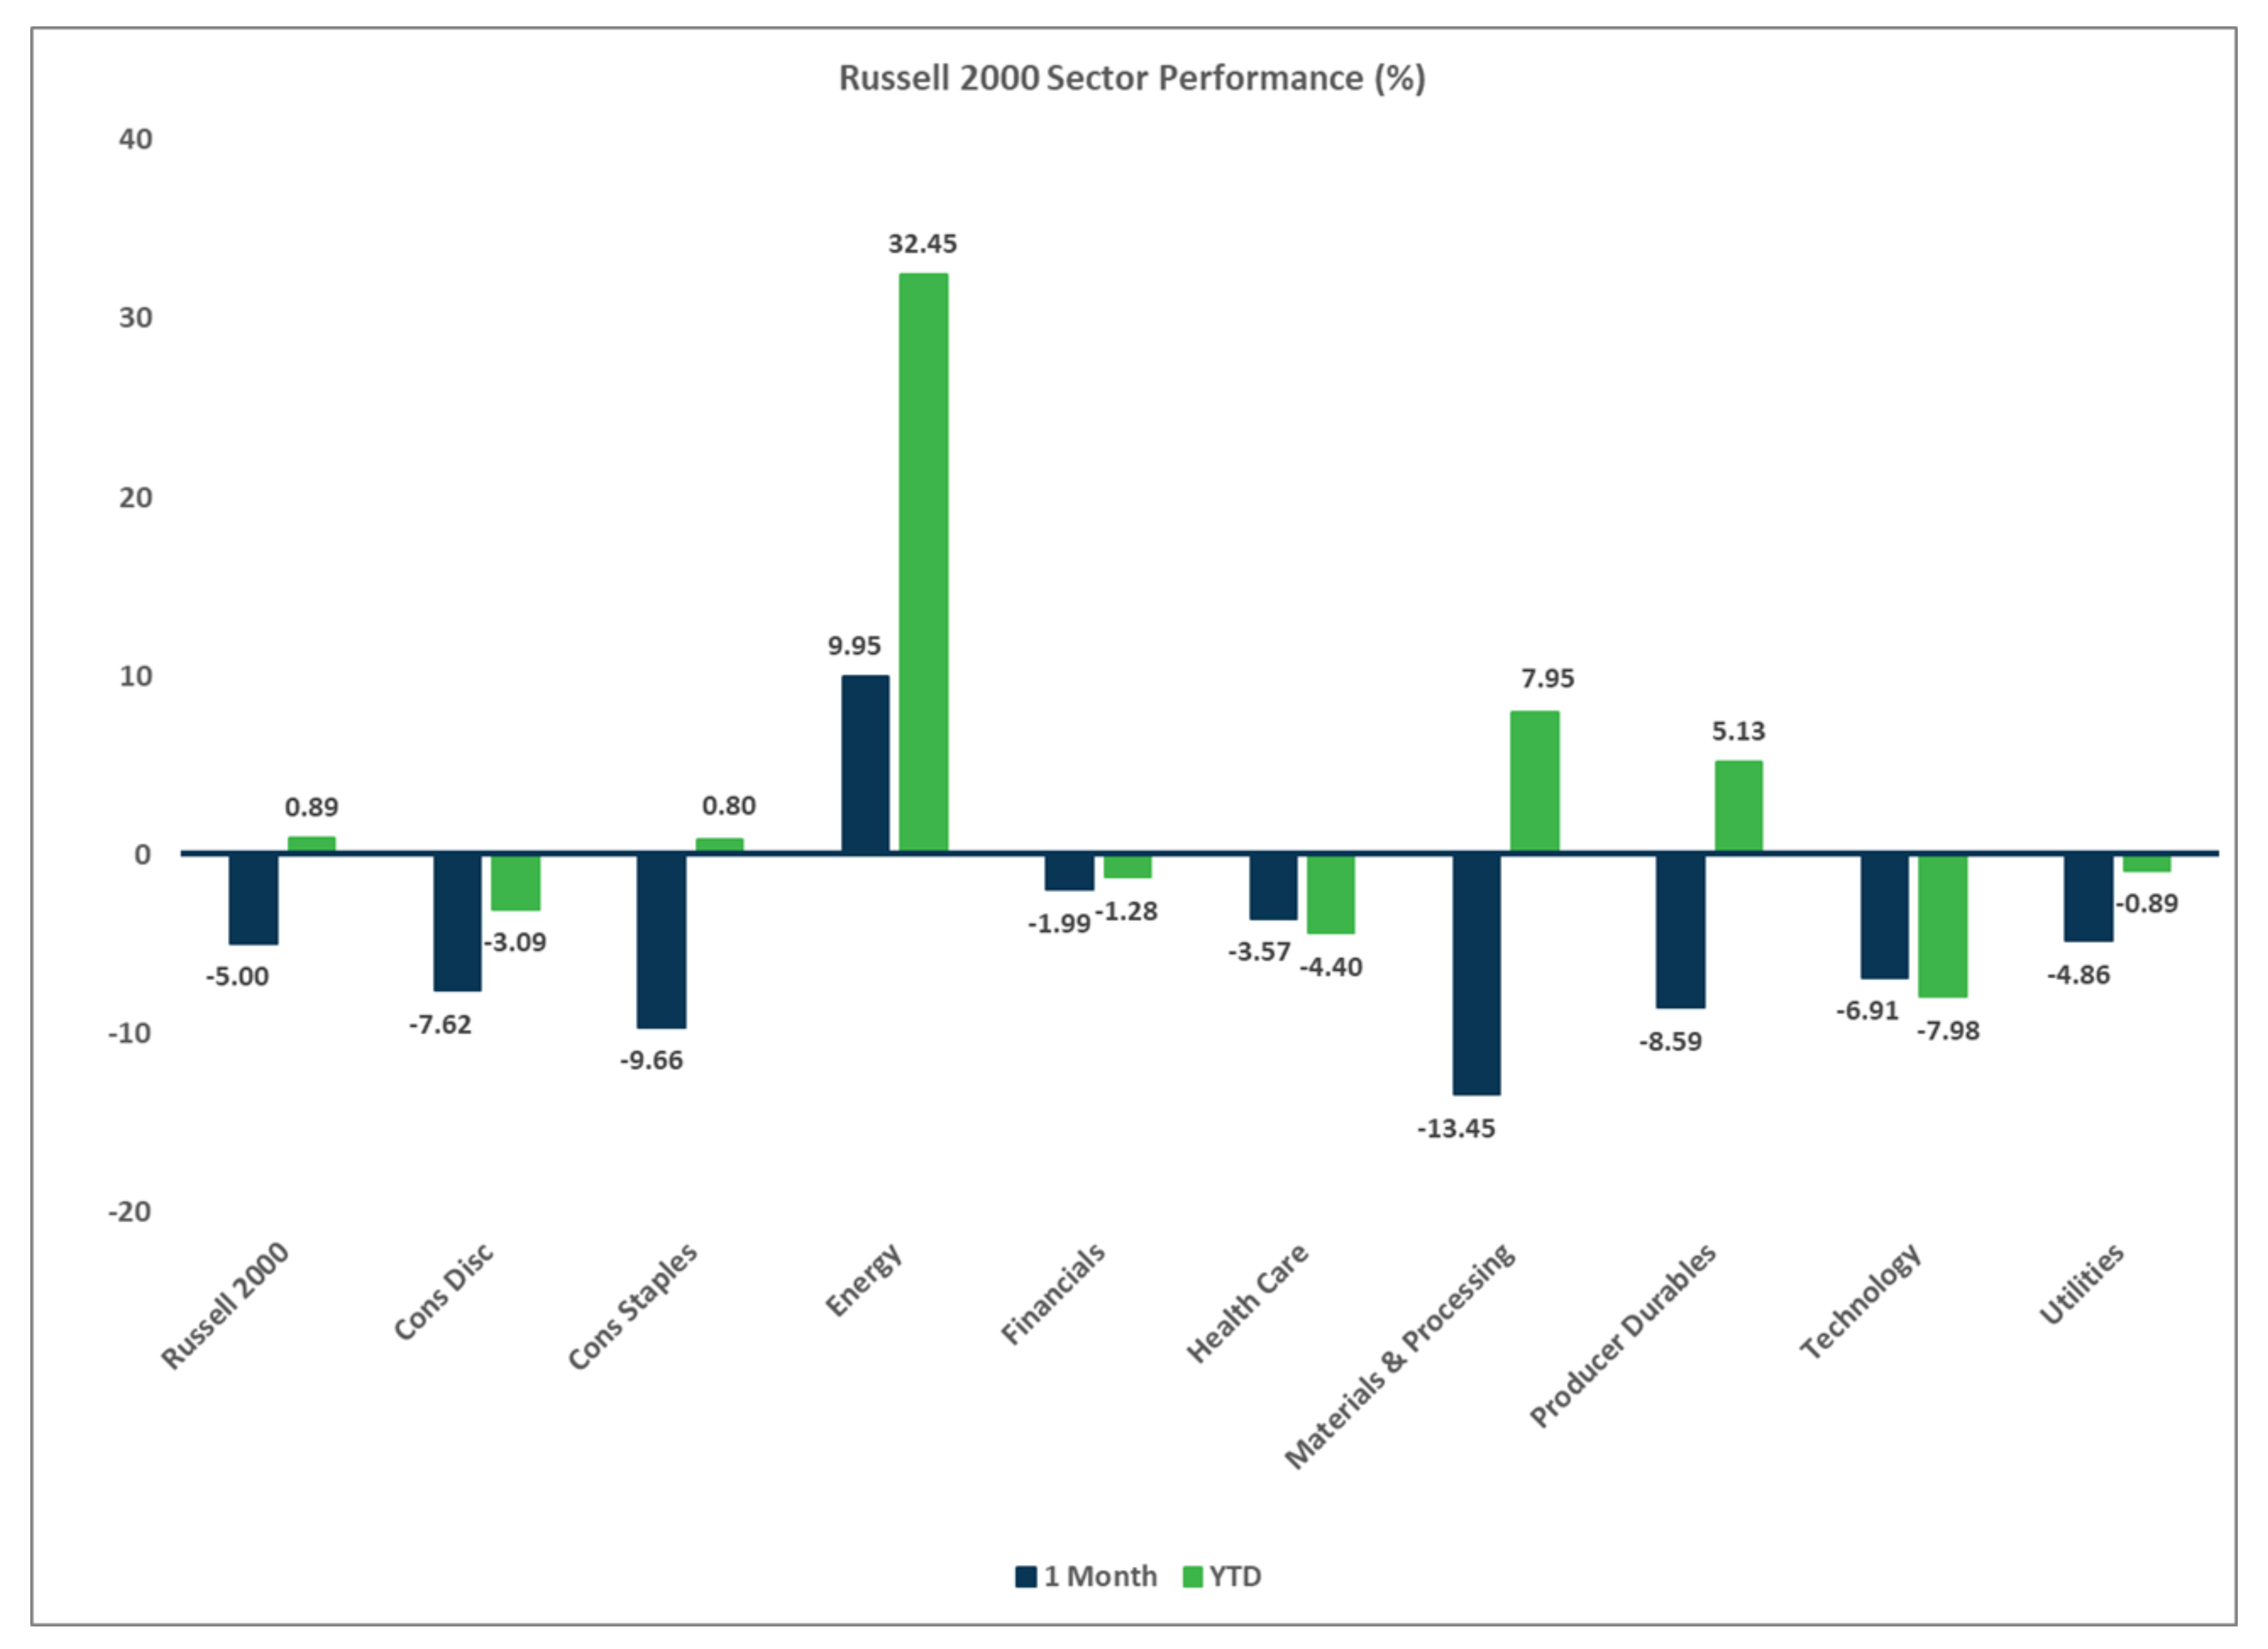
Sector Performance – Russell 2000 (as of 3/31/26)
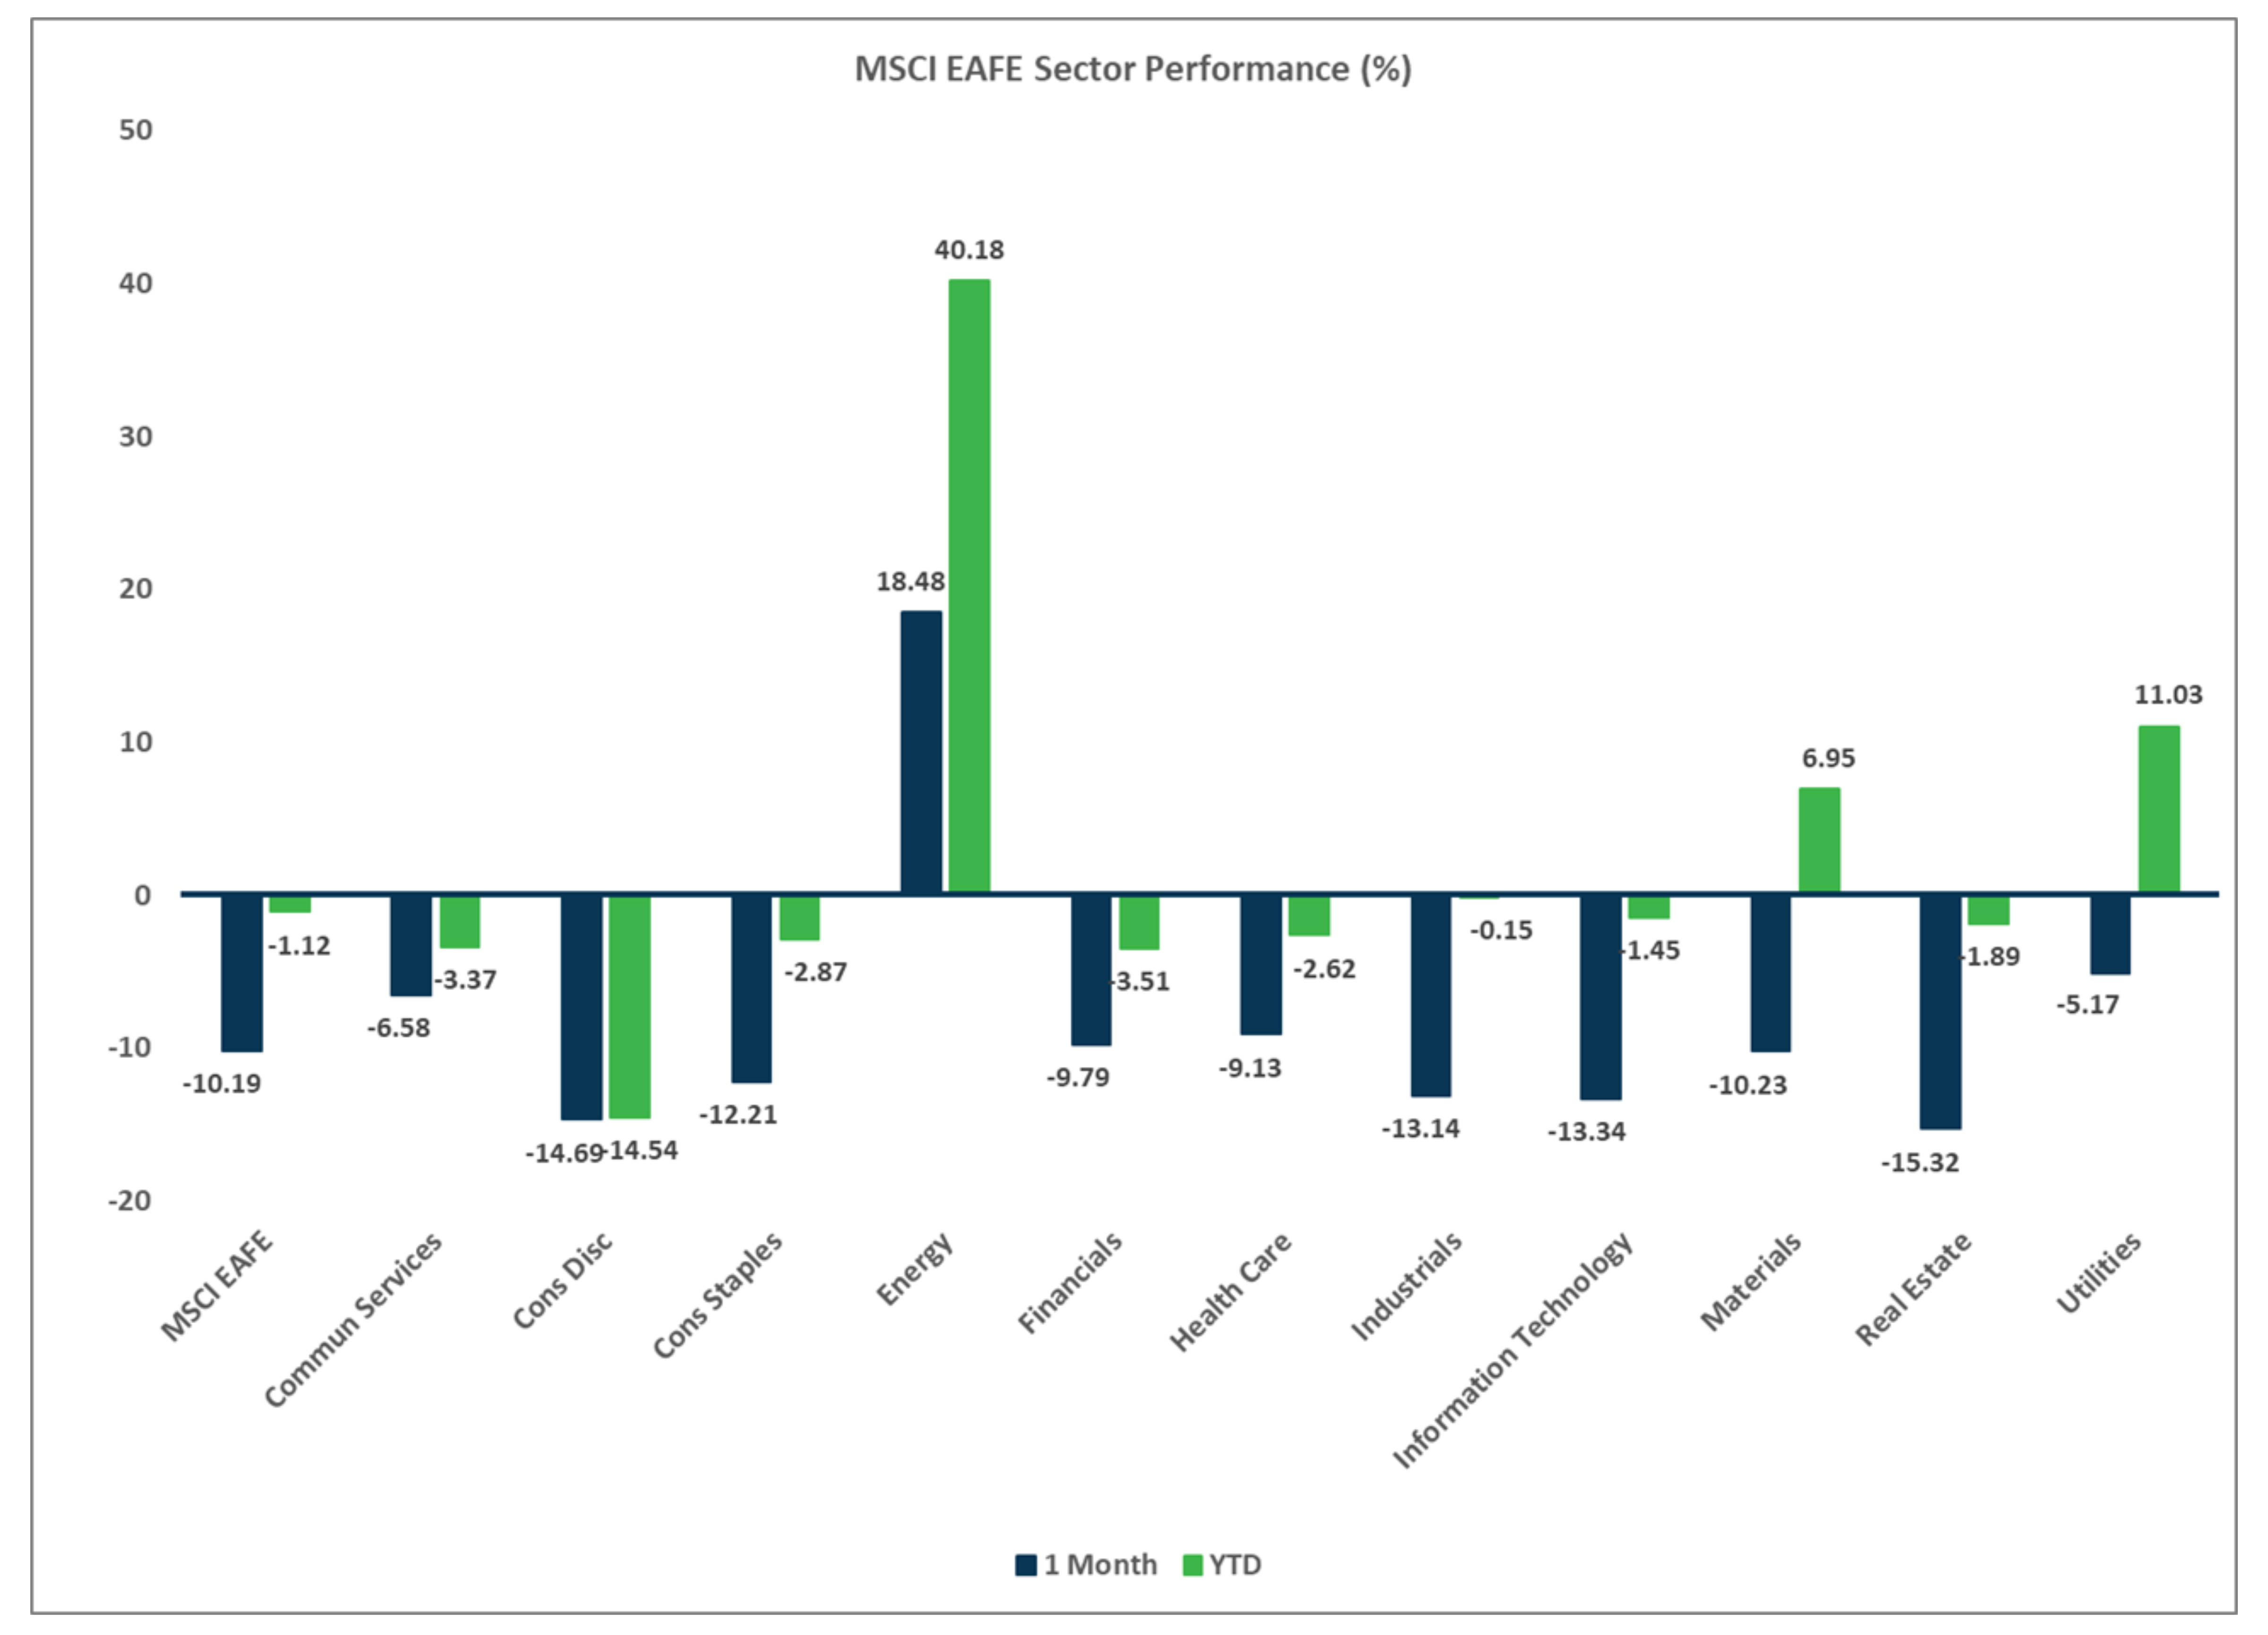
Sector Performance – MSCI EAFE (as of 3/31/26)
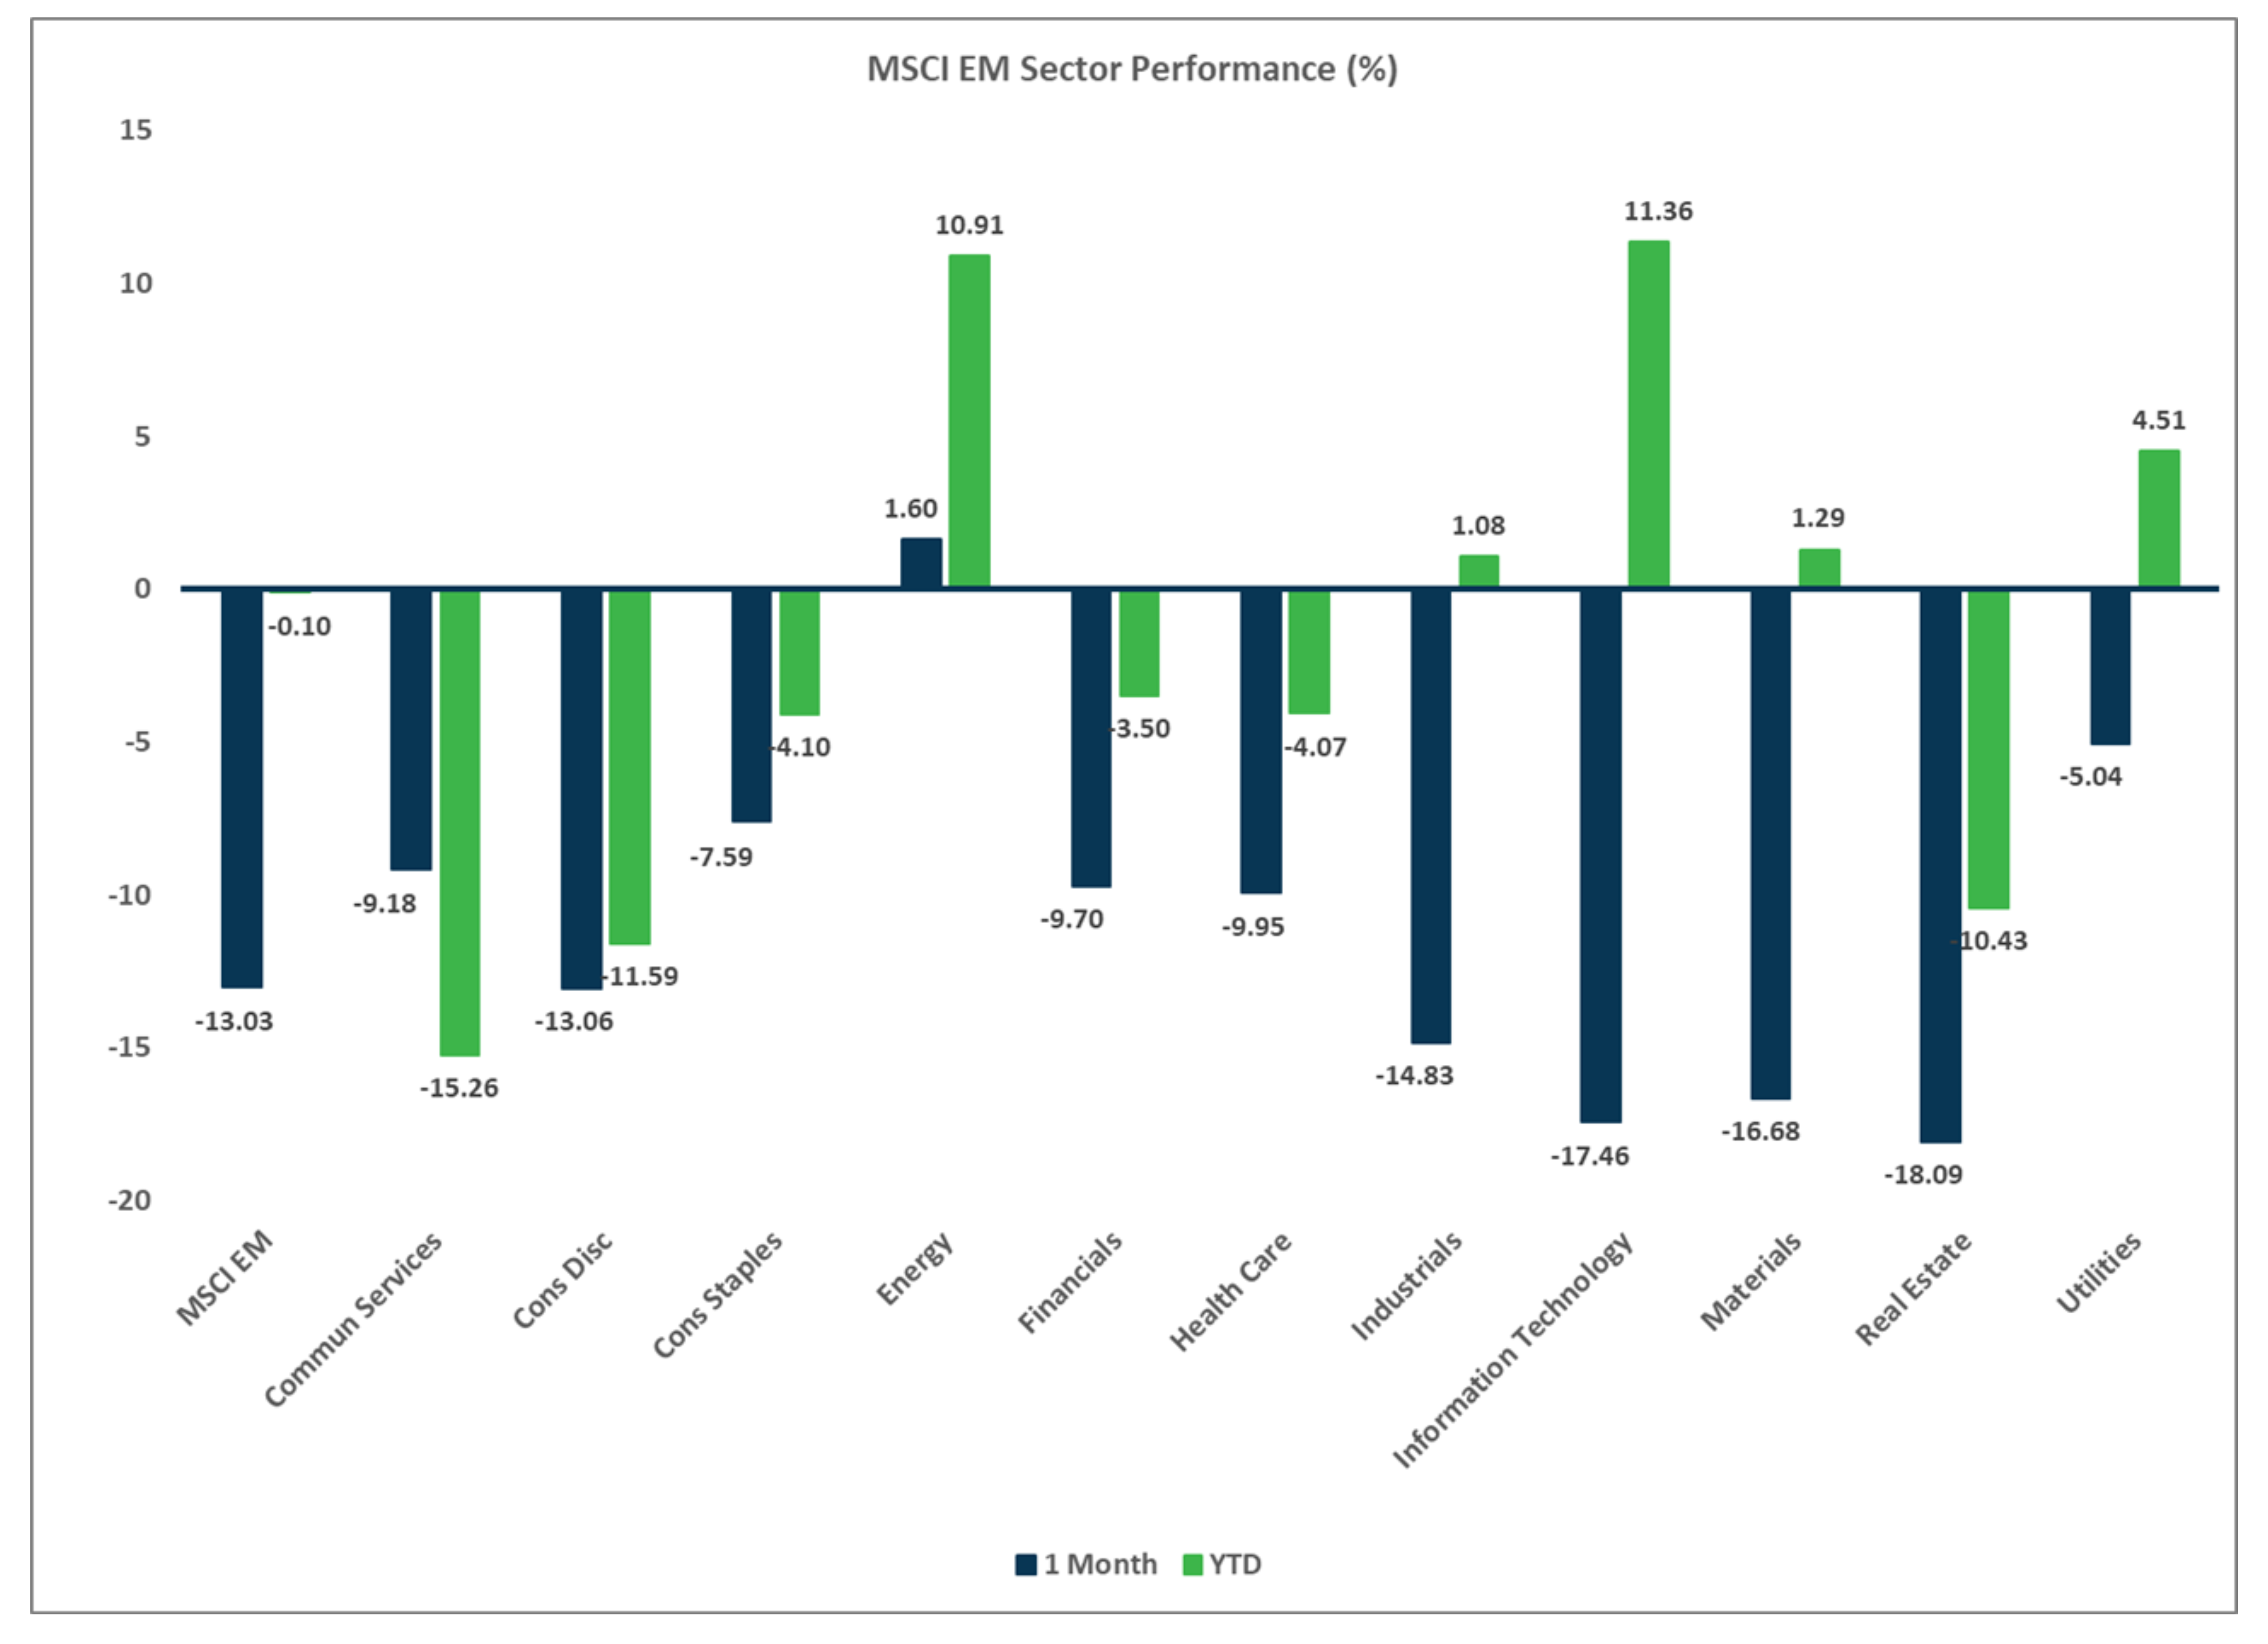
Sector Performance – MSCI EM (as of 3/31/26)
Disclosures
Investment services offered by Enterprise Bank & Trust are not deposits, obligations, or guaranteed by the bank or its affiliates. The information provided represents the opinions of Enterprise Bank & Trust and is not intended to forecast future events or guarantee future results. Past performance does not guarantee future returns. This information is for educational purposes only. Investors should consult with their investment professionals for advice concerning their particular situation.
Investments are: *Not FDIC insured *May lose value *Not financial institution guaranteed *Not a deposit *Not insured by any federal government agency.

