
May 2026 Market Update

Economic Highlights
United States
- U.S. employers added a better-than-expected 115,000 new jobs to the economy in April, ahead of the 55,000 forecast. The unemployment rate held at 4.3%, further proof that the labor market has reached a point where only modest job creation is needed to keep the jobless level steady. Average hourly earnings came in lower than expected, increasing 0.2% M/M and 3.6% Y/Y. The broader U6 unemployment rate ticked higher to 8.2% and the labor participation rate fell again to its lowest level since October 2021. This was a solid report, and the low-hire, low-fire environment continues.
- U.S. inflation increased at its fastest pace in three years in April, driven by higher energy prices due to the Iran war. The Personal Consumption Expenditures price index jumped 3.8% in the 12 months through April, the largest rise since May 2023. Excluding the volatile food and energy components, the Core PCE price index increased 3.3% Y/Y in April. Goods prices increased 0.7% last month, with the cost of gasoline and other energy products rising 5.5%. Food prices jumped 0.5%, the cost of housing increased 0.6% and overall services inflation rose 0.3%.
- U.S. retail sales rose 0.5% M/M in April, following an upwardly revised 1.6% gain in March. Retail spending was up across most categories last month, but it was down at furniture stores (-2%), car dealerships (-0.5%), department stores (-3.2%) and clothing shops (-1.5%). Meanwhile, sales at gas stations rose just 2.8% in April, down sharply from March’s steep 13.7% increase, which brought down the headline figure. Overall, we believe U.S. consumers remain resilient despite soaring gas prices. Core retail sales, which are used to calculate consumer spending in the GDP report, increased 0.5% M/M in April.
- April durable goods orders surged 7.9%, chalking up the largest increase in nearly a year. The result outpaced expectations for a 4% rise. March orders were revised higher, to 1.3% from 0.8%. Excluding transportation, orders advanced 1.1%, the same as in March. Transportation orders jumped 21.5%, led by a 166% rise in civilian aircraft orders. Boeing booked orders for 136 new planes in April, a sharp increase from 33 in the prior month. Gains in durable goods orders were broad-based, as nearly all industries booked increases. The one exception was computers and electronic product orders, which declined 0.7% after seven straight months of gains. Nondefense capital goods orders excluding aircraft, a proxy for capital spending, fell 1.1%, after rising 3.9% in March and 1.6% in February.
Non-U.S. Developed
- The eurozone flash composite PMI fell to its lowest level in 31 months with a reading of 47.5 in May (down from 48.8 in April). Services activity dropped to a 63-month low in May and the rebound in manufacturing activity weakened a bit to a three-month low. Prices rose at their quickest pace in 3.5 years, and this led to weakness in production, new orders and employment. Both France and Germany reported declines in business activity last month. Based on May’s PMI data, economists believe the eurozone economy should contract 0.2% in Q2.
- Japan’s economy grew at an annualized 2.1% in Q1 of 2026, beating expectations on the back of improved consumption and strong exports. Japan’s exports grew by a better-than-expected 11.5% Y/Y in March, partly powered by a 29.3% jump in shipments of semiconductor equipment. The Bank of Japan recently cut its GDP growth forecast for 2026 and raised its outlook for inflation. As a major energy importer, the Iran war is having a significant impact on corporate profits and household incomes.
Emerging Markets
- China’s official manufacturing PMI for May fell to 50.0 from 50.3 in April. The smaller-company focused RatingDog China Manufacturing PMI weakened a bit in May with a reading of 51.8, which was down from 52.2 in April. While the rate of growth slowed, it remained among the highest observed over the past five years. One important data point was the decline in input prices for the first time this year. We believe that the Chinese economy continues to exhibit uneven momentum, with strength in services and weakness in manufacturing and construction.
- The China non-manufacturing PMI, which includes services and construction, rose to 50.1 from 49.4 in April, helped by a surge in travel spending during the five-day May Day holiday at the start of the month. The services component rose to a five-month high at 50.3.
- The Indian economy is expected to remain resilient in 2026 and 2027 despite a challenging global environment marked by high energy and commodity prices, rising logistics costs, volatile financial markets and ongoing trade uncertainty. The Reserve Bank of India (RBI) projected India’s real GDP growth at 6.9% for 2026-27, assuming the impact of the Middle East conflict remains contained. Risks are tilted to the downside due to significant global geopolitical uncertainty. The RBI also projects inflation of 4.6% for 2026-27, with risk to the upside.
- Brazil’s economy rebounded in Q1 with GDP growth of 1.1% Q/Q, supported by stronger investment and consumer spending. Consumer spending rose 1% while investment increased 3.5%. Brazil’s economy is forecast to grow 2-2.5% this year, but like most countries, inflation remains well above the central bank’s 3% target. This creates a murky picture for future monetary policy action.
Market Performance (as of 5/31/26)
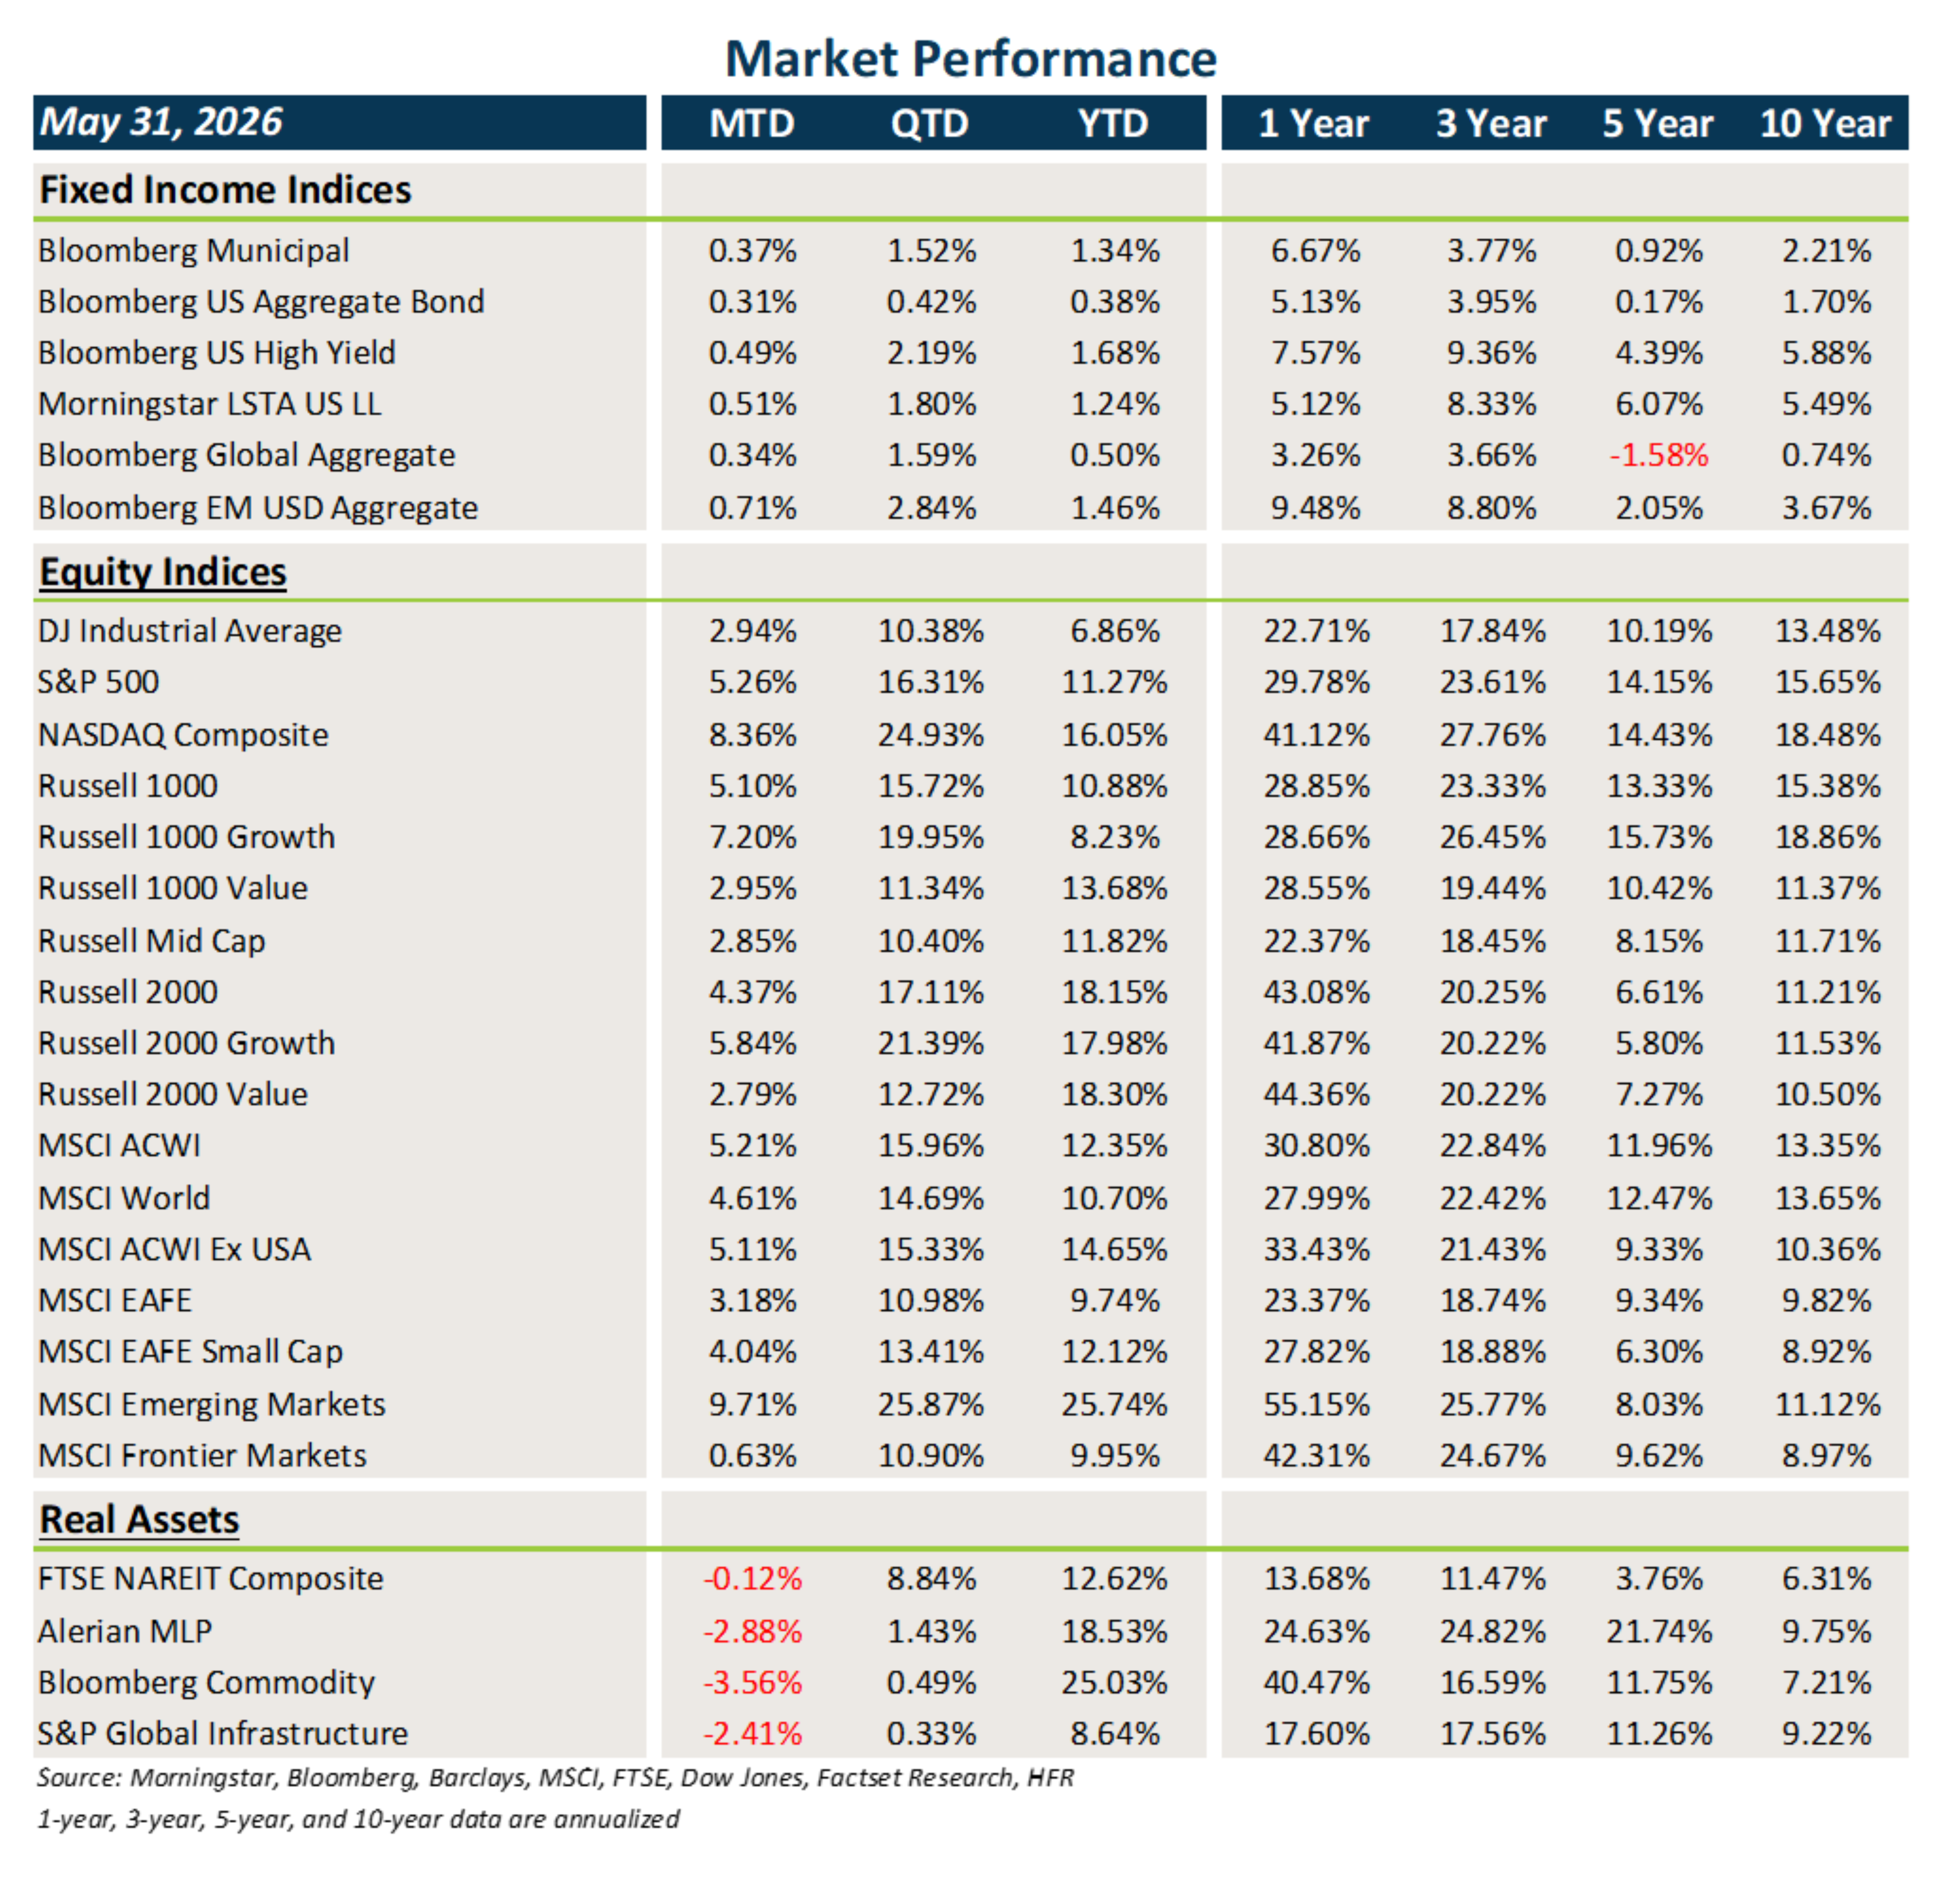
Fixed Income
- Core fixed income and municipal bonds got a boost from lower Treasury and other sovereign debt yields in May.
- Credit spreads modestly tightened last month, leading to another positive month of clipping coupons.
- Bonds outside the U.S. posted modest gains in May but were held back a bit by the stronger U.S. dollar.
U.S. Equities
- U.S. equities posted strong gains in May, driven by strength in growth/tech stocks and the broader AI theme.
- Large caps outperformed small caps last month, and value stocks underperformed growth stocks across all market caps.
- The tech-heavy Nasdaq was the best performing U.S. index last month. Earnings remain supportive of current U.S. equity valuations.
Non-U.S. Equities
- EAFE equities performed well in May but lagged U.S. equities. EM equities posted an exceptional gain of 9.7%.
- Within non-U.S. equities, growth outpaced value, but unlike what occurred in the U.S., small caps beat large caps.
- U.S. dollar strength hurt EAFE returns by 62 bps in May. EM currencies held up better versus the USD, creating little dispersion between local and USD returns.
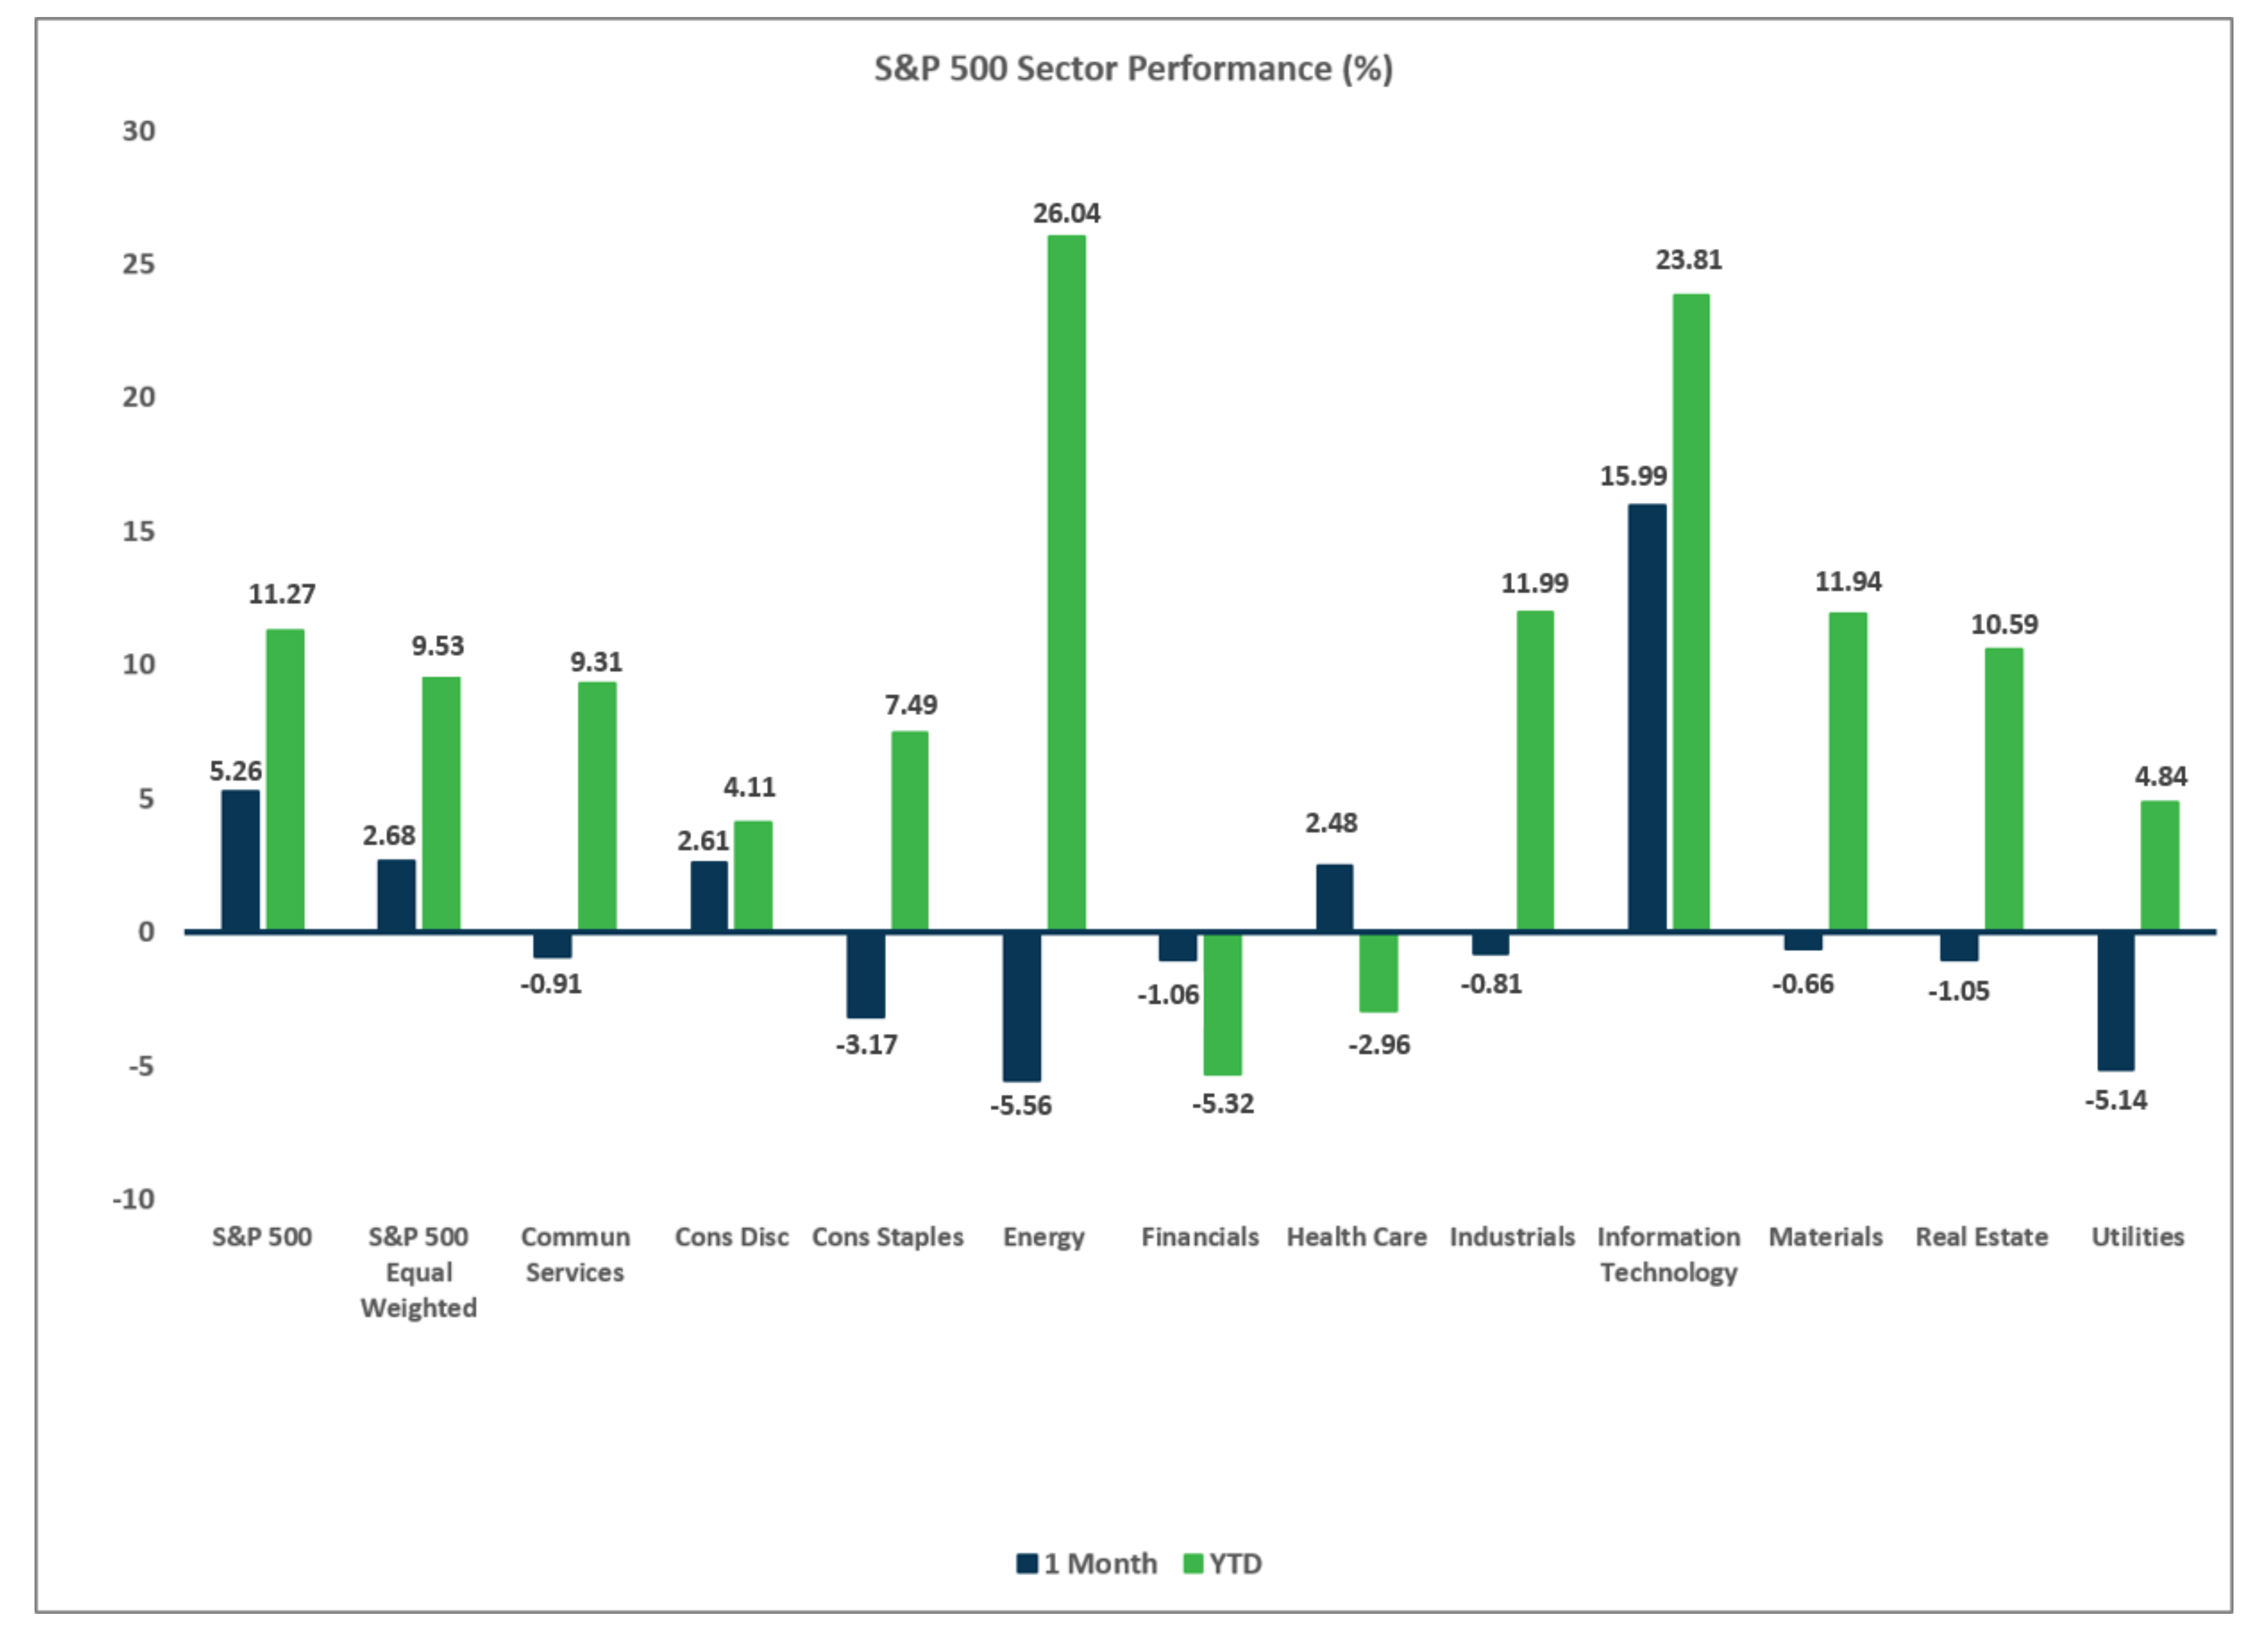
Sector Performance – S&P 500 (as of 5/31/26)
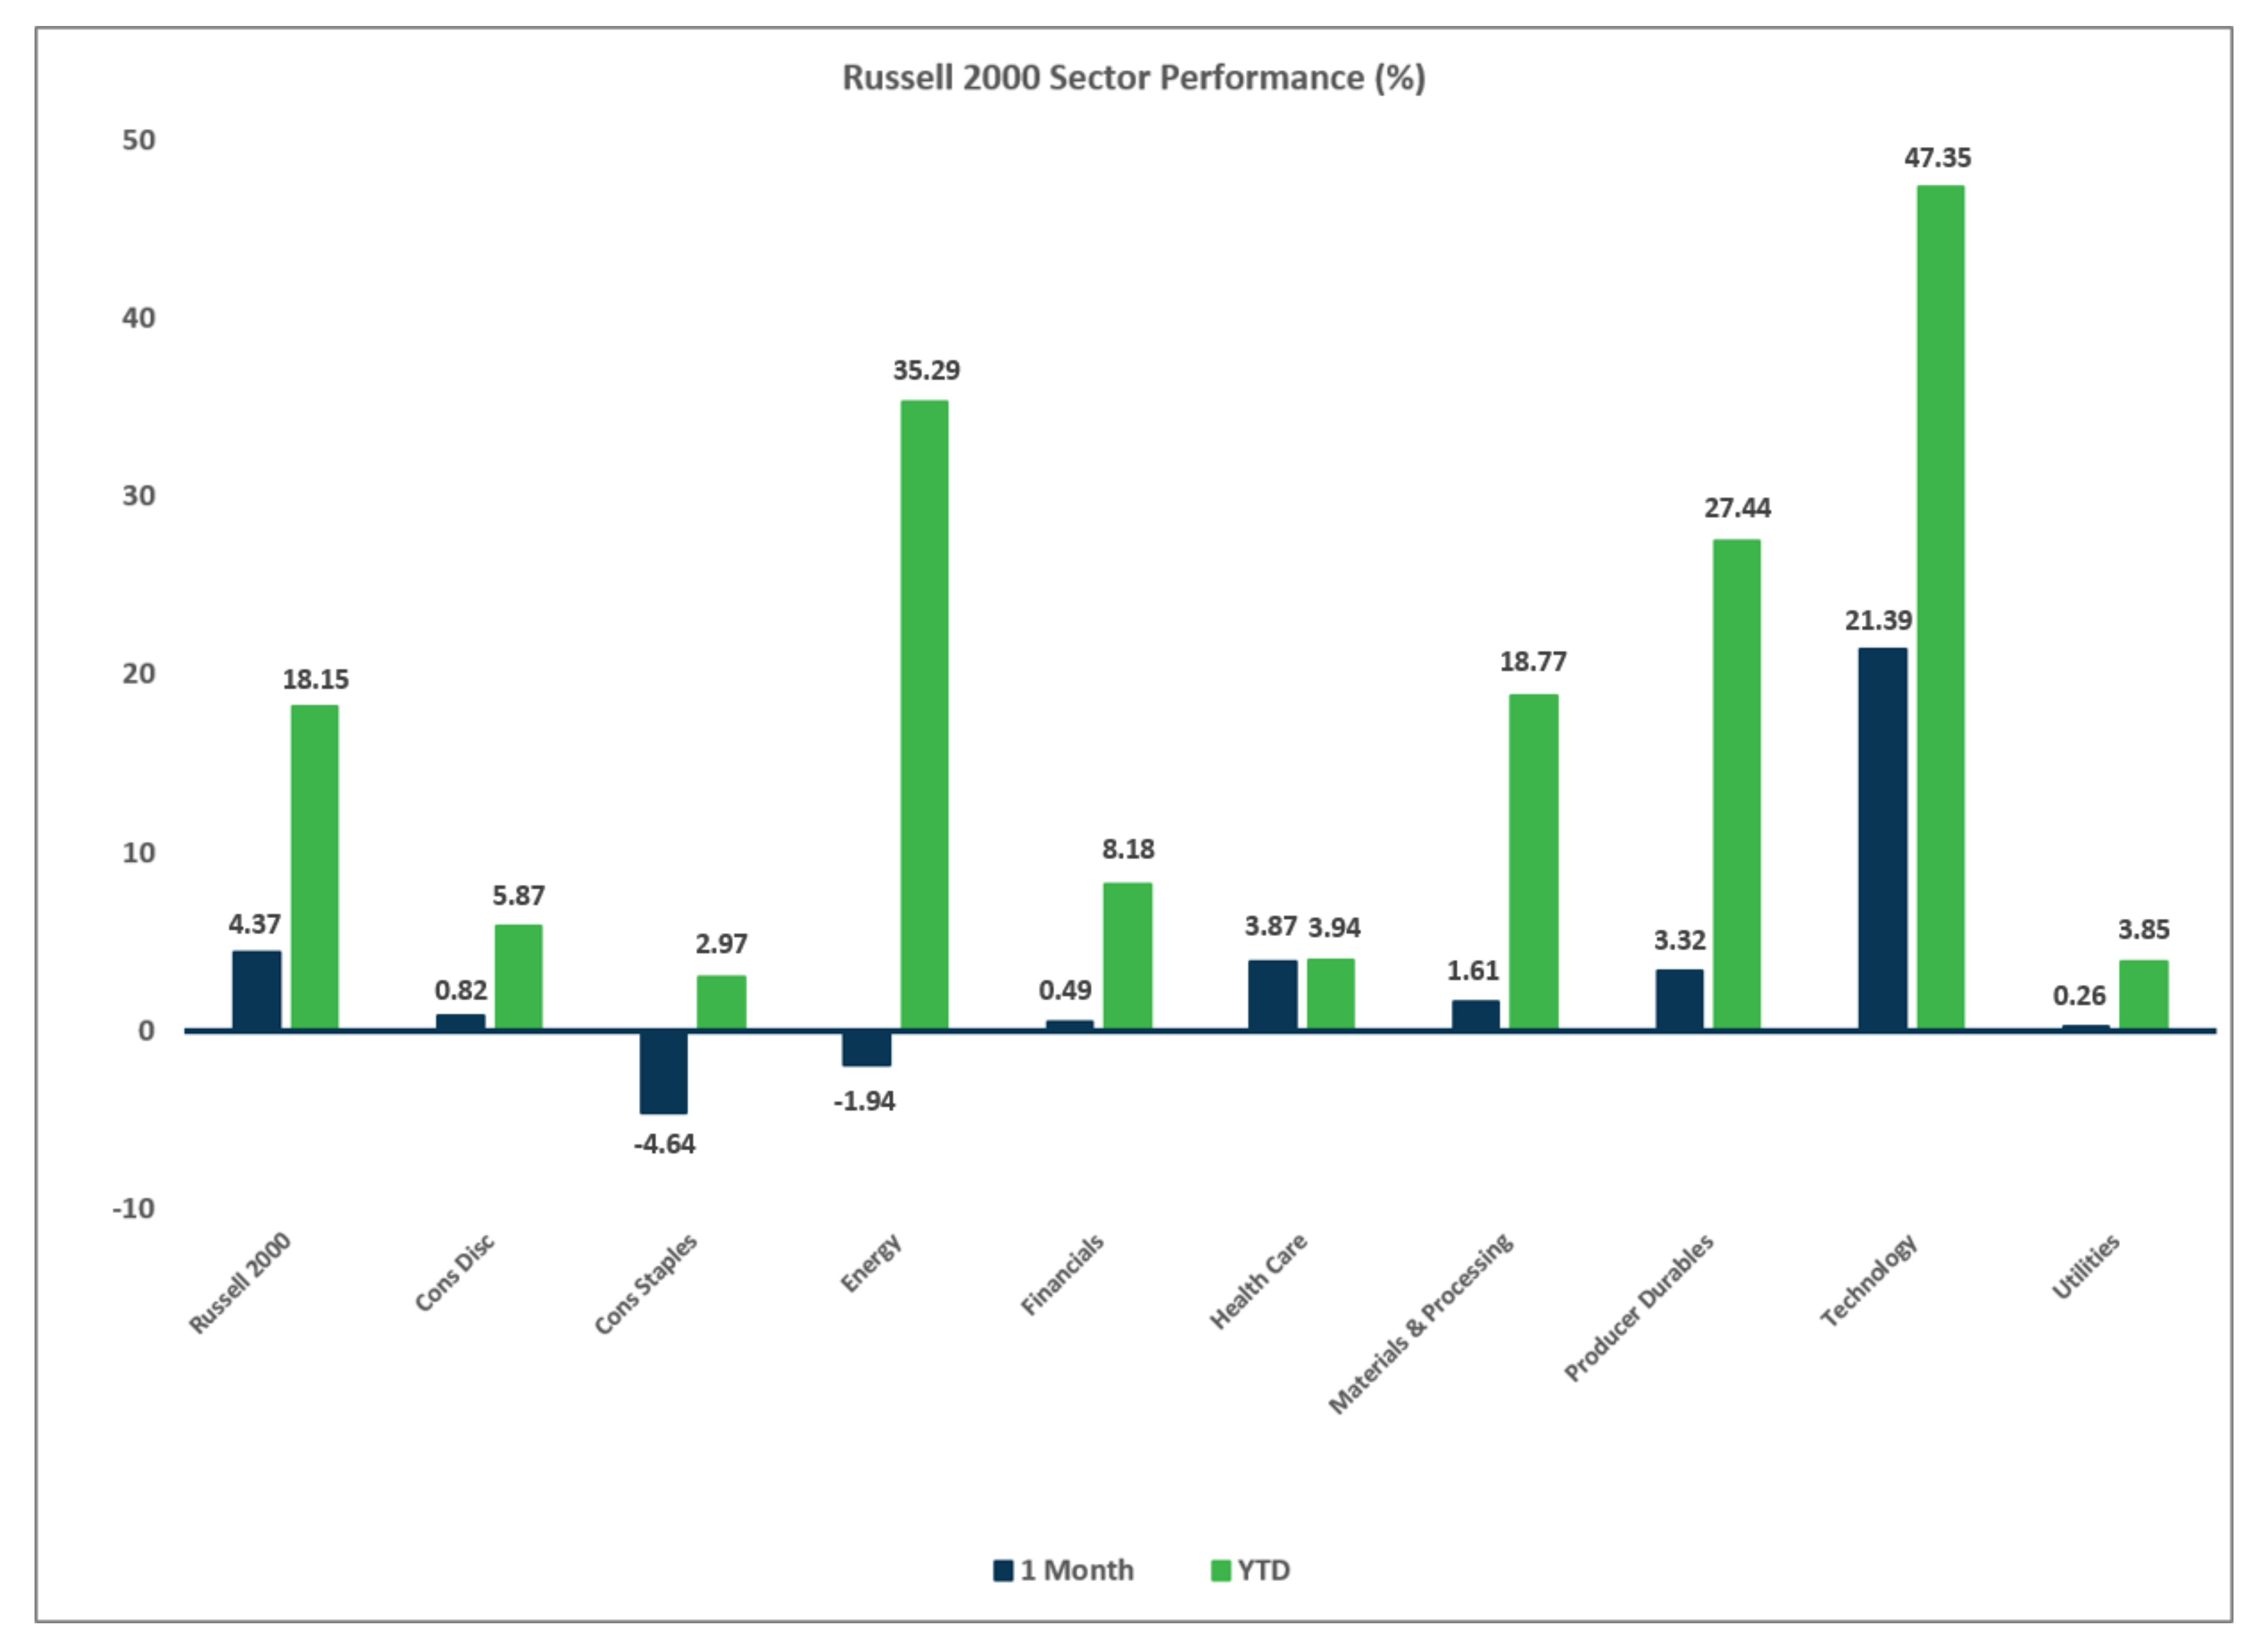
Sector Performance – Russell 2000 (as of 5/31/26)
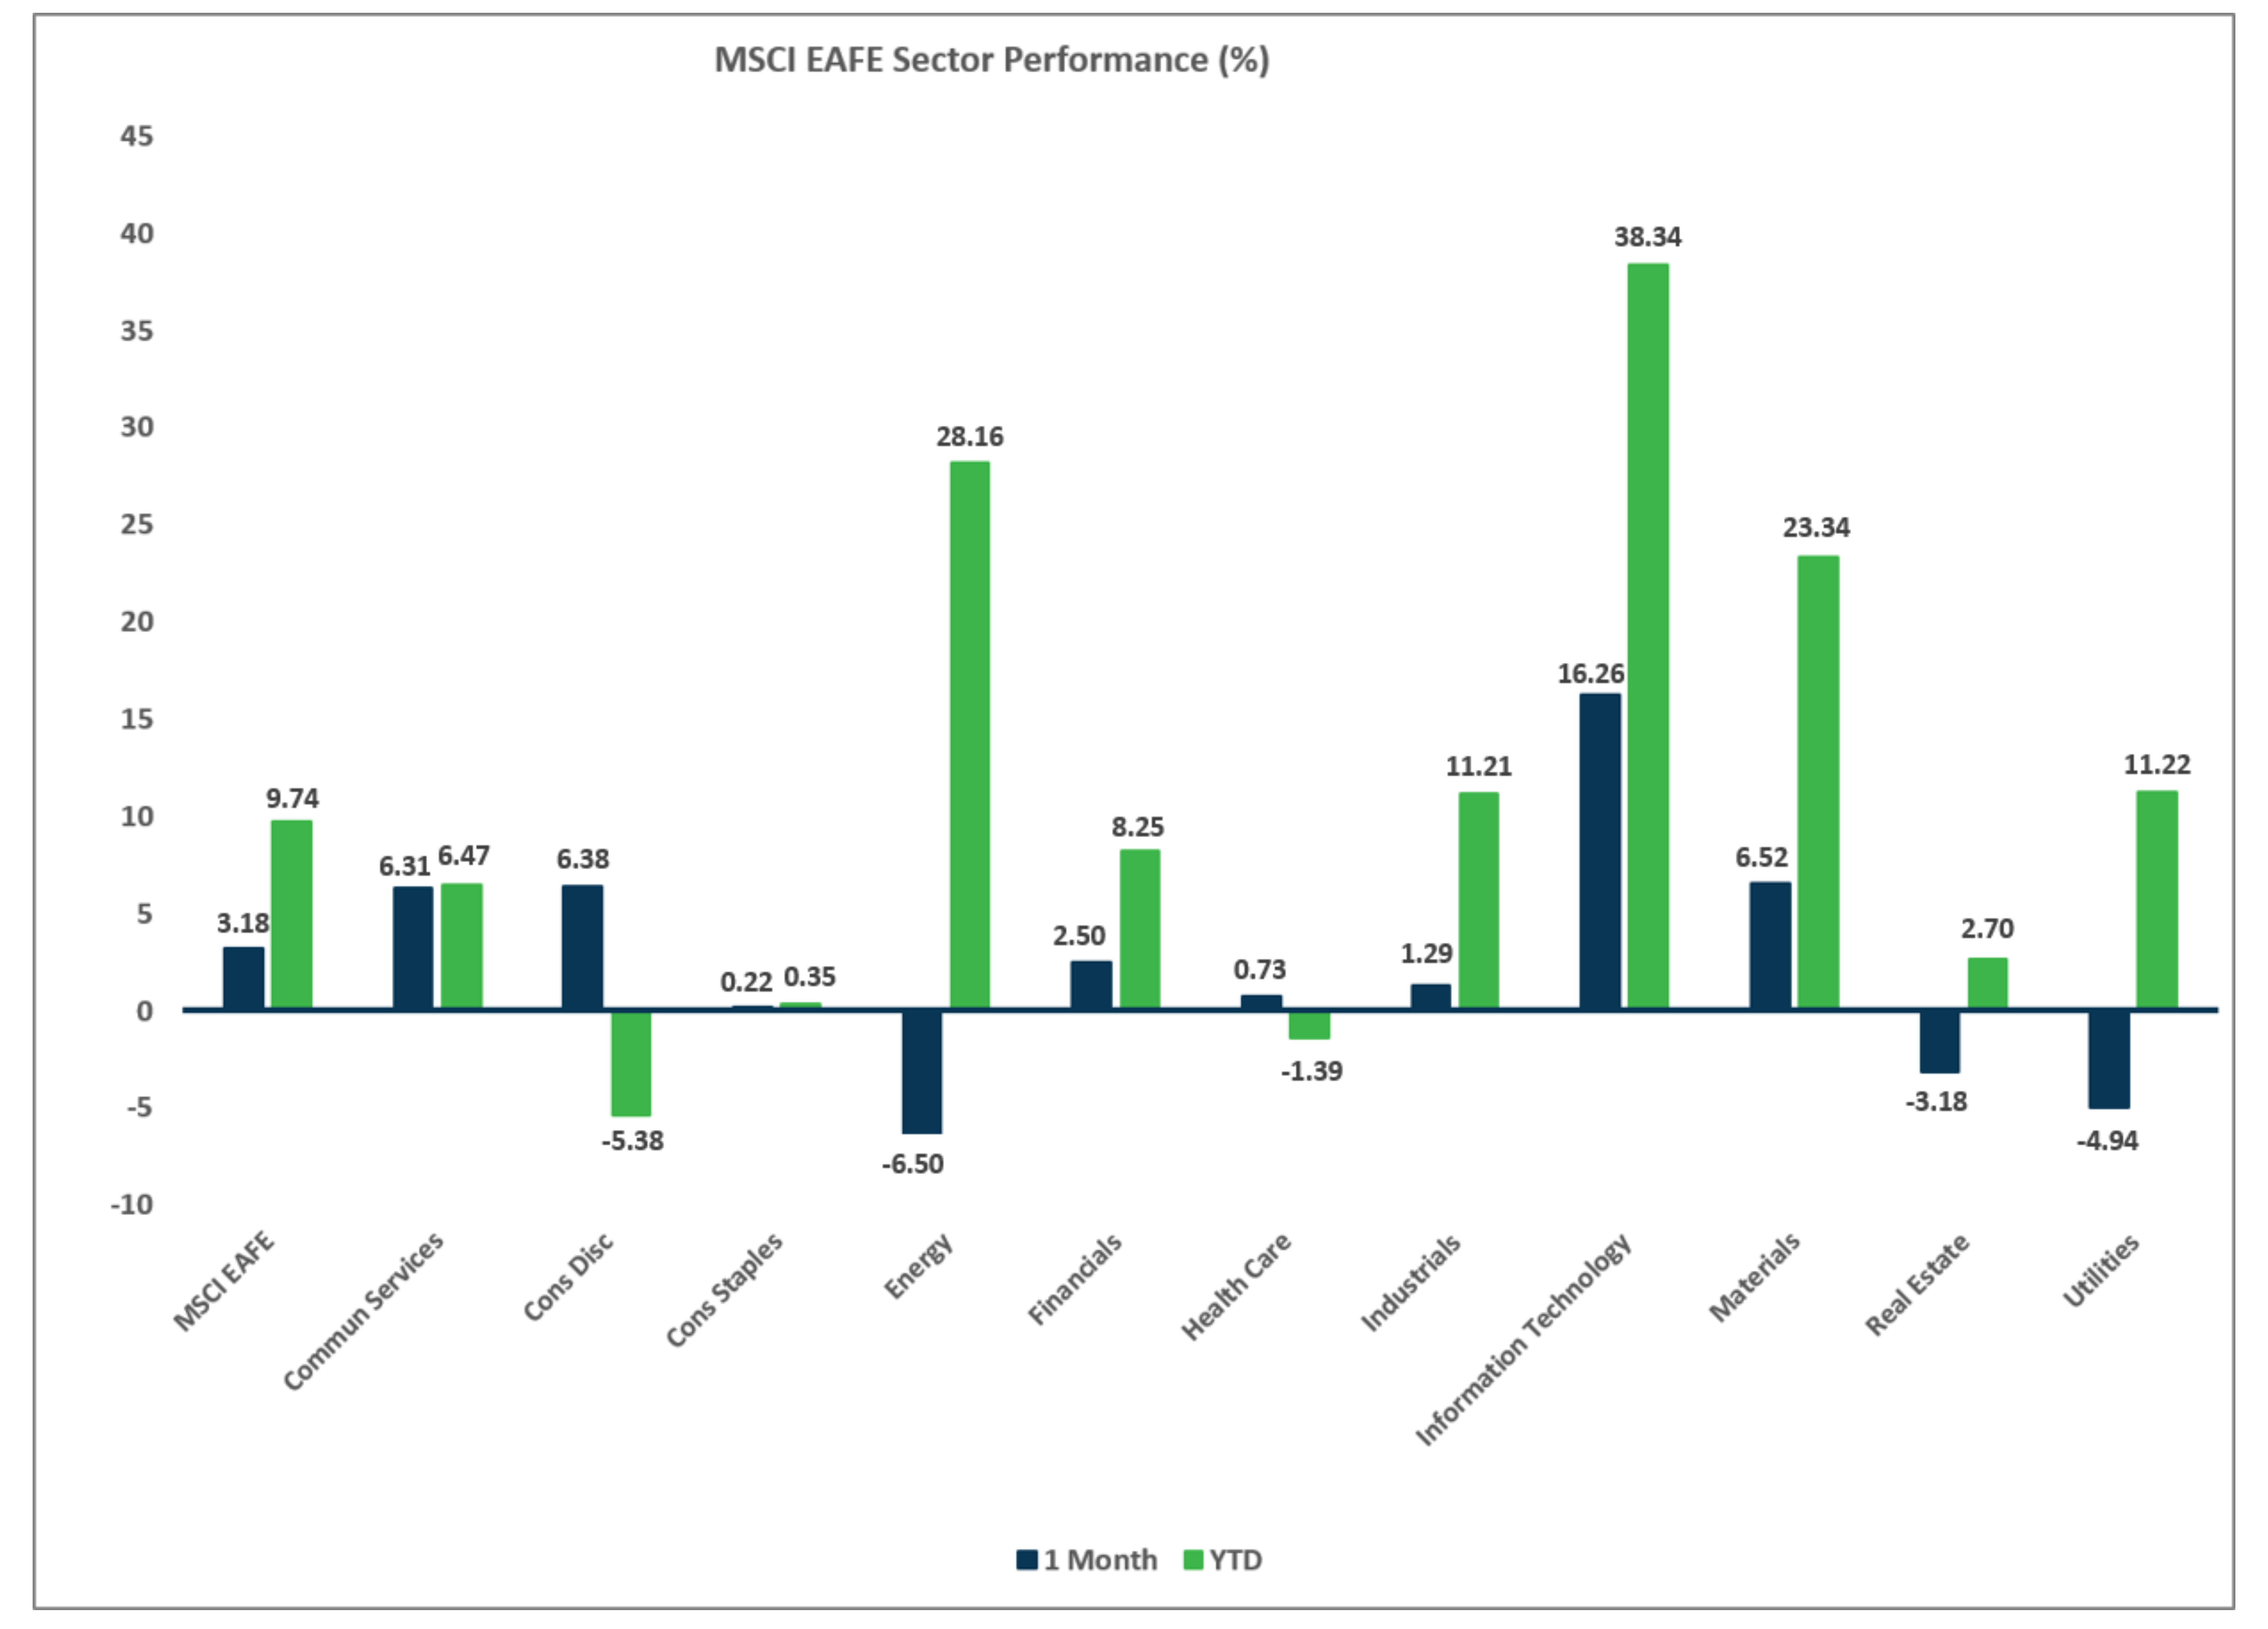
Sector Performance – MSCI EAFE (as of 5/31/26)
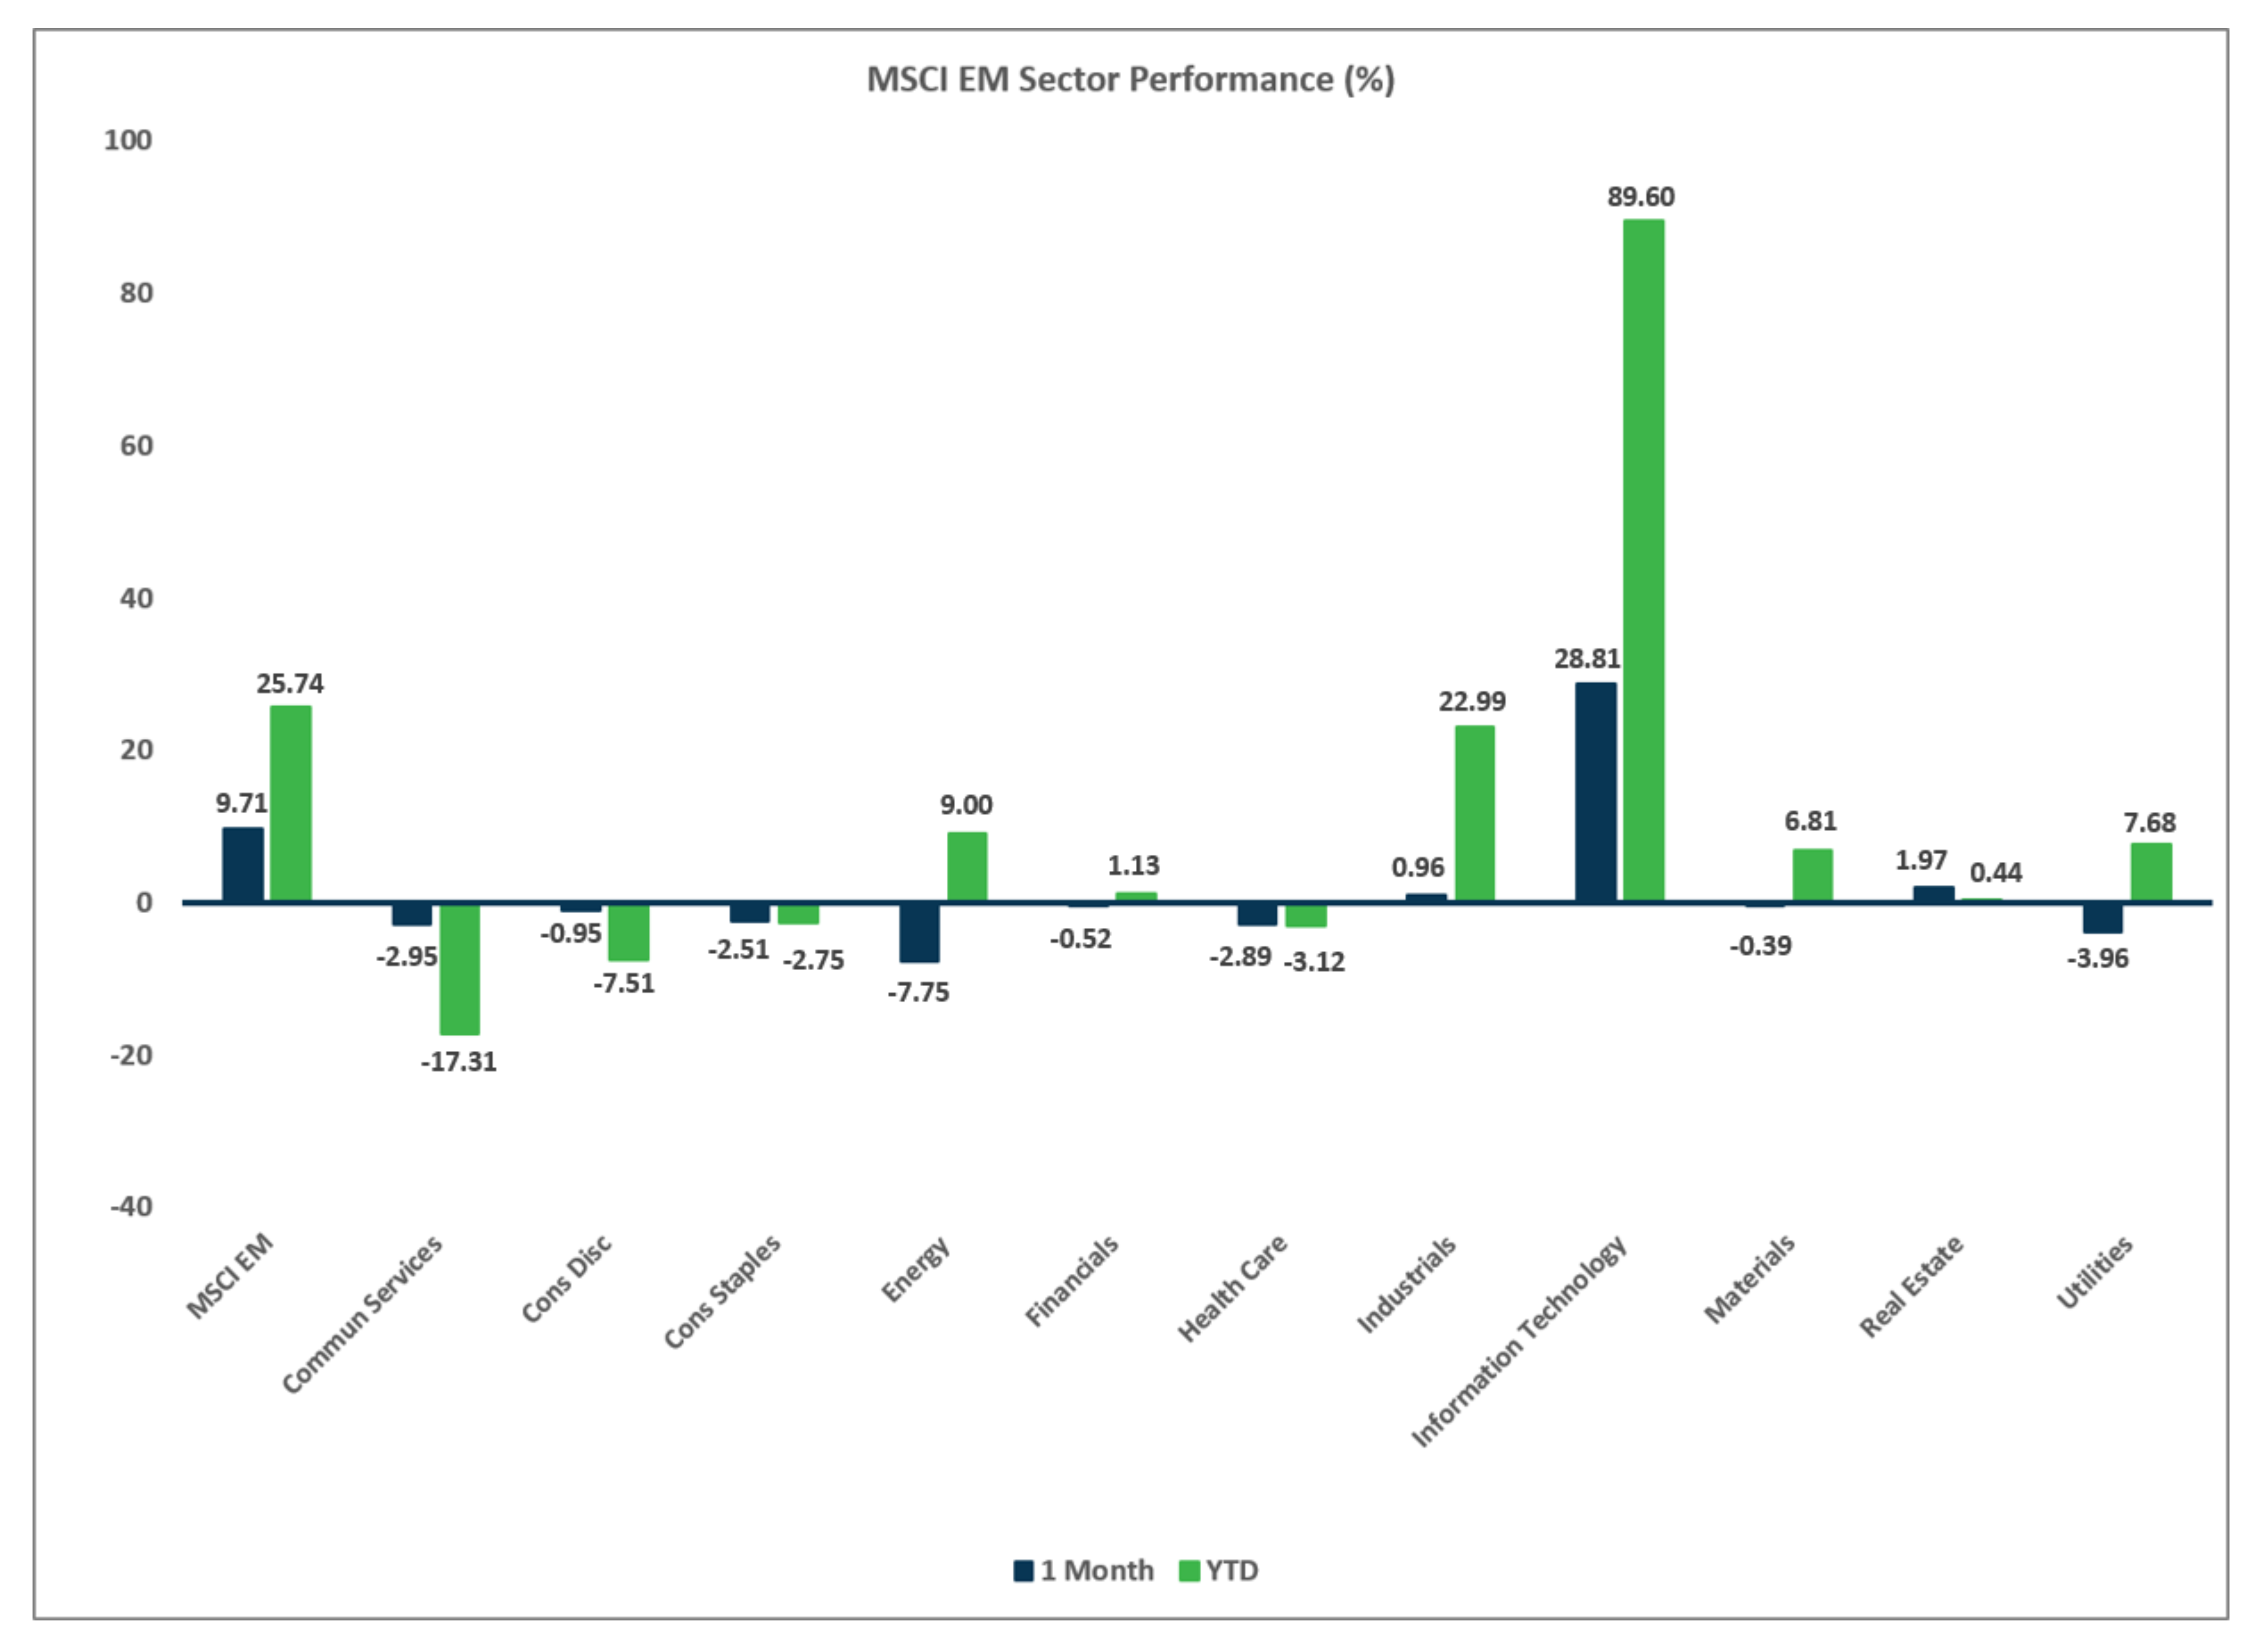
Sector Performance – MSCI EM (as of 5/31/26)
Disclosures
Investment services offered by Enterprise Bank & Trust are not deposits, obligations, or guaranteed by the bank or its affiliates. The information provided represents the opinions of Enterprise Bank & Trust and is not intended to forecast future events or guarantee future results. Past performance does not guarantee future returns. This information is for educational purposes only. Investors should consult with their investment professionals for advice concerning their particular situation.
Investments are: *Not FDIC insured *May lose value *Not financial institution guaranteed *Not a deposit *Not insured by any federal government agency.

